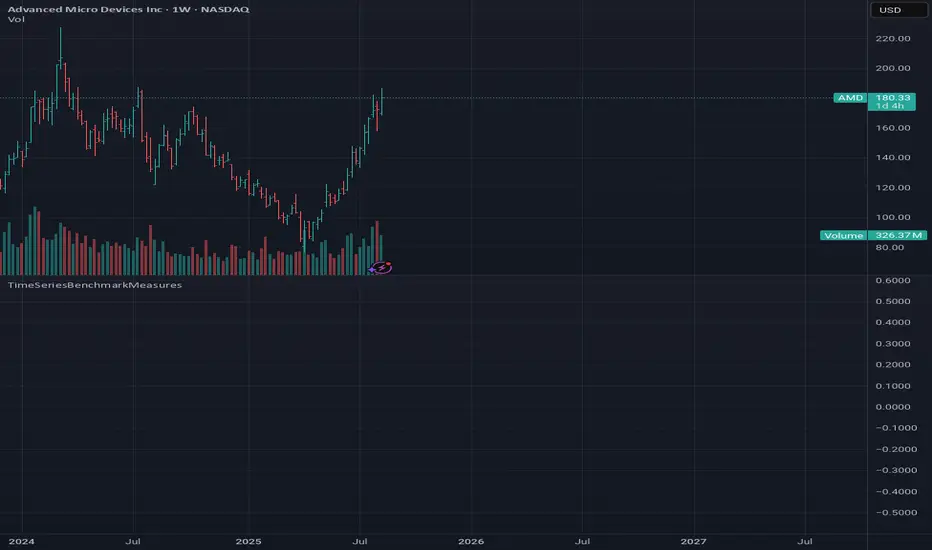
TimeSeriesBenchmarkMeasuresLibrary "TimeSeriesBenchmarkMeasures"
Time Series Benchmark Metrics. \
Provides a comprehensive set of functions for benchmarking time series data, allowing you to evaluate the accuracy, stability, and risk characteristics of various models or strategies. The functions cover a wide range of statistical measures, including accuracy metrics (MAE, MSE, RMSE, NRMSE, MAPE, SMAPE), autocorrelation analysis (ACF, ADF), and risk measures (Theils Inequality, Sharpness, Resolution, Coverage, and Pinbal
Function
ATR RopeATR Rope is inspired by DonovanWall's "Range Filter". It implements a similar concept of filtering out smaller market movements and adjusting only for larger moves. In addition, this indicator goes one step deeper by producing actionable zones to determine market state. (Trend vs. Consolidation)
> Background
When reading up on the Range Filter indicator, it reminded me exactly of a Rope stabilization drawing tool in a program I use frequently. Rope stabilization essentially attaches a fixed
MathSpecialFunctionsConvolve1DLibrary "MathSpecialFunctionsConvolve1D"
Convolution is one of the most important mathematical operations used in signal processing. This simple mathematical operation pops up in many scientific and industrial applications, from its use in a billion-layer large CNN to simple image denoising.
___
Reference:
www.algorithm-archive.org
numpy.org
lloydrochester.com
www.geeksforgeeks.org
f(signal, filter)
Convolve
Parameters:
signal (array) : List with signal data.
filter (array) :
FunctionSurvivalEstimationLibrary "FunctionSurvivalEstimation"
The Survival Estimation function, also known as Kaplan-Meier estimation or product-limit method, is a statistical technique used to estimate the survival probability of an individual over time. It's commonly used in medical research and epidemiology to analyze the survival rates of patients with different treatments, diseases, or risk factors.
What does it do?
The Survival Estimation function takes into account censored observations (i.e., individuals w
腳本庫
Weierstrass Function (Fractal Cycles)THE WEIERSTRASS FUNCTION
f(x) = ∑(n=0)^∞ a^n * cos(b^n * π * x)
The Weierstrass Function is the sum of an infinite series of cosine functions, each with increasing frequency and decreasing amplitude. This creates powerful multi-scale oscillations within the range ⬍(-2;+2), resembling a system of self-repetitive patterns. You can zoom into any part of the output and observe similar proportions, mimicking the hidden order behind the irregularity and unpredictability of financial markets.
IT
指標
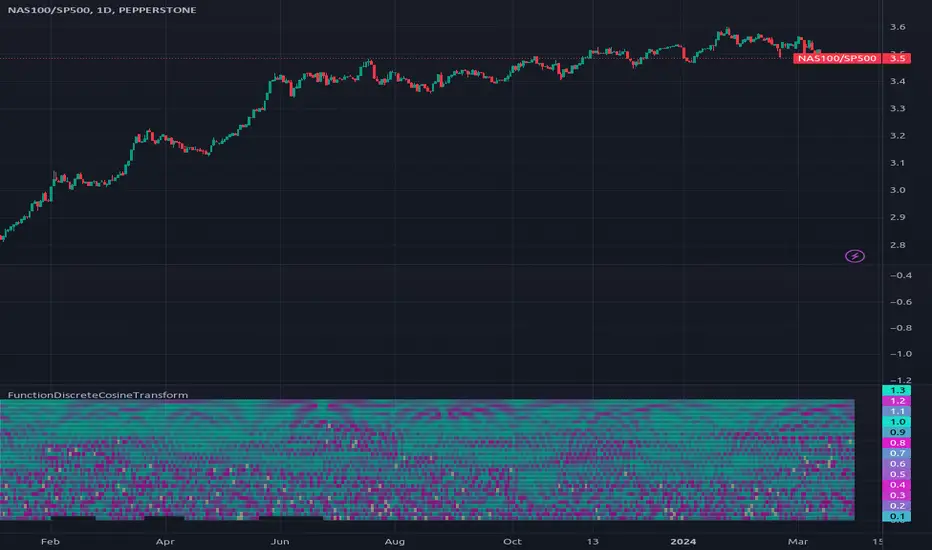
FunctionDiscreteCosineTransformLibrary "FunctionDiscreteCosineTransform"
Discrete Cosine Transform (DCT)
The Discrete Cosine Transform (DCT) is a mathematical algorithm that converts a series of samples of a signal, typically in the time domain, into another domain called the frequency or spectral domain. It's commonly used for data compression and image/video coding applications such as JPEG and MPEG standards.
The DCT works by multiplying the input sequence with specific cosine functions that are pre-defined and then sum
腳本庫
TimeSeriesClassificationActivationFunctionsLibrary "TimeSeriesClassificationActivationFunctions"
Provides some activation functions useful in time series classification.
___
reference:
github.com
method scale(dist, weights)
Activate values by a normalized scale.
Namespace types: map
Parameters:
dist (map) : Source distribution map.
weights (map) : Weights distribution map.
Returns: Normalized distribution map.
method softmax(dist, weights)
Activate values with a softmax algorithm.
Namespace types: map
Pa
腳本庫
FunctionsLibrary "Functions"
half_candle()
Half Candles
Returns: half candles (difference between open and close)
super_smoother(source, len)
Ehlers Super Smoother
Parameters:
source (float) : Source
len (int)
Returns: super smoothed moving average
quotient(length, K)
Ehlers early onset trend
Parameters:
length (int) : Length (default = 1)
K (float) : Factor (default = 0.8)
Returns: Ehlers early onset trend
butterworth_2Pole(src, length)
Ehlers 2 Pole
腳本庫
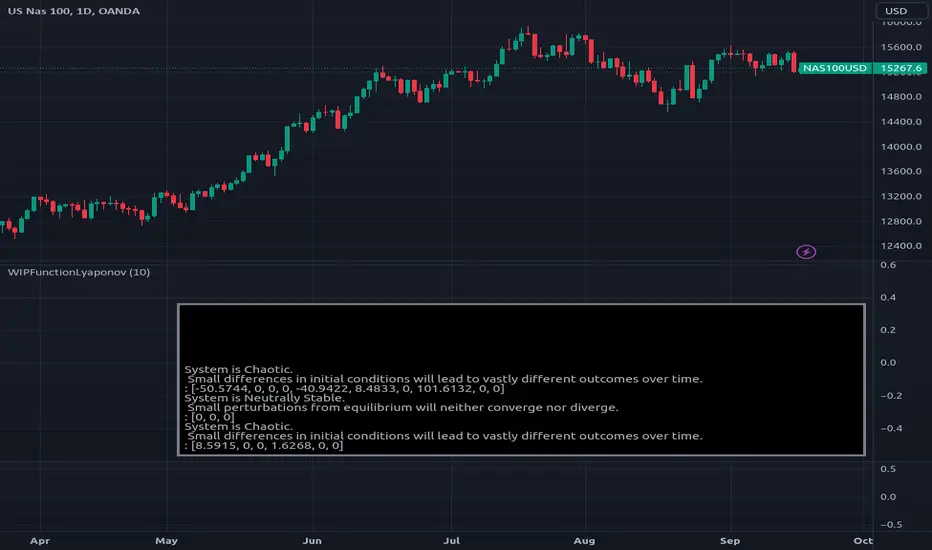
WIPFunctionLyaponovLibrary "WIPFunctionLyaponov"
Lyapunov exponents are mathematical measures used to describe the behavior of a system over
time. They are named after Russian mathematician Alexei Lyapunov, who first introduced the concept in the
late 19th century. The exponent is defined as the rate at which a particular function or variable changes
over time, and can be positive, negative, or zero.
Positive exponents indicate that a system tends to grow or expand over time, while negative exponents
indicate t
腳本庫
CommonTypesMapUtilLibrary "CommonTypesMapUtil"
Common type Container library, for central usage across other reference libraries.
ArrayBool
Fields:
v (bool )
ArrayBox
Fields:
v (box )
ArrayPoint
Fields:
v (chart.point )
ArrayColor
Fields:
v (color )
ArrayFloat
Fields:
v (float )
ArrayInt
Fields:
v (int )
ArrayLabel
Fields:
v (label )
ArrayLine
Fields:
v (line )
ArrayLinefill
Fields:
v (linefill )
ArrayString
腳本庫
SimilarityMeasuresLibrary "SimilarityMeasures"
Similarity measures are statistical methods used to quantify the distance between different data sets
or strings. There are various types of similarity measures, including those that compare:
- data points (SSD, Euclidean, Manhattan, Minkowski, Chebyshev, Correlation, Cosine, Camberra, MAE, MSE, Lorentzian, Intersection, Penrose Shape, Meehl),
- strings (Edit(Levenshtein), Lee, Hamming, Jaro),
- probability distributions (Mahalanobis, Fidelity, Bhattacharyya, Hell
FunctionMatrixCovarianceLibrary "FunctionMatrixCovariance"
In probability theory and statistics, a covariance matrix (also known as auto-covariance matrix, dispersion matrix, variance matrix, or variance–covariance matrix) is a square matrix giving the covariance between each pair of elements of a given random vector.
Intuitively, the covariance matrix generalizes the notion of variance to multiple dimensions. As an example, the variation in a collection of random points in two-dimensional space cannot be characteri
腳本庫
Vector3Library "Vector3"
Representation of 3D vectors and points.
This structure is used to pass 3D positions and directions around. It also contains functions for doing common vector operations.
Besides the functions listed below, other classes can be used to manipulate vectors and points as well.
For example the Quaternion and the Matrix4x4 classes are useful for rotating or transforming vectors and points.
___
**Reference:**
- github.com
- github.com
- github.com
- www.movable-type.co.uk
- docs.
BenfordsLawLibrary "BenfordsLaw"
Methods to deal with Benford's law which states that a distribution of first and higher order digits
of numerical strings has a characteristic pattern.
"Benford's law is an observation about the leading digits of the numbers found in real-world data sets.
Intuitively, one might expect that the leading digits of these numbers would be uniformly distributed so that
each of the digits from 1 to 9 is equally likely to appear. In fact, it is often the case that 1 occurs mor
腳本庫
MathEasingFunctionsLibrary "MathEasingFunctions"
A collection of Easing functions.
Easing functions are commonly used for smoothing actions over time, They are used to smooth out the sharp edges
of a function and make it more pleasing to the eye, like for example the motion of a object through time.
Easing functions can be used in a variety of applications, including animation, video games, and scientific
simulations. They are a powerful tool for creating realistic visual effects and can help to make your work
Vector2FunctionClipLibrary "Vector2FunctionClip"
Sutherland-Hodgman polygon clipping algorithm.
reference:
.
rosettacode.org
.
clip(source, reference)
Perform Clip operation on a vector with another.
Parameters:
source : array . Source polygon to be clipped.
reference : array . Reference polygon to clip source.
Returns: array.
腳本庫
Vector2ArrayLibrary "Vector2Array"
functions to handle vector2 Array operations.
.
references:
docs.unity3d.com
gist.github.com
github.com
gist.github.com
gist.github.com
gist.github.com
.
from(source, prop_sep, vect_sep)
Generate array of vector2 from string.
Parameters:
source : string Source string of the vectors.
prop_sep : string Separator character of the vector properties (x`,`y).
vect_sep : string Separator character of the vectors ((x,y)`;`(x,y)).
Returns: array.
max(ve
腳本庫
Segment2Library "Segment2"
Structure representation of a directed straight line in two dimensions from origin to target vectors.
.
reference:
graphics.stanford.edu
.
new(origin, target)
Generate a new segment.
Parameters:
origin : Vector2 . Origin of the segment.
target : Vector2 . Target of the segment.
Returns: Segment2.
new(origin_x, origin_y, target_x, target_y)
Generate a new segment.
Parameters:
origin_x : float . Origin of the segment x coordinate.
origin_y
腳本庫
Vector2DrawQuadLibrary "Vector2DrawQuad"
functions to handle vector2 Quad drawing operations.
new(a, b, c, d, xloc, bg_color, line_color, line_style, line_width)
Draws a quadrilateral with background fill.
Parameters:
a : v2 . Vector2 object, in the form `(x, y)`.
b : v2 . Vector2 object, in the form `(x, y)`.
c : v2 . Vector2 object, in the form `(x, y)`.
d : v2 . Vector2 object, in the form `(x, y)`.
xloc : string . Type of axis unit, bar_index or time.
腳本庫
Vector2DrawTriangleLibrary "Vector2DrawTriangle"
Functions to draw a triangle and manipulate its properties.
new(a, b, c, xloc, bg_color, line_color, line_style, line_width)
Draws a triangle with background fill using line prototype.
Parameters:
a : v2 . Vector2 object, in the form `(x, y)`.
b : v2 . Vector2 object, in the form `(x, y)`.
c : v2 . Vector2 object, in the form `(x, y)`.
xloc : string . Type of axis unit, bar_index or time.
bg_color : color . Color of th
腳本庫
CommonTypesDrawingLibrary "CommonTypesDrawing"
Provides a common library source for common types of used graphical drawing structures.
Includes: `Triangle, Quad, Polygon`
Triangle
Representation of a triangle using lines and linefill.
Fields:
ab : Edge of point a to b.
bc : Edge of point b to c.
ca : Edge of point c to a.
fill : Fill of the object.
solid : Check if polygon should have a fill.
Quad
Representation of a quadrilateral using lines and linefill.
Fields:
ab
腳本庫
Vector2DrawLineLibrary "Vector2DrawLine"
Extends line type with methods for Vector2 and Segment2.
new(origin, target, xloc, extend, color, style, width)
Draws a line using Segment type to hold its coordinate properties..
Parameters:
origin : Vector2 . Origin vector of the line.
target : Vector2 . Target vector of the line.
xloc : string
extend : string
color : color
style : string
width : int
Returns: line object
new(segment, xloc, extend, color, style, width)
腳本庫
Vector2Library "Vector2"
Representation of two dimensional vectors or points.
This structure is used to represent positions in two dimensional space or vectors,
for example in spacial coordinates in 2D space.
~~~
references:
docs.unity3d.com
gist.github.com
github.com
gist.github.com
gist.github.com
gist.github.com
~~~
new(x, y)
Create a new Vector2 object.
Parameters:
x : float . The x value of the vector, default=0.
y : float . The y value of the vector, default=0.
Returns: Vect
腳本庫
Vector ScalerVector Scaler is like Stochastic but it uses a different method to scale the input. The method is very similar to vector normalization but instead of keeping the "vector" we just sum the three points and average them. The blue line is the signal line and the orange line is the smoothed signal line. I have added the "J" line from the KDJ indicator to help spot divergences. Differential mode uses the delta of the input for the calculations. Here are some pictures to help illustrate how this works
指標