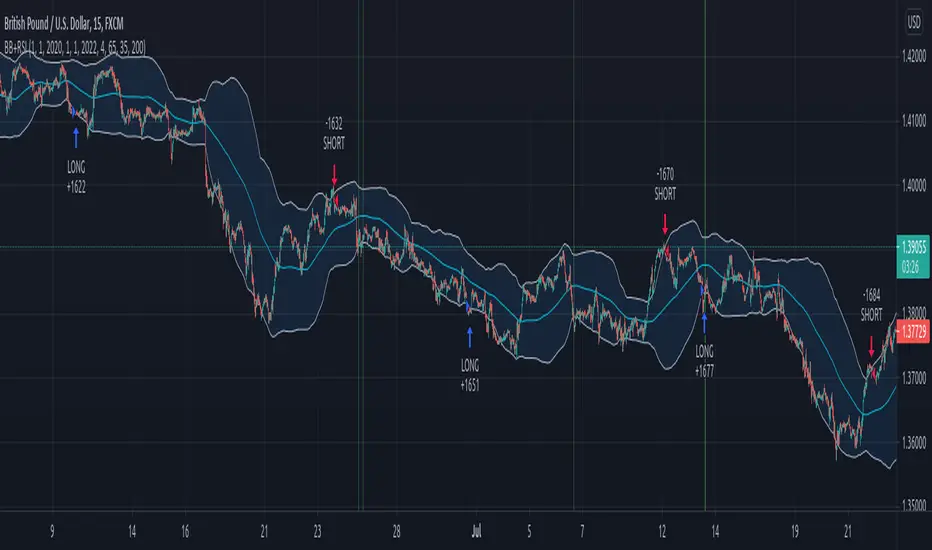
4HR JRSX Swing Bias (RB Trading)4HR JRSX Swing Bias (RB Trading)
The 4HR JRSX Swing Bias is a higher timeframe swing analysis script designed to evaluate directional pressure, momentum decay, and price acceptance on the four hour chart. It is built specifically for GBPUSD and EURUSD and is not intended for use on other markets or timeframes.
It highlights conditions where directional pressure weakens, rotates, and is then confirmed by price behavior.
Intended Use and Scope
• Timeframe: 4 hour only
• Markets: GBPUSD and EURUSD
• Style: Swing bias and rotation analysis
• Signal frequency: Intentionally low, typically 10 to 15 setups per year per pair
• Alerts: Available for confirmed setups
• Not designed for Asia session conditions
Core Framework
The script operates through a sequential three-stage process. A setup can only appear when all stages align.
Directional pressure evaluation
Momentum exhaustion and rotation
Candle-based price confirmation
This structure prevents signals from appearing during noise or low-quality market conditions.
Directional Pressure Evaluation
The first stage measures directional pressure across multiple four hour candles using a smoothed strength calculation. This step evaluates whether bullish or bearish participation is dominant over time rather than reacting to isolated price spikes.
When directional pressure is unclear or neutral, the script remains inactive.
Momentum Exhaustion and Rotation
Once directional pressure is established, the script monitors for loss of momentum. Exhaustion is identified when pressure fails to expand despite continued price movement.
This decay often appears near the later stages of a directional move and signals increased probability of rotation rather than continuation.
Price Acceptance and Confirmation
The final stage requires price to confirm the rotation through candle behavior. No intrabar logic is used.
• Buy confirmation requires either
– a bullish candle close following downside pressure exhaustion
– or a pinbar showing strong rejection of lower prices
• Sell confirmation requires either
– a bearish candle close following upside pressure exhaustion
– or a pinbar showing strong rejection of higher prices
A setup is only confirmed after the four hour candle has fully closed.
Stop and Target Reference Plotting
When a setup is confirmed, the script plots visual reference levels:
• A stop reference beyond the exhaustion zone where the setup would be invalidated
• A projected target reference calculated using a fixed 4R multiple relative to the stop distance
These levels are provided for structural planning and consistency. They do not represent predictions or guarantees.
Why the Four Hour Chart Is Required
The pressure and exhaustion calculations are tuned to higher-timeframe behavior. On lower timeframes, momentum cycles occur too rapidly and lead to frequent false rotations.
The four hour chart provides the balance required for meaningful pressure, decay, and acceptance to develop.
Session Considerations
The script is not intended for Asia session evaluation. Reduced liquidity during those hours can distort momentum behavior and reduce signal quality. Best evaluation occurs during or after London and New York participation.
Chart Presentation Guidelines
• Use the script on a clean chart
• Avoid stacking other oscillators or momentum tools
• If drawings are used, they should be limited to swing structure or key price levels
All visual elements should support understanding of the script output.
Important Notes
This script analyzes historical price behavior to identify structural swing conditions. It does not predict future price movement or ensure outcomes. Users should test the tool, understand its confirmation rules, and apply independent risk management.
GBPUSD

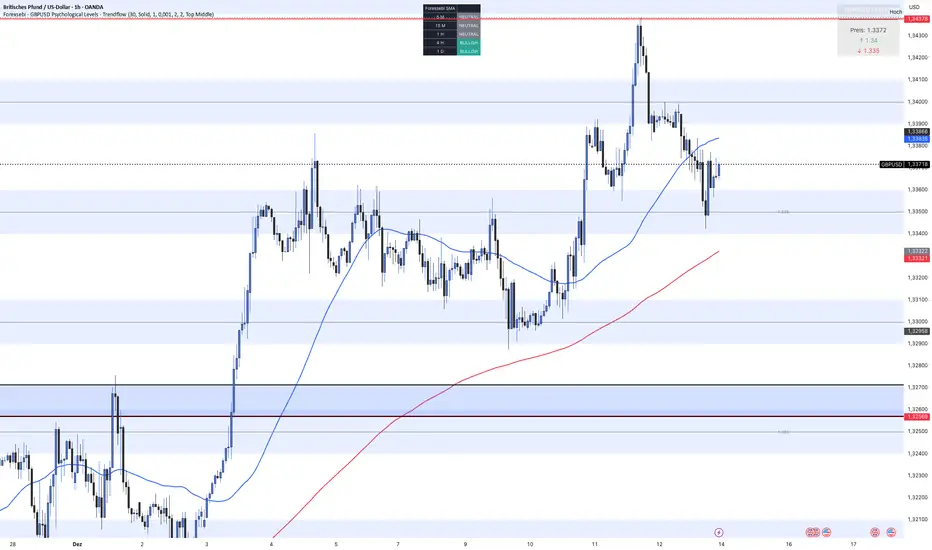
Forexsebi - GBPUSD Psychological Levels - TrendflowTrendflow is an advanced TradingView indicator combining psychological price levels with trend and multi-timeframe analysis.
The indicator automatically plots psychological levels in around the current price. Each level is visualized using horizontal lines and price zones (boxes) to clearly highlight potential support and resistance areas.
Psychological Levels – Trendflow ist ein fortschrittlicher TradingView-Indikator , der wichtige psychologische Preislevel mit einer klaren Trend- und Multi-Timeframe-Analyse kombiniert.
Trend Analysis with SMAs
SMA 50 & SMA 200 plotted directly on the chart
Individually toggleable
Clear color separation for fast trend recognition
Multi-Timeframe SMA Trend Table
Trend status (BULLISH / BEARISH / NEUTRAL) across:
5M, 15M, 1H, 4H, 1D
Logic: Price relative to SMA 50 & SMA 200
Color-coded, easy-to-read table
Info Box
Current Gold price
Nearest psychological level above and below price
Alert System
Alerts when price approaches a psychological level
User-defined alert distance
VWAP Flow ParmezanThe "Official Bank Flow VWAP" is a comprehensive trading suite designed for institutional Forex traders.
This indicator solves the problem of chart clutter by combining two critical components of liquidity: Price (Value) and Time (Sessions). It is specifically optimized for EUR/USD and GBP/USD on intraday timeframes (M5, M15), helping you identify high-probability setups where "Fair Value" meets "Volatility."
Key Features
1. Multi-Timeframe VWAP Hierarchy Unlike standard indicators, this tool visualizes the interaction between three distinct timeframes:
Daily VWAP (Dynamic Color): Your primary trend filter. Green when Bullish (Price > VWAP), Red when Bearish (Price < VWAP).
Weekly VWAP (Orange Dots): Represents the medium-term balance. Acts as a magnet for mean reversion mid-week.
Monthly VWAP (Purple Line): The institutional "line in the sand." Major support/resistance level.
2. Standard Deviation Bands (Market Balance) The indicator plots SD1 and SD2 bands around the Daily VWAP:
Inner Zone (SD1): Represents the "Fair Value" area.
Outer Bands (SD2): Represents overbought/oversold conditions. Useful for identifying mean reversion plays back to the center.
3. Official Exchange Sessions (Time) Forget confusing "killzones." This tool highlights the Official Open times for major exchanges, adjusted for Daylight Savings via New York time:
London Open (08:00 LDN): The start of European volume.
New York Open (08:00 NY): The injection of US liquidity.
London Close/Fix: The daily overlap close, often marking trend reversals.
Note: Sessions are visualized with non-intrusive black "shadow" backgrounds to keep your chart clean.
4. "Ghost" Levels (Previous VWAP) A unique feature that plots the closing VWAP level of the previous day. Institutional algorithms often target these "untested" levels as Take Profit targets or liquidity pools.
How to Use
Trend Following: If Price is above the Daily VWAP (Green) during the London Open, look for Long entries targeting the SD1/SD2 upper bands.
Mean Reversion: If Price hits the SD2 Band while far away from the Weekly VWAP, look for a reversal back to the mean.
Confluence: The strongest signals occur when price touches a key VWAP level (e.g., Weekly VWAP) specifically during the highlighted Session Start times.
Settings
Timezone: Defaults to America/New_York to automatically handle DST shifts for London/NY opens.
Visuals: Fully customizable colors and transparency. Default is set to a "Dark Mode" friendly professional palette.

DayFlow VWAP Relay Forex Majors StrategySummary in one paragraph
DayFlow VWAP Relay is a day-trading strategy for major FX pairs on intraday timeframes, demonstrated on EURUSD 15 minutes. It waits for alignment between a daily anchored VWAP regime check, residual percentiles, and lower-timeframe micro flow before suggesting trades. The originality is the fusion of daily VWAP residual percentiles with a live micro-flow score from 1 minute data to switch between fade and breakout behavior inside the same session. Add it to a clean chart and use the markers and alerts.
Scope and intent
• Markets: Major FX pairs such as EURUSD, GBPUSD, USDJPY, AUDUSD, USDCHF, USDCAD
• Timeframes: One minute to one hour
• Default demo in this publication: EURUSD on 15 minutes
• Purpose: Reduce false starts by acting only when context, location and micro flow agree
• Limits: This is a strategy. Orders are simulated on standard candles only
Originality and usefulness
• Core novelty: Residual percentiles to daily anchored VWAP decide “balanced versus expanding day”. A separate 1 minute micro-flow score confirms direction, so the same model fades extremes in balance and rides range breaks in expansion
• Failure modes addressed: Chop fakeouts and unconfirmed breakouts are filtered by the expansion gate and micro-flow threshold
• Testability: Every input is exposed. Bands, background regime color, and markers show why a suggestion appears
• Portable yardstick: Stops and targets are ATR multiples converted to ticks, which transfer across symbols
• Open source status: No reused third-party code that requires attribution
Method overview in plain language
The day is anchored with a VWAP that updates from the daily session start. Price minus VWAP is the residual. Percentiles of that residual measured over a rolling window define location extremes for the current day. A regime score compares residual volatility to price volatility. When expansion is low, the day is treated as balanced and the model fades residual extremes if 1 minute micro flow points back to VWAP. When expansion is high, the model trades breakouts outside the VWAP bands if slope and micro flow agree with the move.
Base measures
• Range basis: True Range smoothed by ATR for stops and targets, length 14
• Return basis: Not required for signals; residuals are absolute price distance to VWAP
Components
• Daily Anchor VWAP Bands. VWAP with standard-deviation bands. Slope sign is used for trend confirmation on breakouts
• Residual Percentiles. Rolling percentiles of close minus VWAP over Signal length. Identify location extremes inside the day
• Expansion Ratio. Standard deviation of residuals divided by standard deviation of price over Signal length. Classifies balanced versus expanding day
• Micro Flow. Net up minus down closes from 1 minute data across a short span, normalized to −1..+1. Confirms direction and avoids fades against pressure
• Session Window optional. Restricts trading to your configured hours to avoid thin periods
• Cooldown optional. Bars to wait after a position closes to prevent immediate re-entry
Fusion rule
Gating rather than weighting. First choose regime by Expansion Ratio versus the Expansion gate. Inside each regime all listed conditions must be true: location test plus micro-flow threshold plus session window plus cooldown. Breakouts also require VWAP slope alignment.
Signal rule
• Long suggestion on balanced day: residual at or below the lower percentile and micro flow positive above the gate while inside session and cooldown is satisfied
• Short suggestion on balanced day: residual at or above the upper percentile and micro flow negative below the gate while inside session and cooldown is satisfied
• Long suggestion on expanding day: close above the upper VWAP band, VWAP slope positive, micro flow positive, session and cooldown satisfied
• Short suggestion on expanding day: close below the lower VWAP band, VWAP slope negative, micro flow negative, session and cooldown satisfied
• Positions flip on opposite suggestions or exit by brackets
What you will see on the chart
• Markers on suggestion bars: L for long, S for short
• Exit occurs on reverse signal or when a bracket order is filled
• Reference lines: daily anchored VWAP with upper and lower bands
• Optional background: teal for balanced day, orange for expanding day
Inputs with guidance
Setup
• Signal length. Residual and regime window. Typical 40 to 100. Higher smooths, lower reacts faster
Micro Flow
• Micro TF. Lower timeframe used for micro flow, default 1 minute
• Micro span bars. Count of lower-TF bars. Typical 5 to 20
• Micro flow gate 0..1. Minimum absolute flow. Raising it demands stronger confirmation and reduces trade count
VWAP Bands
• VWAP stdev multiplier. Band width. Typical 0.8 to 1.6. Wider bands reduce breakout frequency and increase fade distance
• Expansion gate 0..3. Threshold to switch from fades to breakouts. Raising it favors fades, lowering it favors breakouts
Sessions
• Use session filter. Enable to trade only inside your window
• Trade window UTC. Default 07:00 to 17:00
Risk
• ATR length. Stop and target basis. Typical 10 to 21
• Stop ATR x. Initial stop distance in ATR multiples
• Target ATR x. Profit target distance in ATR multiples
• Cooldown bars after close. Wait bars before a new entry
• Side. Both, long only, or short only
View
• Show VWAP and bands
• Color bars by residual regime
Properties visible in this publication
• Initial capital 10000
• Base currency Default
• request.security uses lookahead off everywhere
• Strategy: Percent of equity with value 3. Pyramiding 0. Commission cash per order 0.0001 USD. Slippage 3 ticks. Process orders on close ON. Bar magnifier ON. Recalculate after order is filled OFF. Calc on every tick OFF. Using standard OHLC fills ON.
Realism and responsible publication
No performance claims. Past results never guarantee future outcomes. Fills and slippage vary by venue. Shapes can move while a bar forms and settle on close. Strategies must run on standard candles for signals and orders.
Honest limitations and failure modes
High impact news, session opens, and thin liquidity can invalidate assumptions. Very quiet days can reduce contrast between residuals and price volatility. Session windows use the chart exchange time. If both stop and target are touched within a single bar, TradingView’s standard OHLC price-movement model decides the outcome.
Expect different behavior on illiquid pairs or during holidays. The model is sensitive to session definitions and feed time. Past results never guarantee future outcomes.
Legal
Education and research only. Not investment advice. You are responsible for your decisions. Test on historical data and in simulation before any live use. Use realistic costs.

Daytrade Forex Scalper TwinPulse Auction Timer IndicatorWhat this indicator is
TwinPulse Auction Timer is a multi component execution aid designed for liquid markets. It looks for two families of opportunities
Breakouts that leave a compression area after a fresh sweep
Reversals that trigger after a sweep with strong wick polarity
It does not try to predict future prices. It measures present auction conditions with transparent rules and shows you when those conditions align. You get a simple table that says LONG SHORT or WAIT, optional session shading, clean entry and exit level visuals, and alerts you can wire to your workflow.
Why it is different
Most tools show a single signal. TwinPulse combines several independent signals into an Edge Score that you can tune. The components are
• Pulse. A signed measure of wick asymmetry with candle body direction
• Compression. Current true range compared with an average range
• Sweep timer. Bars elapsed since the most recent sweep of a prior high or low
• Bias. Direction of a higher timeframe candle
• Regime. Efficiency ratio and the relation of micro to macro volatility
• Location. Distance from the daily anchored VWAP
• Session. London and New York filter by time windows
Each component is visible in the inputs and in the table so you can understand why a suggestion appears. The script uses request.security() with lookahead off in all calls so it does not peek into the future. Shapes may move while a bar is open since price is still forming. They stop moving when the bar closes.
What you will see on the chart
• L and S shapes on entry bars
• An Exit shape at the price where a stop or the runner target would have been hit
• Four horizontal lines while a trade is active
Entry
Stop
TP1 at one R
TP2 at the runner target expressed in R
• Labels anchored to each line so you can instantly read Entry SL TP1 and TP2 with current values
• Optional shading during your session windows
• Optional daily VWAP line
The table in the top right shows
Action LONG SHORT IN LONG IN SHORT or WAIT
Session ON or OFF
Bias UP DOWN or FLAT
Pulse value
Compression value
Edge L percent and Edge S percent
How it works in detail
Pulse
For each bar the script measures up wick minus down wick divided by range and multiplies that by the sign of the candle body. The result is averaged with pulse_len. Positive numbers indicate aggressive buying. Negative numbers indicate aggressive selling. You control the minimum absolute value with pulse_thr.
Compression
Compression is the ratio of current range to an average range. You can choose the range basis. HL SMA uses simple high minus low smoothed by range_len. ATR uses classic True Range smoothed by atr_len. Values below comp_thr indicate a coil.
Sweeps and the timer
A sweep occurs when price trades beyond the highest high or lowest low seen in the previous sweep_len bars. A strict sweep requires a close back inside that prior range. The timer measures how many bars have elapsed since the last sweep. Breakout setups require the timer to exceed timer_thr.
Bias on a confirmation timeframe
A higher timeframe candle is read with confirm_tf. If close is above open bias is UP. If close is below open bias is DOWN. This keeps breakouts aligned with the prevailing drift.
Regime filters
Efficiency ratio measures the straight line change over the sum of absolute bar to bar changes over er_len. It rises in trendy conditions and falls in noise. Minimum efficiency is controlled by er_min.
Micro to macro volatility ratio compares a short lookback average range with a longer lookback average range using your chosen basis. For breakouts you usually want micro volatility to be near or above macro hence mvr_min. For reversals you often want micro volatility that is not overheated relative to macro hence mvr_max_rev.
VWAP distance gate
Daily anchored VWAP is rebuilt from the open of each session. The script computes the absolute distance from VWAP in units of your average range and requires that distance to exceed vwap_dist_thr when use_vwap_gate is true. This keeps entries away from the mean.
Edge Score
Each gate contributes a weight that you control. The script sums weights of the satisfied gates and divides by the sum of all weights to produce an Edge percent for long and an Edge percent for short. You can then require a minimum Edge percent using edge_min_pct. This turns the indicator into a step by step checklist that you can tune to your taste.
Using the indicator step by step
Choose markets and timeframes
The logic is designed for liquid instruments. Major currency pairs, index futures and cash index CFDs, and the most liquid crypto pairs work well. On intraday use one to fifteen minutes for signals and fifteen to sixty minutes for confirmation. On swing use one hour to one day for signals and one day for confirmation.
Decide on entry mode
Breakouts require a compression area and a sweep timer. Reversals require a strict sweep and a strong pulse. If you are unsure leave the default which allows both.
Pick a range basis
For FX and crypto HL SMA is often stable. For indices and single name equities with gaps ATR can adapt better. If results look too reactive increase the window. If results are too slow reduce it.
Tune regime filters
If you trade trend continuation raise er_min and mvr_min. If you trade counter rotation lower them and rely on the reversal path with the strict sweep condition.
Set the VWAP gate
Enabling it helps you avoid entries at the mean. Push the threshold higher on range bound days. Reduce it in strong trend days.
Table driven decision
Watch Action and the Edge percents. If the script says WAIT you can read Pulse and Compression to see what is missing. Often the best trades appear when both Edge percents are well separated and your session switch is ON.
Use the visuals
When a suggestion triggers you will see entry stop and targets. You can mirror the levels in your own workflow or use alerts.
Consider bar close
Signals are computed in real time. For a strict process you can wait until the bar closes to reduce noise.
Inputs explained with quick guidance
Setup
Signal TF chooses where the logic is computed. Leave blank to use the chart.
Confirm TF sets the higher timeframe for bias.
Session filter restricts signals to the London and New York windows you specify.
Invert flips long and short. It is useful on inverse instruments.
Logic options
Entry mode allows Breakouts Reversals or Both.
Average range basis selects HL SMA or ATR.
ATR length is used when ATR is selected.
Pulse source can be Regular OHLC or Heikin Ashi. Heikin Ashi smooths noisy series, but the script still runs on regular bars and you should publish and use it on standard candles to respect the platform guidance.
Core numeric settings
Sweep lookback controls the size of the liquidity pool targeted by the sweep condition.
Pulse window smooths the wick polarity measure.
Average range window controls your base range when you use HL SMA.
Pulse threshold sets the minimum polarity required.
Compression threshold sets the maximum current range relative to average to consider the market coiled.
Expansion timer bars sets how much time has passed since the last sweep before you allow a breakout.
Regime filters
Efficiency ratio length and minimum value keep you out of aimless drift.
Micro and Macro range lengths feed the micro to macro ratio.
Minimum micro to macro for breakouts and maximum micro to macro for reversals steer the two entry families.
VWAP gate and distance threshold keep you away from the mean.
Levels and trade management visuals
Runner target in R sets TP2 as a multiple of initial risk.
Stop distance as average range multiple sets initial risk size for the visuals.
Move stop to entry after one R touch turns on break even logic once price has traveled one risk unit.
Trail buffer as R fraction uses the last sweep as an anchor and keeps a dynamic stop at a chosen fraction of R beyond it.
Cooldown after exit prevents immediate re entries.
Edge Score
Weights for pulse compression timer bias efficiency ratio micro to macro VWAP gate and session let you align the checklist with your style.
Minimum Edge percent to suggest applies a final filter to LONG or SHORT suggestions.
UI
Table and markers switch the compact dashboard and the shapes.
TP and SL lines and labels draw and name each level.
TP1 partial label percent is printed in the TP1 label for clarity.
Session shading helps with focus.
Daily VWAP line is optional.
Alerts
The script provides alerts for Long Short Exit and for Edge percent crossing the threshold on either side. Use them to drive notifications or to sync with webhooks and your broker integration. Alerts trigger in real time and will repaint during a bar. For conservative use trigger on bar close.
Recommended presets
Intraday trend continuation
Confirm TF fifteen minutes
Entry mode Breakouts
Range basis HL SMA
Pulse threshold near 0.10
Compression threshold near 0.60
Timer around 18
Minimum efficiency ratio near 0.20
Minimum micro to macro near 1.00
VWAP gate enabled with distance near 0.35
Edge minimum 50 or higher
Intraday mean reversion at sweeps
Entry mode Reversals
Pulse source Regular OHLC
Compression threshold can be a little higher
Maximum micro to macro near 1.60
Efficiency ratio minimum lower near 0.12
VWAP gate enabled
Edge minimum 40 to 60
Swing trend continuation
Signal TF one hour
Confirm TF one day
Range basis ATR
ATR length around 14
Average range window 20 to 30
Efficiency ratio minimum near 0.18
Micro to macro windows 12 and 60
Edge minimum 50 to 70
These are starting points only. Your instrument and timeframe will require small adjustments.
Limitations and honest warnings
No indicator is perfect. TwinPulse will mark attractive conditions that do not always lead to profitable trades. During economic releases or very thin liquidity the assumptions behind compression and sweeps may fail. In strong gap environments the HL SMA basis may lag while ATR may overreact. Heikin Ashi pulse can help in choppy markets but it will lag during sharp reversals. Session times use the exchange time of your chart. If you switch symbol or exchange verify the windows.
Edge percent is not a probability of profit. It is the fraction of satisfied gates with your chosen weights. Two traders can set different weights and see different Edge readings on the same bar. That is the design. The score is a guide that helps you act with discipline.
This indicator does not place orders or manage real risk. The lines and labels show a model entry a model stop and two model targets built from the average range at entry and from recent swing points. Use them as references and not as hard rules. Always test on historical data and demo first. Past results do not guarantee anything in the future.
Credits and originality
All code in this publication is original and written for this indicator. The concept of the efficiency ratio originates from Perry Kaufman. The use of a daily anchored volume weighted average price is a standard industry tool. The specific combination of pulse from wick polarity strict sweep timing compression and the tunable Edge Score is unique to this script at the time of publication. If you reuse parts of the open source code in your own work remember to credit the author and contribute meaningful improvements.
How to read the table at a glance
Action reflects your current state.
IN LONG or IN SHORT appears while a trade is active.
LONG or SHORT appears when conditions for entry are met and the Edge threshold is satisfied.
WAIT appears when at least one gate is missing.
Session shows ON during your chosen windows.
Bias shows the color of the confirmation candle.
Pulse is the smoothed polarity number.
Comp shows current range divided by the average range. Values below one mean compression.
Edge L percent and Edge S percent show the long and short checklists as percents.
Final thoughts
Markets move because orders accumulate at certain prices and at certain times. The indicator tries to measure two things that often matter at those turning points. One is the existence of a hidden imbalance revealed by wick polarity and by sweeps of prior extremes. The other is the presence of energy stored in a coil that can release in the direction of a drift. Neither force guarantees profit. Together they can improve your selection and your timing.
Use the defaults for a few days so you learn the personality of the signals. After that adjust one group at a time. Start with the session filter and the Edge threshold. Then tune compression and the timer. Finally adjust the regime filters. Keep notes. You will learn which weights matter for your market and timeframe. The result is a process you can apply with consistency.
Disclaimer
This script and description are for education and analysis. They are not investment advice and they do not promise future results. Use at your own risk. Test thoroughly on historical data and in simulation before considering any live use.

MACD Forecast [Titans_Invest]MACD Forecast — The Future of MACD in Trading
The MACD has always been one of the most powerful tools in technical analysis.
But what if you could see where it’s going, instead of just reacting to what has already happened?
Introducing MACD Forecast — the natural evolution of the MACD Full , now taken to the next level. It’s the world’s first MACD designed not only to analyze the present but also to predict the future behavior of momentum.
By combining the classic MACD structure with projections powered by Linear Regression, this indicator gives traders an anticipatory, predictive view, redefining what’s possible in technical analysis.
Forget lagging indicators.
This is the smartest, most advanced, and most accurate MACD ever created.
🍟 WHY MACD FORECAST IS REVOLUTIONARY
Unlike the traditional MACD, which only reflects current and past price dynamics, the MACD Forecast uses regression-based projection models to anticipate where the MACD line, signal line, and histogram are heading.
This means traders can:
• See MACD crossovers before they happen.
• Spot trend reversals earlier than most.
• Gain an unprecedented timing advantage in both discretionary and automated trading.
In other words: this indicator lets you trade ahead of time.
🔮 FORECAST ENGINE — POWERED BY LINEAR REGRESSION
At its core, the MACD Forecast integrates Linear Regression (ta.linreg) to project the MACD’s future behavior with exceptional accuracy.
Projection Modes:
• Flat Projection: Assumes trend continuity at the current level.
• LinReg Projection: Applies linear regression across N periods to mathematically forecast momentum shifts.
This dual system offers both a conservative and adaptive view of market direction.
📐 ACCURACY WITH FULL CUSTOMIZATION
Just like the MACD Full, this new version comes with 20 customizable buy-entry conditions and 20 sell-entry conditions — now enhanced with forecast-based rules that anticipate crossovers and trend reversals.
You’re not just reacting — you’re strategizing ahead of time.
⯁ HOW TO USE MACD FORECAST❓
The MACD Forecast is built on the same foundation as the classic MACD, but with predictive capabilities.
Step 1 — Spot Predicted Crossovers:
Watch for forecasted bullish or bearish crossovers. These signals anticipate when the MACD line will cross the signal line in the future, letting you prepare trades before the move.
Step 2 — Confirm with Histogram Projection:
Use the projected histogram to validate momentum direction. A rising histogram signals strengthening bullish momentum, while a falling projection points to weakening or bearish conditions.
Step 3 — Combine with Multi-Timeframe Analysis:
Use forecasts across multiple timeframes to confirm signal strength (e.g., a 1h forecast aligned with a 4h forecast).
Step 4 — Set Entry Conditions & Automation:
Customize your buy/sell rules with the 20 forecast-based conditions and enable automation for bots or alerts.
Step 5 — Trade Ahead of the Market:
By preparing for future momentum shifts instead of reacting to the past, you’ll always stay one step ahead of lagging traders.
🤖 BUILT FOR AUTOMATION AND BOTS 🤖
Whether for manual trading, quantitative strategies, or advanced algorithms, the MACD Forecast was designed to integrate seamlessly with automated systems.
With predictive logic at its core, your strategies can finally react to what’s coming, not just what already happened.
🥇 WHY THIS INDICATOR IS UNIQUE 🥇
• World’s first MACD with Linear Regression Forecasting
• Predictive Crossovers (before they appear on the chart)
• Maximum flexibility with Long & Short combinations — 20+ fully configurable conditions for tailor-made strategies
• Fully automatable for quantitative systems and advanced bots
This isn’t just an update.
It’s the final evolution of the MACD.
______________________________________________________
🔹 CONDITIONS TO BUY 📈
______________________________________________________
• Signal Validity: The signal will remain valid for X bars .
• Signal Sequence: Configurable as AND or OR .
🔹 MACD > Signal Smoothing
🔹 MACD < Signal Smoothing
🔹 Histogram > 0
🔹 Histogram < 0
🔹 Histogram Positive
🔹 Histogram Negative
🔹 MACD > 0
🔹 MACD < 0
🔹 Signal > 0
🔹 Signal < 0
🔹 MACD > Histogram
🔹 MACD < Histogram
🔹 Signal > Histogram
🔹 Signal < Histogram
🔹 MACD (Crossover) Signal
🔹 MACD (Crossunder) Signal
🔹 MACD (Crossover) 0
🔹 MACD (Crossunder) 0
🔹 Signal (Crossover) 0
🔹 Signal (Crossunder) 0
🔮 MACD (Crossover) Signal Forecast
🔮 MACD (Crossunder) Signal Forecast
______________________________________________________
______________________________________________________
🔸 CONDITIONS TO SELL 📉
______________________________________________________
• Signal Validity: The signal will remain valid for X bars .
• Signal Sequence: Configurable as AND or OR .
🔸 MACD > Signal Smoothing
🔸 MACD < Signal Smoothing
🔸 Histogram > 0
🔸 Histogram < 0
🔸 Histogram Positive
🔸 Histogram Negative
🔸 MACD > 0
🔸 MACD < 0
🔸 Signal > 0
🔸 Signal < 0
🔸 MACD > Histogram
🔸 MACD < Histogram
🔸 Signal > Histogram
🔸 Signal < Histogram
🔸 MACD (Crossover) Signal
🔸 MACD (Crossunder) Signal
🔸 MACD (Crossover) 0
🔸 MACD (Crossunder) 0
🔸 Signal (Crossover) 0
🔸 Signal (Crossunder) 0
🔮 MACD (Crossover) Signal Forecast
🔮 MACD (Crossunder) Signal Forecast
______________________________________________________
______________________________________________________
🔮 Linear Regression Function 🔮
______________________________________________________
• Our indicator includes MACD forecasts powered by linear regression.
Forecast Types:
• Flat: Assumes prices will stay the same.
• Linreg: Makes a 'Linear Regression' forecast for n periods.
Technical Information:
• Function: ta.linreg()
Parameters:
• source: Source price series.
• length: Number of bars (period).
• offset : Offset.
• return: Linear regression curve.
______________________________________________________
______________________________________________________
⯁ UNIQUE FEATURES
______________________________________________________
Linear Regression: (Forecast)
Signal Validity: The signal will remain valid for X bars
Signal Sequence: Configurable as AND/OR
Table of Conditions: BUY/SELL
Conditions Label: BUY/SELL
Plot Labels in the graph above: BUY/SELL
Automate & Monitor Signals/Alerts: BUY/SELL
Linear Regression (Forecast)
Signal Validity: The signal will remain valid for X bars
Signal Sequence: Configurable as AND/OR
Table of Conditions: BUY/SELL
Conditions Label: BUY/SELL
Plot Labels in the graph above: BUY/SELL
Automate & Monitor Signals/Alerts: BUY/SELL
______________________________________________________
📜 SCRIPT : MACD Forecast
🎴 Art by : @Titans_Invest & @DiFlip
👨💻 Dev by : @Titans_Invest & @DiFlip
🎑 Titans Invest — The Wizards Without Gloves 🧤
✨ Enjoy!
______________________________________________________
o Mission 🗺
• Inspire Traders to manifest Magic in the Market.
o Vision 𐓏
• To elevate collective Energy 𐓷𐓏
🎗️ In memory of João Guilherme — your light will live on forever.

Perfect Order Swing Signals✅ Pullback = Setup
✅ Perfect order = Filter
✅ Candle closing back through 20 EMA = Trigger
- Add other confirmations to your analysis before you enter a trade, dont go based just off the long & short signals.
- Now go make some bread $$

VOLUME Simple [Titans_Invest]VOLUME Simple
A streamlined volume analysis tool crafted for simplicity and smart signal detection.
Although simple in appearance, this indicator brings intelligent volume-based entries through configurable logic. Its design emphasizes clean and effective interpretation of volume signals.
⯁ WHAT IS THE VOLUME INDICATOR❓
The Volume indicator is a fundamental technical analysis tool that measures the number of shares or contracts traded in a security or market during a given period. It helps traders and investors understand the strength or weakness of a price movement, confirm trends, and predict potential reversals. Volume is typically displayed as a histogram below a price chart, with each bar representing the volume traded during a specific time interval.
⯁ HOW TO USE THE VOLUME❓
The Volume indicator can be used in several ways to enhance trading decisions:
• Trend Confirmation: High volume during a price move confirms the strength of that trend, while low volume can indicate a weak or unsustainable trend.
• Breakouts: A price breakout from a pattern or range accompanied by high volume is more likely to be valid and sustainable.
• Divergence: When the price moves in one direction and volume moves in the opposite direction, it can signal a potential reversal.
• Overbought/Oversold Conditions: Extreme volume levels can sometimes indicate that an asset is overbought or oversold, though this is less straightforward than with oscillators like the RSI.
⯁ ENTRY CONDITIONS
The conditions below are fully flexible and allow for complete customization of the signal.
______________________________________________________
🔹 CONDITIONS TO BUY 📈
______________________________________________________
▪︎ Signal Validity: The signal will remain valid for X bars .
🔹 volume > volume_MA * Trigger Signal (close > open)
🔹 volume > volume_MA * Trigger Signal (Keep State)
______________________________________________________
______________________________________________________
🔸 CONDITIONS TO SELL 📉
______________________________________________________
▪︎ Signal Validity: The signal will remain valid for X bars .
🔸 volume > volume_MA * Trigger Signal (close > open)
🔸 volume > volume_MA * Trigger Signal (Keep State)
______________________________________________________
______________________________________________________
🤖 AUTOMATION 🤖
• You can automate the BUY and SELL signals of this indicator.
______________________________________________________
______________________________________________________
⯁ UNIQUE FEATURES
______________________________________________________
Signal Validity: The signal will remain valid for X bars
Condition Table: BUY/SELL
Condition Labels: BUY/SELL
Plot Labels in the Graph Above: BUY/SELL
Automate and Monitor Signals/Alerts: BUY/SELL
Signal Validity: The signal will remain valid for X bars
Table of Conditions: BUY/SELL
Conditions Label: BUY/SELL
Plot Labels in the graph above: BUY/SELL
Automate & Monitor Signals/Alerts: BUY/SELL
______________________________________________________
📜 SCRIPT : VOLUME Simple
🎴 Art by : @Titans_Invest & @DiFlip
👨💻 Dev by : @Titans_Invest & @DiFlip
🎑 Titans Invest — The Wizards Without Gloves 🧤
✨ Enjoy!
______________________________________________________
o Mission 🗺
• Inspire Traders to manifest Magic in the Market.
o Vision 𐓏
• To elevate collective Energy 𐓷𐓏

Ralph Indicator - ZaraTrust Smart MoneyThe Ralph Indicator – ZaraTrust Smart Money is a powerful yet simple Smart Money Concepts (SMC) based tool designed for traders who want to trade like institutions. It auto-detects high-probability Buy/Sell zones, Support/Resistance levels, and Demand/Supply areas on the chart — giving you clear, visual, and actionable signals without the clutter.
⸻
🔍 Key Features:
✅ Smart Money Structure
• Uses pivot-based logic to identify potential structure points
• Helps you understand market flow (e.g., BOS, CHoCH simplified logic)
✅ Automatic Support & Resistance
• Plots major levels based on significant highs and lows
• Helps catch key reversal or breakout zones
✅ Demand & Supply Zones
• Visually shows areas where price may react strongly
• Based on smart pivot detection from recent swings
✅ Buy/Sell Trade Signals
• Highlights buy when price breaks resistance (possible bullish shift)
• Highlights sell when price breaks support (possible bearish shift)
✅ Clean & Easy UI
• Toggle features on/off from settings panel
• Labels and shapes are plotted clearly on the chart for instant reading
⸻
🛠️ Recommended Use:
• Use on 15min to 4H timeframe for intraday or swing trading
• Combine with price action (e.g., confirmation candles, liquidity grab)
• Works best when paired with institutional logic (OBs, FVG, liquidity)
⸻
⚠️ Disclaimer:
This indicator is a tool, not a signal service.
It does not guarantee 98% accuracy, but it’s designed to highlight smart money zones and high-probability areas. Always do your own risk management and backtest before using on a live account.

MACD Full [Titans_Invest]MACD Full — A Smarter, More Flexible MACD.
Looking for a MACD with real customization power?
We present one of the most complete public MACD indicators available on TradingView.
It maintains the classic MACD structure but is enhanced with 20 fully customizable long entry conditions and 20 short entry conditions , giving you precise control over your strategy.
Plus, it’s fully automation-ready, making it ideal for quantitative systems and algorithmic trading.
Whether you're a discretionary trader or a bot developer, this tool is built to seamlessly adapt to your style.
⯁ WHAT IS THE MACD❓
The Moving Average Convergence Divergence (MACD) is a technical analysis indicator developed by Gerald Appel. It measures the relationship between two moving averages of a security’s price to identify changes in momentum, direction, and strength of a trend. The MACD is composed of three components: the MACD line, the signal line, and the histogram.
⯁ HOW TO USE THE MACD❓
The MACD is calculated by subtracting the 26-period Exponential Moving Average (EMA) from the 12-period EMA. A 9-period EMA of the MACD line, called the signal line, is then plotted on top of the MACD line. The MACD histogram represents the difference between the MACD line and the signal line.
Here are the primary signals generated by the MACD:
Bullish Crossover: When the MACD line crosses above the signal line, indicating a potential buy signal.
Bearish Crossover: When the MACD line crosses below the signal line, indicating a potential sell signal.
Divergence: When the price of the security diverges from the MACD, suggesting a potential reversal.
Overbought/Oversold Conditions: Indicated by the MACD line moving far away from the signal line, though this is less common than in oscillators like the RSI.
⯁ ENTRY CONDITIONS
The conditions below are fully flexible and allow for complete customization of the signal.
______________________________________________________
🔹 CONDITIONS TO BUY 📈
______________________________________________________
• Signal Validity: The signal will remain valid for X bars .
• Signal Sequence: Configurable as AND or OR .
🔹 MACD > Signal Smoothing
🔹 MACD < Signal Smoothing
🔹 Histogram > 0
🔹 Histogram < 0
🔹 Histogram Positive
🔹 Histogram Negative
🔹 MACD > 0
🔹 MACD < 0
🔹 Signal > 0
🔹 Signal < 0
🔹 MACD > Histogram
🔹 MACD < Histogram
🔹 Signal > Histogram
🔹 Signal < Histogram
🔹 MACD (Crossover) Signal
🔹 MACD (Crossunder) Signal
🔹 MACD (Crossover) 0
🔹 MACD (Crossunder) 0
🔹 Signal (Crossover) 0
🔹 Signal (Crossunder) 0
______________________________________________________
______________________________________________________
🔸 CONDITIONS TO SELL 📉
______________________________________________________
• Signal Validity: The signal will remain valid for X bars .
• Signal Sequence: Configurable as AND or OR .
🔸 MACD > Signal Smoothing
🔸 MACD < Signal Smoothing
🔸 Histogram > 0
🔸 Histogram < 0
🔸 Histogram Positive
🔸 Histogram Negative
🔸 MACD > 0
🔸 MACD < 0
🔸 Signal > 0
🔸 Signal < 0
🔸 MACD > Histogram
🔸 MACD < Histogram
🔸 Signal > Histogram
🔸 Signal < Histogram
🔸 MACD (Crossover) Signal
🔸 MACD (Crossunder) Signal
🔸 MACD (Crossover) 0
🔸 MACD (Crossunder) 0
🔸 Signal (Crossover) 0
🔸 Signal (Crossunder) 0
______________________________________________________
______________________________________________________
🤖 AUTOMATION 🤖
• You can automate the BUY and SELL signals of this indicator.
______________________________________________________
______________________________________________________
⯁ UNIQUE FEATURES
______________________________________________________
Signal Validity: The signal will remain valid for X bars
Signal Sequence: Configurable as AND/OR
Condition Table: BUY/SELL
Condition Labels: BUY/SELL
Plot Labels in the Graph Above: BUY/SELL
Automate and Monitor Signals/Alerts: BUY/SELL
Signal Validity: The signal will remain valid for X bars
Signal Sequence: Configurable as AND/OR
Table of Conditions: BUY/SELL
Conditions Label: BUY/SELL
Plot Labels in the graph above: BUY/SELL
Automate & Monitor Signals/Alerts: BUY/SELL
______________________________________________________
📜 SCRIPT : MACD Full
🎴 Art by : @Titans_Invest & @DiFlip
👨💻 Dev by : @Titans_Invest & @DiFlip
🎑 Titans Invest — The Wizards Without Gloves 🧤
✨ Enjoy!
______________________________________________________
o Mission 🗺
• Inspire Traders to manifest Magic in the Market.
o Vision 𐓏
• To elevate collective Energy 𐓷𐓏

ADX Full [Titans_Invest]ADX Full
This is, without a doubt, the most complete ADX indicator available on TradingView — and quite possibly the most advanced in the world. We took the classic ADX structure and fully optimized it, preserving its essence while elevating its functionality to a whole new level. Every aspect has been enhanced — from internal logic to full visual customization. Now you can see exactly what’s happening inside the indicator in real time, with tags, flags, and informative levels. This indicator includes over 22 long entry conditions and 22 short entry conditions , covering absolutely every possibility the ADX can offer. Everything is transparent, adjustable, and ready to fit seamlessly into any professional trading strategy. This isn’t just another ADX — it’s the definitive ADX, built for traders who take the market seriously.
⯁ WHAT IS THE ADX❓
The Average Directional Index (ADX) is a technical analysis indicator developed by J. Welles Wilder. It measures the strength of a trend in a market, regardless of whether the trend is up or down.
The ADX is an integral part of the Directional Movement System, which also includes the Plus Directional Indicator (+DI) and the Minus Directional Indicator (-DI). By combining these components, the ADX provides a comprehensive view of market trend strength.
⯁ HOW TO USE THE ADX❓
The ADX is calculated based on the moving average of the price range expansion over a specified period (usually 14 periods). It is plotted on a scale from 0 to 100 and has three main zones:
Strong Trend: When the ADX is above 25, indicating a strong trend.
Weak Trend: When the ADX is below 20, indicating a weak or non-existent trend.
Neutral Zone: Between 20 and 25, where the trend strength is unclear.
⯁ ENTRY CONDITIONS
The conditions below are fully flexible and allow for complete customization of the signal.
______________________________________________________
🔹 CONDITIONS TO BUY 📈
______________________________________________________
• Signal Validity: The signal will remain valid for X bars .
• Signal Sequence: Configurable as AND or OR .
🔹 +DI > -DI
🔹 +DI < -DI
🔹 +DI > ADX
🔹 +DI < ADX
🔹 -DI > ADX
🔹 -DI < ADX
🔹 ADX > Threshold
🔹 ADX < Threshold
🔹 +DI > Threshold
🔹 +DI < Threshold
🔹 -DI > Threshold
🔹 -DI < Threshold
🔹 +DI (Crossover) -DI
🔹 +DI (Crossunder) -DI
🔹 +DI (Crossover) ADX
🔹 +DI (Crossunder) ADX
🔹 +DI (Crossover) Threshold
🔹 +DI (Crossunder) Threshold
🔹 -DI (Crossover) ADX
🔹 -DI (Crossunder) ADX
🔹 -DI (Crossover) Threshold
🔹 -DI (Crossunder) Threshold
______________________________________________________
______________________________________________________
🔸 CONDITIONS TO SELL 📉
______________________________________________________
• Signal Validity: The signal will remain valid for X bars .
• Signal Sequence: Configurable as AND or OR .
🔸 +DI > -DI
🔸 +DI < -DI
🔸 +DI > ADX
🔸 +DI < ADX
🔸 -DI > ADX
🔸 -DI < ADX
🔸 ADX > Threshold
🔸 ADX < Threshold
🔸 +DI > Threshold
🔸 +DI < Threshold
🔸 -DI > Threshold
🔸 -DI < Threshold
🔸 +DI (Crossover) -DI
🔸 +DI (Crossunder) -DI
🔸 +DI (Crossover) ADX
🔸 +DI (Crossunder) ADX
🔸 +DI (Crossover) Threshold
🔸 +DI (Crossunder) Threshold
🔸 -DI (Crossover) ADX
🔸 -DI (Crossunder) ADX
🔸 -DI (Crossover) Threshold
🔸 -DI (Crossunder) Threshold
______________________________________________________
______________________________________________________
🤖 AUTOMATION 🤖
• You can automate the BUY and SELL signals of this indicator.
______________________________________________________
______________________________________________________
⯁ UNIQUE FEATURES
______________________________________________________
Signal Validity: The signal will remain valid for X bars
Signal Sequence: Configurable as AND/OR
Condition Table: BUY/SELL
Condition Labels: BUY/SELL
Plot Labels in the Graph Above: BUY/SELL
Automate and Monitor Signals/Alerts: BUY/SELL
Signal Validity: The signal will remain valid for X bars
Signal Sequence: Configurable as AND/OR
Table of Conditions: BUY/SELL
Conditions Label: BUY/SELL
Plot Labels in the graph above: BUY/SELL
Automate & Monitor Signals/Alerts: BUY/SELL
______________________________________________________
📜 SCRIPT : ADX Full
🎴 Art by : @Titans_Invest & @DiFlip
👨💻 Dev by : @Titans_Invest & @DiFlip
🎑 Titans Invest — The Wizards Without Gloves 🧤
✨ Enjoy!
______________________________________________________
o Mission 🗺
• Inspire Traders to manifest Magic in the Market.
o Vision 𐓏
• To elevate collective Energy 𐓷𐓏

nNouSignnNouSign
☆
Welcome to a path to trading success in the world of trading, where fortunes are made and dreams come true.
But amidst the excitement and possibilities, there lies the challenge of deciphering the market's complexities.
Fear not, for we present to you the ultimate weapon in your trading arsenal: the nNouSign indicator.
Prepare to embark on a thrilling journey of trading mastery as we guide you through its optimal usage, enlightening you with its potential and empowering you with the ability to navigate the markets with confidence.
Embracing the nNouSign magic as you apply the nNouSign indicator to your TradingView chart, envision a realm where the convergence of art and science births incredible trading opportunities.
• The indicator's smooth moving average line, represented by a vibrant orange hue, acts as your guiding light. It captures the essence of market sentiment and unveils the hidden patterns that govern price movements.
Decoding the colors of success, possess a mystical power to evoke emotions and ignite motivation . The nNouSign indicator harnesses this power, allowing you to personalize your trading experience.
• Choose the color of prosperity for your buy signals, perhaps a vivid shade of green. Let it symbolize the life-giving force of profits flowing into your trading account.
• As for sell signals, embrace the passionate intensity of red, signifying your ability to seize opportunities and protect your gains.
Riding the trend waves is one of the nNouSign indicator's core strengths. It lies in its ability to identify trends.
Whether the market surges upwards like a fearless tide or recedes like a wise old ocean, the indicator whispers the secrets of trend direction.
• When the moving average is conquered by the closing price, rejoice, for it signals a bullish trend.
• Conversely, when the closing price descends beneath the moving average, it reveals a bearish trend.
Harmonizing with the trading signals which are the magical spells that teleport you to the forefront of profitable trades.
Watch as the nNouSign indicator casts its spells in the form of tiny triangles on your chart.
• When a bullish trend is confirmed, a mystical triangle points upwards, signaling a buy opportunity.
• On the contrary, when a bearish trend emerges, a bewitching triangle points downwards, beckoning you to sell.
Embrace these signals and let them guide your path to success.
Unleashing the power of alerts like the modern trader(s) whom thrives on speed and efficiency.
The nNouSign indicator empowers you with its alert system , ensuring you never miss a precious trading moment.
• Customize your alerts to receive notifications when the bullish or bearish trends are confirmed.
Imagine the thrill of being the first to seize an opportunity, swiftly executing trades with confidence, and reaping the rewards.
Dance with the trendline as you journey through the market's ebb and flow, through the nNouSign indicator its visual masterpiece.
Behold the trendline , gracefully drawn on your chart.
• In the presence of a bullish trend, it steps aside, allowing the moving average to shine brightly.
• Yet, in the depths of a bearish trend, it emerges, painted in shades of red, serving as a reminder to exercise caution.
Let this visual spectacle guide your decision-making process.
☆
Intrepid trader! ,may you now have unlocked the secrets of the nNouSign indicator and embark on a journey that will forever transform your trading experience.
Armed with its wisdom and most importantly YOUR OWN WISDOM, may you possess the ability to navigate the markets with confidence and precision.
Embrace its vibrant colors, heed its trading signals and dance with the trendline as you ride the waves of market trends. Let the indicator be your constant companion, guiding you through the ever-changing tides of the financial world.
Remember, trading is not just a science; it is an art. The nNouSign indicator provides you with the tools to create your masterpiece.
Embrace its colors, for they evoke the emotions and motivation necessary for success.
Let the green of buy signals ignite your passion for profit, and the red of sell signals fuel your determination to protect your gains.
But trading is more than just following signals; it requires discipline and adaptability.
Observe the trendlines and understand the market's rhythm.
Be patient when the trend favors the bulls, and exercise cautio n when the bears take control.
The nNouSign indicator, with its magical trendline, will be your compass in navigating these changing conditions.
In the fast-paced world of trading, timing is everything. The alerts generated by the nNouSign indicator will keep you informed, ensuring you never miss an opportunity.
Stay alert, for swift and decisive action can be the key to reaping substantial rewards.
☆
Finally, remember that trading is a journey of growth and learning.
Embrace the educational aspect of using the
nNouSign indicator.
Analyze your trades, study the outcomes, and fine-tune your strategies.
With each trade , you'll gain valuable insights and develop the skills necessary for long-term success .
☆
So, fellow trader, take this guide as your roadmap to trading mastery.
Let the nNouSign indicator be your guide, entertaining you with its vibrant colors, motivating you with its signals, and educating you through each trading experience.
Embrace the power it bestows upon you, and let it unleash your full potential in the exciting world of trading.
Success awaits those who dare to seize it!
-HappyTrading- J

Divergence Indicator Screener [Trading Solutions]It's been a while since the last publication on the platform. We've been studying the charts and developing some interesting strategies and indicators, so we'll be posting some ideas in the near future.
Overview
This indicator allows you to find divergences between the price action and the classic RSI. It has the ability to anticipate trend changes.
Highs and Lows are determined using Pivot Points, wich can be adjusted in settings.
You can use this indicator to find two kind of divergences, Regular and Hidden:
Regular is when price makes a higher high, but the RSI makes a lower high
Hidden is when price makes a lower high, but the RSI makes a higher high
The opposite case for Bearish Divergence
The most important functionality of this indicator is that we can be alerted when a divergence occurs in different trading pairs, without the necessity of checking different charts at the same time, and seize opportunities offered by the market. You only have to go to Alerts Tab , click on Create Alert , select Divergence Indicator Screener and wait for the Notification in your favorite device.
You can choose any ticker to be plotted on chart and even add a new one.
Settings
To get everything started with this indicator, here are the different inputs:
RSI Settings: Period y Source
Pivot Point: Left and Right lookback bars
Filter Divergences: Regular and Hidden and max and min distance from the pivot points to consider a valid divergence
Draw table and Filter how much bars to look for a divergence in the past and plot it in the table: The fewer bars, less divergences shown
We hope you can take the most of this tool, and helps improve your day to day trading. Feel free to comment and make suggestions. We will be updating soon

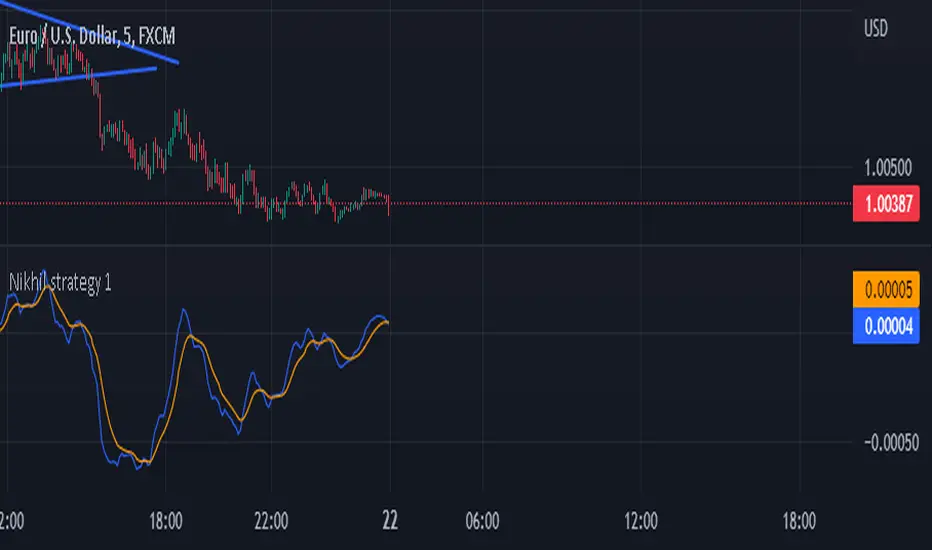
Nikhil strategy 1how to make a best strategy in live market are the analysis very fundamental strong and technical
Currency Strength Index by zdmreCurrency strength expresses the value of currency. For economists, it is often calculated as purchasing power, while for financial traders, it can be described as an indicator, reflecting many factors related to the currency; for example, fundamental data, overall economic performance (stability) or interest rates.
The method used in this indicator is its strength against the US Dollar (xxxUSD)
Currencies:
EUR
GBP
AUD
NZD
JPY
CNY
CAD
Your Symbol (Optionally) defval: TRYUSD
You can also optionally add a symbol. However, this unit must be in the form of xxxUSD

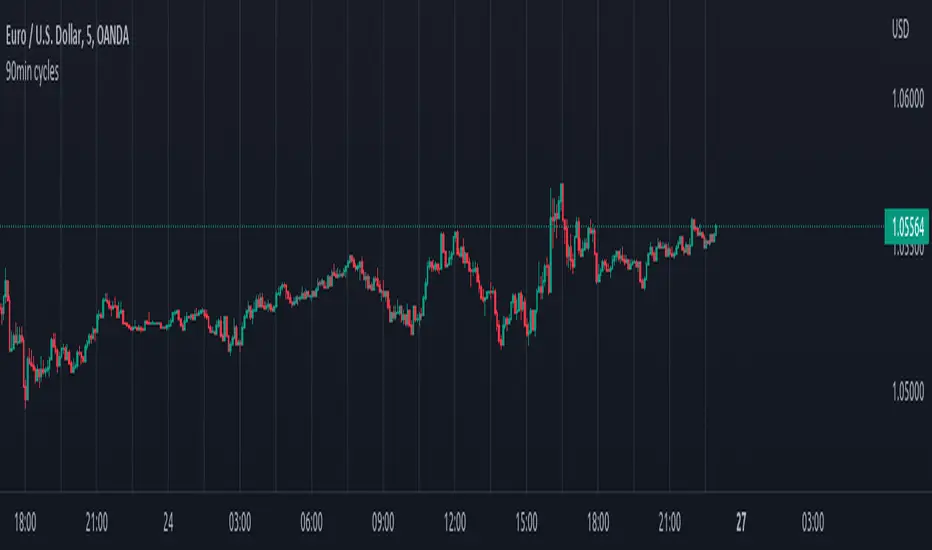
90min cyclesI did this little script to help me with the cycle I hope it will help some of you too !
For default, I have made 90 min cycle, but you can change it easily on the settings if you prefer an other time interval because it is really subjectif.
By default the cycle will begin at midnight from YOUR local time, but this can be a little annoying when you want for example to make it begin at midnght from NY or London without changing the UTC of your chart (if you still want to have your hour displayed normally).
I couldn't find an indicator to help me do that so I added a little setting which allow you to move the start hour of your cycle (so you will have to do some math to move it accordingly to what you want but that's okay ;) ).
That way you can choose the interval you like AND when it begin !
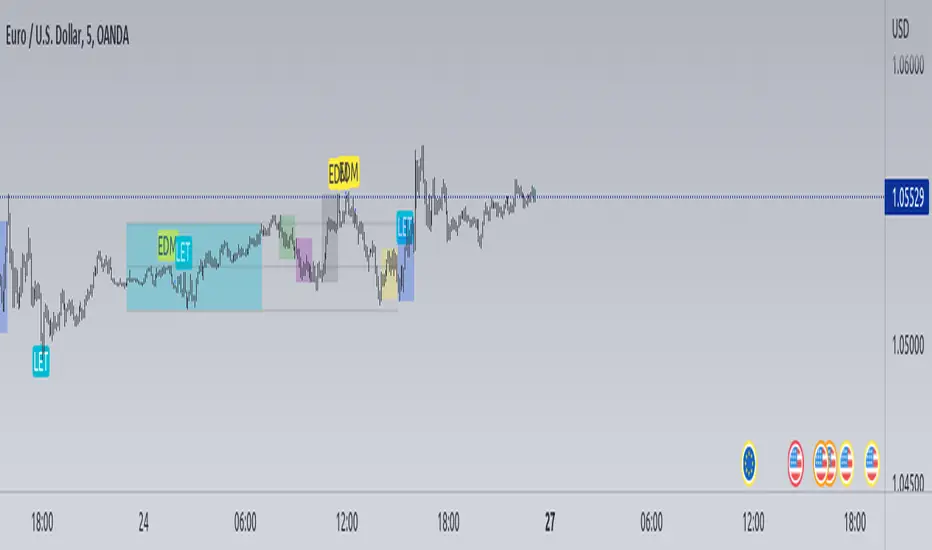
Edm + LET + SessionThis script is adressed to the LIT trader or for those of you who trade with session ( between different hour)
It will add to the chart the differnet session :
- asian session (here color aqua (blue))
- frankfurt
- London
- MMM1
- NYTRAP (New York Trap)
- an New York
You can choose in the settings which one you want to see and how you want to see it ( boxes or background color) which helps a lot when you open your chart to know where you are what you should expect if your plan is based on session.
I put some default hours but if you want less session and change the hours you can easily do that in the settings too.
It will also show you as a label the EDM (which is simply a divergence with the RSI) that occured 5 candle after it happend, it can be very useful for those of you who trade with this confluence, you will directly have it on your chart.
If you don't use it, you can also disable it in the settings.
The LET (which are a rebund on the EMA) are shown like the EDM and can be disable too if you don't use it, they will here depend of the EDM (i.e the script will look for a LET only after an EDM occured, if there is no EDM, they will not be visible).
I have tried to make the most stuff as an input ( can be modified in the settings) to allow each and everyone to be able to adapt it to what you want to see or not see on your charts.
Hope this help some of you and don't hesitate to send some feedback if it does !
Trend Trading with Currency Strength MeterThis is a trend trading strategy designed mainly for forex made of two big components:
First we have the currency meter, which is made of taking TSI of different INDEXes such as EUR, USD, GBP, JPY, NZD, AUD , CHF and CAD.
Once we establish which one is the weakest and most powerful, we pair them together and we go on that chart.
Lastly we check with the EMA 200 to confirm our direction.
We can see in this example for the USDJPY chart, that USD is the strongest, JPY is the weakest and ema confirm our bullish trend.
For timeframe in general I recommend big timeframes, 1-4h+ , and as a mentality a swing trading mentality, we can stay in trade for days/weeks.
For exit in general I recommend to exit when either one of the pairs losses/gain power or when the EMA is crossing with current candle
If you have any questions, let me know !

Swing forex strategy 15minThis is a strategy made using BB+ RSI indicators that seems to work great with 15 min major pairs for FOREX.
THe rules for it are simple:
For long we enter when the close of our candle crosses upwards the lower line and rsi crossover the over sold line
We exit long when we have a short entry.
For short we enter when the close of the candle crosses downwards the top line and rsi cross under the over bought line
WE exit short when we have a long entry.
Careful, this strategy has no risk management inside.
If you have any questions let me know !
ROC of Majors against the USD (Label)Version 2 of the ROC study that now puts them as a label on the same chart.
ROC of Majors against the USDA simple study that shows the majors against the USD Rate of Change.
Allows you to pick opposing strength pairs to trade.
There are different ROC calculations for people to play with as I am not sure which way the ( ) should be so feedback is welcome.
[RickAtw] O1 Opening Market LineThis indicator helps to identify current support and resistance based on the opening of the Asian, London and New York sessions.
Function
You can make good trade entries based on these lines. Shows daily and weekly openings of each session
It will also help you to look at which session you are currently trading)
Purple ----> Asian session
Red ----> London session
Blue ----> New York session
Key Signal
buy ---> A strong buy signal is a bounce from the low and the presence of a weekly or day open line.
sell ---> A strong sell signal is a bounce from the maximum and the presence of a weekly or day open line.
P.S. Be sure to test on your pair!
Remarks
This will help you determine the approximate area of support and resistance.
Since we cannot look into the future, it does not inform you about the exact records, but a possible change in trends.
Readme
In real life, I am a professional investor. And I check each of my indicators on my portfolio and how effective it is. I will not post a non-working method. The main thing is to wait for the beginning of trends and make money!
I would be grateful if you subscribe ❤️

London Breakout/Session GBP/USD Forex DaytradeThis is a forex strategy suited for day traders, specialized in the london breakout session
The key elements for this strategy are the specific london time session, together with an exit time(before asian trade/at the end of new york session).
At the same time, as logic elements we only use price action inside like :
For long we have 3 ascending candles, and for short we have 3 descending candles.
For exit we have both TP/SL based on price percentage movement, or we exit if we reach the end of the day.
If you have any questions message me in private !
