JL - DWM OHLCThis indicator plots the following price levels on your chart automatically AND will not show up if you are using a timeframe bigger than 60 minutes, 1 day, or 1 week.
Here are the price levels that are automatically plotted for you, and so you know the styling is different for Daily, Weekly, Monthly levels so you can easily distinguish between them:
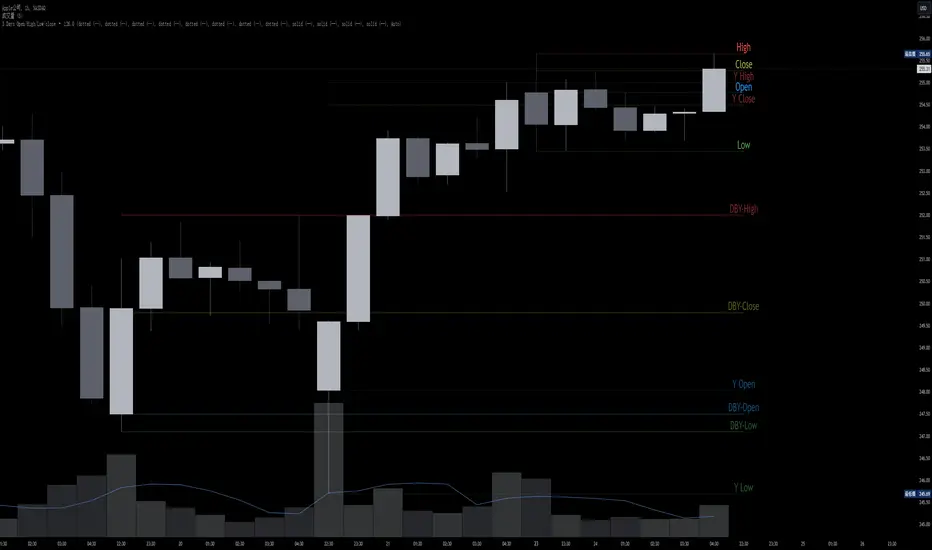
- Prior Day: High / Low / Close
- Current Day: Open
- Prior Week: High / Low / Close
- Current Week: Open
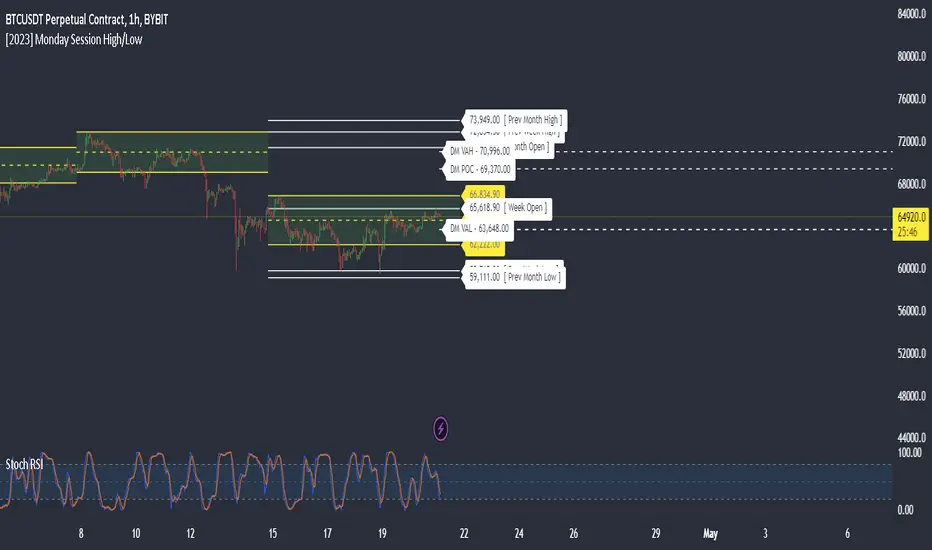
- Prior Month: High / Low / Close
- Current Month: Open
These plots are timeframe dependent and will not plot on subsequently higher timeframes, here is how they work:
Daily Price Levels are only shown on timeframes that are smaller than 60 minutes.
Weekly Price Levels are only shown on timeframes smaller than 1 Day.
Monthly Price Levels are only shown on timeframes smaller than 1 Week.
This way, you can turn on the indicator and not have to think about turning off certain price levels if you switch to a larger / longer timeframe than what you typically use.
For example, Daily OHLC price levels will quickly clutter the 60 minute chart, and likely you don't need to know the HLC of the Prior Day if you are looking at the 60 minute chart. Therefor it may be helpful to automatically hide the Daily price level plots, and only show the Weekly and Monthly plots on the 60 minute timeframe.
I hope you find this indicator helpful, thanks for reading.
Pine Script®指標