Absolute High and Low {Darkoexe}This indicator identifies and visually highlights the absolute highest and lowest closing prices on a chart. It is designed to help traders quickly recognize major price extremes that can serve as significant support/resistance levels or turning points in historical price action.
🔧 What It Does
The script plots persistent horizontal lines on your chart to mark either:
The absolute highest and lowest closing prices of the entire visible chart, or
The highest and lowest closing prices within a custom range of candles, defined by the user.
These price levels are plotted using thick green and red lines, respectively, and are updated dynamically as new highs or lows are set.
⚙️ How It Works
When “Use all candles” is enabled, the script continuously updates the high and low lines based on the full price history of the chart. These lines remain until a new extreme is made.
When disabled, the script checks only the most recent N candles (max bars back input). It scans this window to find and plot the highest and lowest closes.
The lines extend to the right to help users visually anchor these key levels in future price action.
🎯 Use Cases
Spotting extreme price levels for potential mean-reversion strategies.
Confirming breakout or breakdown conditions.
Defining long-term support and resistance zones.
This tool is especially useful for discretionary traders who value historical context and want clear visual markers for past price extremes.
⚠️ Notes and Limitations
This script is not predictive. It simply marks historical price extremes based on closing values.
When using the fixed range mode (max bars back), be aware that values outside this range will not be considered.
The indicator does not repaint, but in full chart mode, it updates only when a new extreme is formed.
Highlow

Swing-Based Volatility IndexSwing-Based Volatility Index
This indicator helps traders quickly determine whether the market has moved enough over the past few hours to justify scalping.
It measures the percentage price swing (high to low) over a configurable time window (e.g., last 4–8 hours) and compares it to a minimum threshold (e.g., 1%).
✅ If the percent move exceeds the threshold → Market is volatile enough to scalp (green background).
🚫 If it's below the threshold → Market is too quiet (red background).
Features:
Adjustable lookback period in hours
Custom threshold for volatility sensitivity
Automatically adapts to the current chart timeframe
This tool is ideal for scalpers and short-term traders who want to avoid entering trades in low-volatility environments.

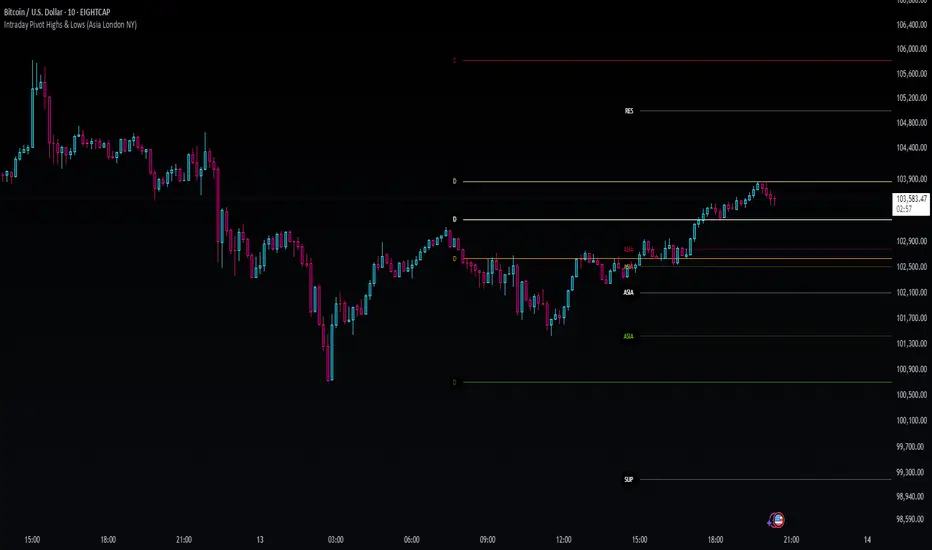
Intraday Pivot Highs & Lows (Asia London NY)Intraday Pivot Highs & Lows (Asia London NY)
Script Description
This TradingView indicator is optimized for Forex, scalping, intraday, and day trading strategies. It accurately plots Pivot Points and levels, high/low, support and resistance levels. These are clearly identified to aid the trader during killzone sessions and session opens. Ideal for scalp trading, intraday sessions, and leveraging SMT (Smart Money Techniques). Utilize these Price Levels effectively during London Open, NY Open, and the Asia Session, utilizing Market Structure to pinpoint key levels and reversal zones for successful trading. Improve your Trade Setups, recognize reliable Chart Patterns, identify critical Price Pivots, and trade confidently off Institutional Levels.
This script marks the intraday pivot highs, lows and midpoints retracement levels for
Asia
London
New York
It also plots the previous day's high, low, midpoint, and 0.618 Fibonacci retracement levels, providing traders with critical price reference points for making intraday trading decisions.
Originality & Usefulness
This indicator uniquely integrates pivot calculations across three major Forex sessions (Asia, London, NY), clearly delineating session boundaries.
It enhances visibility by using distinct styling
solid for New York
dashed for London
dotted lines for Asia
And colour co-ordinated labeling, improving traders' ability to identify important intraday price action zones efficiently. Unlike standard pivot indicators, this script emphasizes session-specific trading dynamics.
### Key Features ###
Session-Based Levels: Automatically plots high, low, midpoint, and Fibonacci (.618) levels for each major session (Asia, London, NY).
Distinct Visual Cues: Lines and labels use session-specific styles and colors to easily differentiate between sessions.
Previous Day Reference: Clearly plots and labels yesterday's high, low, midpoint, and Fibonacci levels.
Flexible Visibility: Traders can set timeframe visibility to maintain clean charts on higher timeframes.
### How It Works
At the start of next day's session, previous session lines are cleared, ensuring the chart remains uncluttered.
High, low, midpoint, and Fibonacci retracement levels (.618) are dynamically calculated and displayed at the close of each session.
All session levels remain visible until the start of the next respective session, providing continuous actionable insights.
Trading Application:
Session highs and lows act as strong intraday support and resistance zones.
Midpoints and Fibonacci levels are effective for identifying potential reversal zones and retracements.
Daily levels provide a broader context, useful for gauging intraday volatility and range.
### Limitations and Considerations ##
Best used on liquid assets with clear session-based price action, such as Forex major pairs, if used on indexes make sure they contain 24 hour price action not just New York session.
This indicator is designed to streamline intraday trading by clearly marking essential pivot points and session-based levels, significantly improving traders' market context and decision-making accuracy. Can be used to enhance SMT decision making when scalping killzones.
Enhanced HHLL Time Confirmation with EMAStrong recommendation , remove the green and red circle , or leave it how it is ;)
To be used on 1 minute chart MSTR , Stock
other time frames are good , ;)
How to Use
HHLL Signals: Look for green triangles (buy) below bars or red triangles (sell) above bars to identify confirmed HH/LL setups with trend alignment.
EMA Signals: Watch for lime circles (buy) below bars or maroon circles (sell) above bars when price crosses the EMA 400 in a trending market.
Trend Context: Use the EMA 400 as a dynamic support/resistance level and the SMA trend filter to gauge market direction.
Enable alerts to get notified of signals in real-time.
Best Practices
Adjust the Lookback Period and Confirmation Minutes to suit your timeframe (e.g., shorter for scalping, longer for swing trading).
Combine with other indicators (e.g., volume, RSI) for additional confirmation.
Test on your preferred market and timeframe to optimize settings.
Indicator Description: Enhanced HHLL Time Confirmation with EMA
Overview
The "Enhanced HHLL Time Confirmation with EMA" is a versatile trading indicator designed to identify key reversal and continuation signals based on Higher Highs (HH), Lower Lows (LL), and a 400-period Exponential Moving Average (EMA). It incorporates time-based confirmation and trend filters to reduce noise and improve signal reliability. This indicator is ideal for traders looking to spot trend shifts or confirm momentum with a combination of price structure and moving average crossovers.
Key Features
Higher High / Lower Low Detection:
Identifies HH and LL based on a customizable lookback period (default: 30 bars).
Signals are confirmed only after a user-defined time period (in minutes, default: 60) has passed since the last HH or LL, ensuring stability.
Trend Filter:
Uses a fast (10-period) and slow (30-period) Simple Moving Average (SMA) crossover to confirm bullish or bearish trends.
Buy signals require a bullish trend (Fast SMA > Slow SMA), and sell signals require a bearish trend (Fast SMA < Slow SMA).
EMA 400 Integration:
Plots a 400-period EMA (customizable) as a long-term trend reference.
Generates additional buy/sell signals when price crosses above (buy) or below (sell) the EMA 400, filtered by trend direction.
Visualizations:
Optional dashed lines for HH and LL levels (toggleable).
Debug markers (diamonds) to visualize HH/LL detection points.
Distinct signal shapes: triangles for HHLL signals (green/red) and circles for EMA signals (lime/maroon).
Alerts:
Built-in alert conditions for HHLL Buy/Sell and EMA Buy/Sell signals, making it easy to stay informed of key events.
Input Parameters
Lookback Period (default: 30): Number of bars to look back for HH/LL detection.
Confirmation Minutes (default: 60): Time (in minutes) required to confirm HH/LL signals.
High/Low Source: Select the price source for HH (default: high) and LL (default: low).
Show HH/LL Lines (default: true): Toggle visibility of HH/LL dashed lines.
Show Debug Markers (default: true): Toggle HH/LL detection markers.
EMA Period (default: 400): Adjust the EMA length.

Fibonacci Pivot Points & Previous D,W&M Highs/LowsIndicator Overview
This indicator combines Fibonacci Pivot Points with previous high and low levels for different timeframes (day, week, month). It plots these levels on the chart to provide traders with key support and resistance areas, making it easier to identify potential trading opportunities.
Features
Fibonacci Pivot Points:
The indicator calculates pivot points based on the high, low, and close prices.
Fibonacci levels are used to determine support (S1, S2, S3, S4, S5) and resistance (R1, R2, R3, R4, R5) levels.
Users can customize the Fibonacci levels for both support and resistance.
Previous Highs and Lows:
The indicator plots previous day, week, and month high and low levels.
Each of these lines can be customized in terms of visibility, color, and width.
This helps traders to see key historical levels that might act as support or resistance in the future.
Inputs and Customization:
Fibonacci Time Frame:
Users can select the timeframe for calculating the pivot points (Daily, Weekly, Monthly).
Fibonacci Levels:
Customizable input fields for each Fibonacci level (R1, R2, R3, R4, R5, S1, S2, S3, S4, S5).
Previous High/Low Lines:
Day Lines:
Options to show or hide previous day's high/low lines.
Customizable color and width for these lines.
Week Lines:
Options to show or hide previous week's high/low lines.
Customizable color and width for these lines.
Month Lines:
Options to show or hide previous month's high/low lines.
Customizable color and width for these lines.
Technical Calculations:
Fibonacci Pivot Points:
Calculated as:
pp = (High + Low + Close) / 3
S1 = pp - ((High - Low) * Fibonacci Level)
R1 = pp + ((High - Low) * Fibonacci Level)
Previous High/Low Levels:
Uses request.security to fetch previous high and low values for the selected timeframe.
Plotted using line.new to draw lines across the chart.
Plotting:
The indicator plots Fibonacci Pivot Points and previous high/low lines on the chart, using distinct colors for each level.
Customizable transparency and linewidths make it easier to visually interpret the levels.
This indicator is particularly useful for traders who rely on technical analysis to identify key support and resistance levels, offering a blend of historical data and Fibonacci-based predictions.
Feel free to ask if you have any specific questions or need further adjustments!

Swing Structure Scanner [LuxAlgo]The Swing Structure Scanner Indicator is a dashboard type indicator which displays a Consolidated "High/Low-Only" view of swing structure, with the capability to retrieve and display swing points from up to 6 different tickers and timeframes at once.
🔶 USAGE
This indicator displays swing structure data from up to 6 unique tickers or timeframes; Each graph represents the current swing structure retrieved from the requested chart/s.
Each swing graph displays the current live swing point positioning relative to the previous swing points. By analyzing the different formations, patterns can more easily be recognized and found across multiple tickers or timeframes at once.
This indicator serves as a nifty tool for confluence recognition, whether that's confluence throughout market tickers, or confluence through higher timeframes on the same ticker.
Alternatively, viewing the relative positioning of each swing point to each other, should give a clearer idea when higher lows or lower highs are formed. This can potentially indicate a newly forming trend, as well as serving as a warning to watch for breakouts.
The swing length can be changed to align with each individual's strategy, as well as a display look back can be adjusted to show more or less swing points at one time.
The display is fairly customizable, it is not fixed to 6 symbols at all times and can be minimized to only display the number of symbols needed; Additionally, the display can be set to vertical mode or horizontal(default) to utilize as needed.
Note: Hover over the swing point in the dashboard to get a readout of the exact price level of the swing point.
🔶 SETTINGS
Swing Length: Set the swing length for the structure calculations.
Swing Display Lookback: Sets the number of swing points (Pairs) to display in each Swing Graph display.
Symbols: Sets the Timeframe and Symbol for each Swing Graph.
Vertical Display: Display the Swing Graphs up and down, rather than side to side.
Scaling Factor: Scales the entire indicator up or down, to fit your needs.

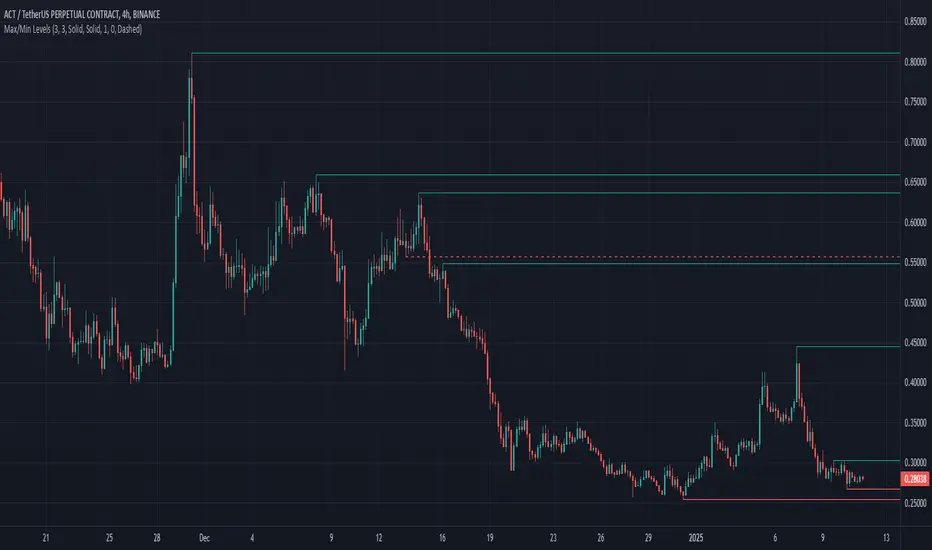
Max/Min LevelsHighlights highs and lows that match the search criteria. A high is considered to be broken if the candlestick breaks through its shadow
A three-candlestick pattern will match the parameters:
Candle before - 1
Candle after - 1
A five-candlestick pattern will match the parameters:
Candle before - 2
Candle after - 2
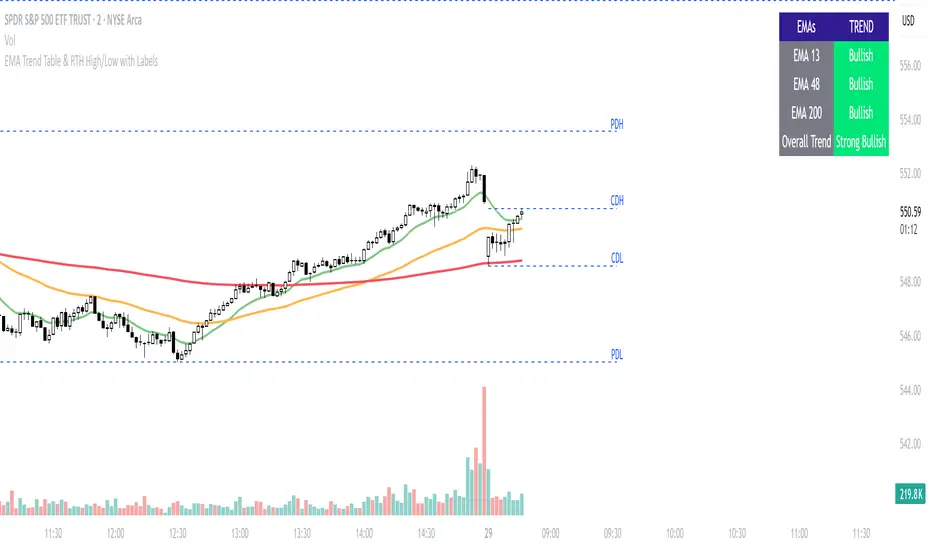
Previous Day and Current Day High/LowKey Features:
Previous Day High and Low Lines:
Displays the high (PDH) and low (PDL) levels of the previous trading day.
Allows customization of line colors, styles (solid, dashed, or dotted), and widths.
Extends these lines by a specified number of candles into the current day for better visualization.
Current Day High and Low Lines:
Displays the high (CDH) and low (CDL) levels during the current day's regular trading hours.
Customizable line attributes, including color, style, width, and extension length.
Customizable Input Options:
User-configurable settings for both the previous and current day high/low lines, grouped under respective sections for clarity.
Regular trading hours can be defined manually (default is 9:30 AM to 4:00 PM).
Ability to toggle the visibility of the lines for both the previous and current days.
Automatic Reset at the Start of a New Day:
Captures the high and low values of the completed day and resets for the new day.
Deletes old lines and labels to ensure clarity and avoid overlap.
Dynamic Updates:
Updates the current day's high and low lines and labels as new data comes in.
Adjusts previous day lines dynamically based on the user-defined number of candles to extend.
Session-Based Filtering:
Ensures the calculations and updates are restricted to the defined regular trading hours.
Code Logic:
Input Groups: The script uses grouped inputs to allow users to configure settings for previous and current day levels separately.
Line and Label Management: It creates and deletes lines and labels dynamically to prevent clutter and keep the chart organized.
Session Check: Uses the session input to determine if a bar falls within regular trading hours.
High/Low Calculation: Tracks the high and low for both the previous and current days during regular trading hours.
New Day Detection: Identifies the start of a new trading day to update previous day values and reset current day variables.
Applications:
Intraday Trading: Helps traders identify critical support and resistance levels from the previous and current days.
Trend Analysis: Provides visual cues for price movement trends across consecutive days.
Custom Visualization: With extensive customization options, traders can adapt the indicator to suit their trading style and chart aesthetics.
This script is highly configurable, making it versatile for a wide range of trading strategies and styles.
Last Candle OHLC (Ticks or Points)What the Code Does
1. **Draws Lines and Labels**:
- It draws lines on your chart to show the high, low, open, and close prices from the previous period (like the previous day or week).
- It also labels these lines with numbers that tell you how far the current price is from these levels.
2. **Shows Price Movement**:
- You can see how far the price has moved from these levels in terms of small price changes (ticks) or larger units (points).
- This helps you understand price movements and potential levels of support or resistance.
3. **Customizable**:
- You can choose whether to show these lines and labels, and you can select if you want to see the movement in ticks or points.
- The lines can extend into the future on your chart to help you anticipate where prices might be in the coming days.
### How It’s Useful:
1. **Identify Key Levels**:
- It helps you spot important price levels from past periods, which can act as support or resistance.
2. **Understand Price Movement**:
- You get a visual sense of how much the price has moved from key levels, which can help you gauge market volatility.
3. **Plan Trades**:
- By seeing where the price has been and how it has moved, you can better plan your trades, like deciding where to enter or exit based on these levels.
4. **Flexible for Different Markets**:
- It works across various markets, like stocks, futures, and forex, adjusting to the specific characteristics of each instrument.
In short, this tool helps you visualize and understand past price movements and levels on your chart, aiding in your trading decisions.

HT: Intraday LevelsIndicator draws several most important intraday levels: last day RTH high/low, ETH high/low, Half Back, Day Close and current day RTH Day Open. These levels often act as support/resistance for intraday price movements. Also, they can help to assess day character and control of power.
Indicator can be used for ETH + RTH sessions.
Important notes:
• User must specify RTH session time, appropriate for his time zone and exchange
• Half-back is calculated as a middle line between RTH High and Low.
• Day Close is always equal to close of the last bar of the previous day
• RTH Day Open will be redrawn for the current day as soon as it is known (after RTH session opens and at least one bar gets confirmed).
Known issues:
• Day open will not be shown if there is no bar, clearly corresponding to RTH open time (e.g. if 4h timeframe is selected)
• For some ETH sessions it is not possible to determine session’s last bar (this is pine script limitation) until next day trading starts. This means that daily levels will be also update with only then.
Parameters:
Date – user can select date, for which levels will be plotted. Works only if “Use” check box is on. Otherwise, levels will be plotted for the last day. (“time” value doesn’t matter; unfortunately, there is no way to hide the input box)
RTH Open/Close time – it is important to specify time, appropriate for your time zone.
Time zone – your chart time zone (as UTC offset)
Visuals – controls visibility and colors
Script is published as an open source. It uses two libraries: Levels Lib and Functions Lib. First one demonstrates how to work with pine-script object model and arrays. You can also reuse it in your custom scripts where there is need to construct any support/resistance levels. The second library contains some useful functions for working with time and dates.
Disclaimer
This indicator should not be used as a standalone tool to make trading decisions but only in conjunction with other technical analysis methods.

Octopus Nest Strategy Hello Fellas,
Hereby, I come up with a popular strategy from YouTube called Octopus Nest Strategy. It is a no repaint, lower timeframe scalping strategy utilizing PSAR, EMA and TTM Squeeze.
The strategy considers these market factors:
PSAR -> Trend
EMA -> Trend
TTM Squeeze -> Momentum and Volatility by incorporating Bollinger Bands and Keltner Channels
Note: As you can see there is a potential improvement by incorporating volume.
What's Different Compared To The Original Strategy?
I added an option which allows users to use the Adaptive PSAR of @loxx, which will hopefully improve results sometimes.
Signals
Enter Long -> source above EMA 100, source crosses above PSAR and TTM Squeeze crosses above 0
Enter Short -> source below EMA 100, source crosses below PSAR and TTM Squeeze crosses below 0
Exit Long and Exit Short are triggered from the risk management. Thus, it will just exit on SL or TP.
Risk Management
"High Low Stop Loss" and "Automatic High Low Take Profit" are used here.
High Low Stop Loss: Utilizes the last high for short and the last low for long to calculate the stop loss level. The last high or low gets multiplied by the user-defined multiplicator and if no recent high or low was found it uses the backup multiplier.
Automatic High Low Take Profit: Utilizes the current stop loss level of "High Low Stop Loss" and gets calculated by the user-defined risk ratio.
Now, follows the bunch of knowledge for the more inexperienced readers.
PSAR: Parabolic Stop And Reverse; Developed by J. Welles Wilders and a classic trend reversal indicator.
The indicator works most effectively in trending markets where large price moves allow traders to capture significant gains. When a security’s price is range-bound, the indicator will constantly be reversing, resulting in multiple low-profit or losing trades.
TTM Squeeze: TTM Squeeze is a volatility and momentum indicator introduced by John Carter of Trade the Markets (now Simpler Trading), which capitalizes on the tendency for price to break out strongly after consolidating in a tight trading range.
The volatility component of the TTM Squeeze indicator measures price compression using Bollinger Bands and Keltner Channels. If the Bollinger Bands are completely enclosed within the Keltner Channels, that indicates a period of very low volatility. This state is known as the squeeze. When the Bollinger Bands expand and move back outside of the Keltner Channel, the squeeze is said to have “fired”: volatility increases and prices are likely to break out of that tight trading range in one direction or the other. The on/off state of the squeeze is shown with small dots on the zero line of the indicator: red dots indicate the squeeze is on, and green dots indicate the squeeze is off.
EMA: Exponential Moving Average; Like a simple moving average, but with exponential weighting of the input data.
Don't forget to check out the settings and keep it up.
Best regards,
simwai
---
Credits to:
@loxx
@Bjorgum
@Greeny

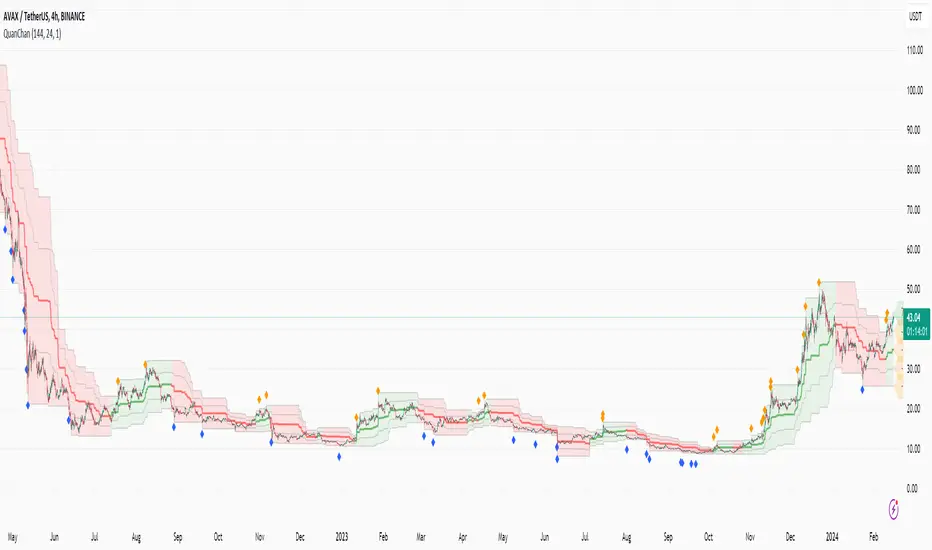
Quan Channel - Quan DaoI tried several channels, like the supertrend, ATR, Donchian or Bollingers, but they do not seem to fit my needs.
So I created a new channel to PREDICT the next impulse move of a price.
The current value of the top or bottom of the channel is based on 2 previous candles (not the candle itself), and it takes into account:
- The Direction of the previous candles (red or green) and
- The Width of their bodies
In my channel, the top or bottom lines will cover the price movement most of the time. But in some cases, when the price is on a big move, it will go out of the channel. And this is the time we need to consider a buy/sell (or take some profit) as well (not necessarily 100% of the time, though).
Personally, I like to use another oscillator in combination with this channel to predict whether it will reverse after the breakouts or continue to make another peak. If you are a DCA or long-term investor, I guess it would be safe to buy at the blue signals (out of bottom) and take some profits at the orange signals (out of top).
I also added an alert when the price breaks out of the channel for easier tracking.
series_collectionLibrary "series_collection"
A personal collection of commonly used series types like moving averages that are supported directly by
the pinescript library ('ALMA', 'DEMA', 'EMA', 'HMA', 'RMA', 'SMA', 'SWMA', 'VWMA', 'WMA'), highest and lowest source,
median and pivots. One single function (with overloads) that can be configured easily by the user input and can be
used as a core piece of functionality for many user cases. This library was created to abstract away and re-use this
commonly used functionality in my "Two MA Signal Indicator" script and the "Template Trailing Strategy" script. Both
of them use the "two_ma_logic" for defining entry and exit signals. While this piece of work does not contain any
novel mathematical expressions and just adds a convinient (and configurable) way to do things, I hope that might add
value to other scripts as well and future projects.
cust_series(length, seriesType, source)
cust_series - Calculate the custom series of the given source for the given length and type
Parameters:
length (simple int) : - The length of the custom series
seriesType (simple string) : - The type of the custom series
source (float) : - The source of the values
Returns: - The resulting value of the calculations of the custom series
cust_series(length, seriesType, source)
cust_series - Calculate the custom series of the given source for the given length and type
Parameters:
length (simple float) : - The length of the custom series (ceiled)
seriesType (simple string) : - The type of the custom series
source (float) : - The source of the values
Returns: - The resulting value of the calculations of the custom series

Market Pivot Levels [Past & Live]Market Levels provide a robust view of daily pivot points of markets such as high/low/close with both past and live values shown at the same time using the recently updated system of polylines of pinescript.
The main need for this script arose from not being able to use plots for daily points because plots are inherently once drawn can't be erased and because we can't plot stuff for previous bars after values are determined we can't use them reliably. And while we can use traditional lines, because we would have extremely high amount of lines and we would have to keep removing the previous ones it wouldn't be that effective way for us. So we try to do it with the new method of polylines .
Features of this script:
- Daily High/Low Points
- Yesterday High/Low/Close Points
- Pre-Market High-Low points.
Now let's preview some of the important points of code and see how we achieve this:
With the code below we make sure no matter which chart we are using we are getting the extended hours version of sessions so our calculations are made safely for viewing pre-market conditions.
// Let's get ticker extended no matter what the current chart is
tc = ticker.new(syminfo.prefix, syminfo.ticker, session.extended)
Coding our own function to calculate high's and low's because inbuilt pinescript function cannot take series and we send this function to retrieve our high's and lows.
// On the fly function to calculate daily highlows instead of tv inbuilt because tv's length cannot take series
f_highlow(int last) =>
bardiff = last
float _low = low, float _high = high
for i = bardiff to 0 by 1
if high > _high
_high := high
if low < _low
_low := low
With doing calculations at the bars of day ending points we can retrieve the correct points and values and push them for our polylines array so it can be used in best way possible.
// Daily change points
changeD = timeframe.change("D")
// When new day starts fill polyline arrays with previous day values for polylines to draw on chart
// We also update prevtime values with current ones after we pushed to the arrays
if changeD
f_arrFill(cpArrHigh, cpArrLow, prevArrh, prevArrl, prevArrc, prevMarh, prevMarl)
valHolder.unshift(valueHold.new(_high, _low, _high, _close, _low, time, pr_h, pr_l))
The rest of the code is annotated and commented. You can let me know in comments if you have any questions. Happy trading.

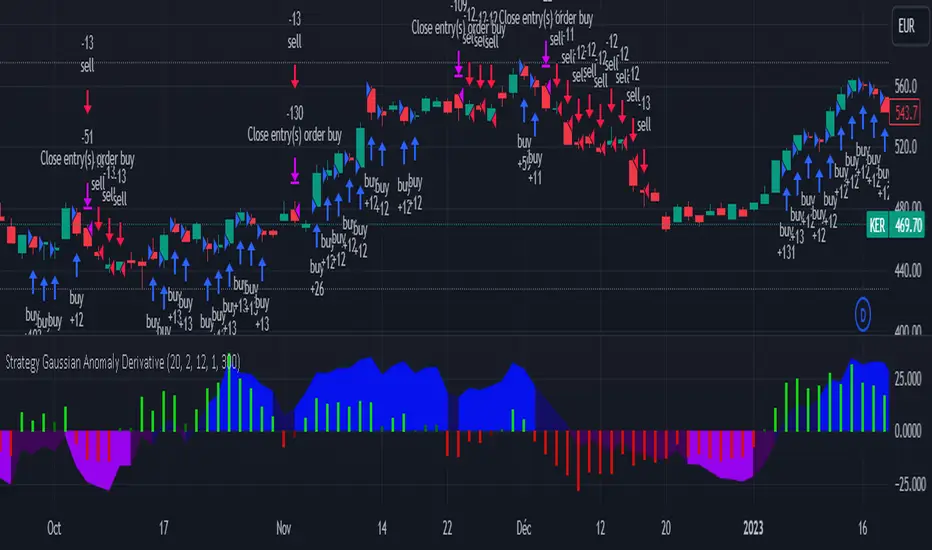
Strategy Gaussian Anomaly DerivativeConcept behind this Strategy :
Considering a normal "buy/sell" situation, an asset would be bought in average at the median price following a Gaussian like concept. A higher or lower average trend would significate that the current perceived value is respectively higher or lower than the current median price, which mean that the buyers are evaluating the price underpriced or overpriced.
This behaviour would be even more relevent depending on its derivative evolution.
Therefore, this Strategy setup is based on this Gaussian like concept anomaly of average close positionning compare to high-low average derivative, such as the derivative of the following ploted basic signal : 1-(high+low)/(2*close).
This Strategy can actually be used like a trend change and continuation strength indicator aswell.
In the Setup Signal part :
You can define the filtering of the basis signal "1-(high+low)/(2*close)" on EMA or SMA as you wish.
You can define the corresponding period and the threathold as a mutiply of the average 1/3 of all time value of the basis signal.
You can define the SMA filtering period of the Derivative signal and the corresponding threathold on the same mutiply of the average 1/3 of all time value of the derivative.
In the Setup Strategy part :
You can set up your strategy assesment based on Long and/or Short. You can also define the considered period.
The most successful tuned strategies I did were based on the derivative indicator with periods on the basis signal and the derivative under 30, can be 1 to 3 of te derivative and 7 to 21 for the basis signal. The threathold depends on the asset volatility aswell, 1 is usually the most efficient but 0 to 10 can be relevent depending on the situation I met. You can find an example of tuning for this strategy based on Kering's case hereafter.
I hoping that you will enjoy using this Strategy, don't hesitate to comment, to question, to correct or complete it ! I would be very curious about similar famous approaches that would have already been made.
Thank to you !
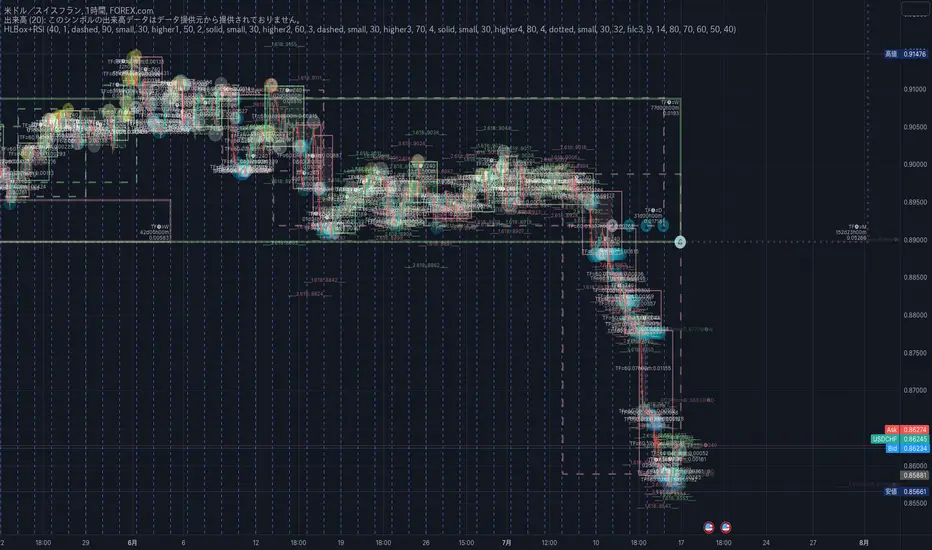
HighLowBox+220MAs[libHTF]HighLowBox+220MAs
This is a sample script of libHTF to use HTF values without request.security().
import nazomobile/libHTFwoRS/1
HTF candles are calculated internally using 'GMT+3' from current TF candles by libHTF .
To calcurate Higher TF candles, please display many past bars at first.
The advantage and disadvantage is that the data can be generated at the current TF granularity.
Although the signal can be displayed more sensitively, plots such as MAs are not smooth.
In this script, assigned ➊,➋,➌,➍ for htf1,htf2,htf3,htf4.
HTF candles
Draw candles for HTF1-4 on the right edge of the chart. 2 candles for each HTF.
They are updated with every current TF bar update.
Left edge of HTF candles is located at the x-postion latest bar_index + offset.
DMI HTF
ADX/+DI/DI arrows(8lines) are shown each timeframes range.
Current TF's is located at left side of the HighLowBox.
HTF's are located at HighLowBox of HTF candles.
The top of HighLowBox is 100, The bottom of HighLowBox is 0.
HighLowBox HTF
Enclose in a square high and low range in each timeframe.
Shows price range and duration of each box.
In current timeframe, shows Fibonacci Scale inside(23.6%, 38.2%, 50.0%, 61.8%, 76.4%)/outside of each box.
Outside(161.8%,261.8,361.8%) would be shown as next target, if break top/bottom of each box.
In HTF, shows Fibonacci Level of the current price at latest box only.
Boxes:
1 for current timeframe.
4 for higher timeframes.(Steps of timeframe: 5, 15, 60, 240, D, W, M, 3M, 6M, Y)
HighLowBox TrendLine
Draw TrendLine for each HighLow Range. TrendLine is drawn between high and return high(or low and return low) of each HighLowBox.
Style of TrendLine is same as each HighLowBox.
HighLowBox RSI
RSI Signals are shown at the bottom(RSI<=30) or the top(RSI>=70) of HighLowBox in each timeframe.
RSI Signal is color coded by RSI9 and RSI14 in each timeframe.(current TF: ●, HTF1-4: ➊➋➌➍)
In case of RSI<=30, Location: bottom of the HighLowBox
white: only RSI9 is <=30
aqua: RSI9&RSI14; <=30 and RSI9RSI14
green: only RSI14 <=30
In case of RSI>=70, Location: top of the HighLowBox
white: only RSI9 is >=70
yellow: RSI9&RSI14; >=70 and RSI9>RSI14
orange: RSI9&RSI14; >=70 and RSI9=70
blue/green and orange/red could be a oversold/overbought sign.
20/200 MAs
Shows 20 and 200 MAs in each TFs(tfChart and 4 Higher).
TFs:
current TF
HTF1-4
MAs:
20SMA
20EMA
200SMA
200EMA

Range Based Signals and AlertsThis script produces a compiled version of rule based signals that is meant to be used mainly on 5 Min timeframe based on daily(as default) Highs and Lows on average and the main purpose is to give user settings to change and adapt based on their needs and make it as adjustable as possible. This entry strategy idea does not belong to me but for TV's in-house rule reasons i can't disclose whose idea it is but i think people that will use this indicator will know who the original idea belongs to.
Rules used for signal production:
- Daily(As default) High-Low points
- Moving Average for detecting reversing of price
- MTF MACD (Daily as default) for detecting overall trend
Signals produced based on extensions of price out of daily zones and when they drop or rise back into moving average. A conditional checker is used for reducing repeated unnecessary signals and alerts.
Happy trading.

20/200MAs+LTF+4HTF and HighLowBox+3HTF20/200MAs
Shows 20 and 200 MAs in each TFs(tfChart,1 Lower and 4 Higher).
TFs:
current TF
Lower TF (default: lower1)
Higher TF1 (default: higher1)
Higher TF2 (default: higher1)
Higher TF3 (default: higher1)
Higher TF4 (default: higher1)
MAs:
20MA (default: sma)
1st 200MA (default: sma)
2nd 200MA (default: ema)
VWAP (optional)
HighLowBox+3HTF
Enclose in a square high and low range in each timeframe.
Shows price range and duration of each box.
In current timeframe, shows Fibonacci Scale inside(23.6%, 38.2%, 50.0%, 61.8%, 76.4%)/outside of each box.
Outside(161.8%,261.8,361.8%) would be shown as next target, if break top/bottom of each box.
1st box for current timeframe.
2nd box for higher timeframe.(default: higher1)
3rd box for higher timeframe.(default: higher2)
4th box for higher timeframe.(default: higher3)
static timeframes can also be used.

HighLowBox 1+3TF Enclose in a square high and low range in each timeframe.
Shows price range and duration of each box.
In current timeframe, shows Fibonacci Scale inside(23.6%, 38.2%, 50.0%, 61.8%, 76.4%)/outside of each box.
Outside(161.8%,261.8,361.8%) would be shown as next target, if break top/bottom of each box.
1st box for current timeframe.(default: Chart)
2nd-4th box for higher timeframes.(default: higher1,higher2,higher3)
static timeframes can also be used.
ICT HTF Liquidity Levels /w Alert [MsF]Japanese below / 日本語説明は英文の後にあります。
-------------------------
*This indicator is based on sbtnc's "HTF Liquidity Levels". It's a very cool indicator. thank you.
It has 3 functions: visualization of HTF liquidity (with alert), candle color change when displacement occurs, and MSB (market structure break) line display.
=== Function description ===
1. HTF liquidity (with alert)
Lines visualize the liquidity pools on the HTF bars. Alerts can be set for each TF's line.
Once the price reaches the line, the line is repaint.
To put it plainly, the old line disappears and a new line appears. The line that disappeared remains as a purged line. (It is also possible to hide the purged line with a parameter)
The alert will be triggered at the moment the line disappears. An alert will be issued when you touch the HTF's liquid pools where the loss is accumulated, so you can notice the stop hunting with the alert.
This alert is an original feature of this indicator.
The timeframe of the HTF can't modify. You can get Monthly, weekly, daily and H1 and H4.
Each timeframe displays the 3 most recent lines. By narrowing it down to 3, it is devised to make it easier to see visually. (This indicator original)
2. Displacement
Change the color display of the candlesticks when a bullish candle stick or bearish candle stick is attached. Furthermore, by enabling the "Require FVG" option, you can easily discover the FVG (Fair Value Gap). It is a very useful function for ICT trading.
3. MSB (market structure break)
Displays High/Low lines for the period specified by the parameter. It is useful for discovering BoS & CHoCH/MSS, which are important in ICT trading.
=== Parameter description ===
- HTF LIQUIDITY
- Daily … Daily line display settings (color, line width)
- Weekly … Weekly line display settings (color, line width)
- Monthly … Monthly line display settings (color, line width)
- INTRADAY LIQUIDITY
- 1H … 1H line display settings (color, line width)
- 4H … 4H line display settings (color, line width)
- PURGED LIQUIDITY … Display setting of the line once the candle reaches
- Show Purge Daily … Daily purged line display/non-display setting
- Show Purge Weekly … Weekly purged line display/non-display setting
- Show Purge Monthly … Monthly purged line display/non-display setting
- Show Purge 1H … 1H purged line display/non-display setting
- Show Purge 4H … 4H purged line display/non-display setting
- MARKET STRUCTURE BREAK - MBS
- Loopback … Period for searching High/Low
- DISPLACEMENT FOR FVG
- Require FVG … Draw only when FVG occurs
- Displacement Type … Displacement from open to close? or from high to low?
- Displacement Length … Period over which to calculate the standard deviation
- Displacement Strength … The larger the number, the stronger the displacement detected
-------------------------
このインジケータはsbtncさんの"HTF Liquidity Levels"をベースに作成しています。
上位足流動性の可視化(アラート付き)、変位発生時のローソク色変更、MSB(market structure break)ライン表示の3つの機能を有します。
<機能説明>
■上位足流動性の可視化
上位足の流動性の吹き溜まり(ストップが溜まっているところ)をラインで可視化します。ラインにはアラートを設定することが可能です。
一度価格がラインに到達するとそのラインは再描画されます。
平たく言うと、今までのラインが消えて新しいラインが出現する。という事です。
消えたラインはpurgeラインとして残ります。(パラメータでpurgeラインを非表示にすることも可能です)
アラートはラインが消える瞬間に発報します。上位足の損切り溜まってるところにタッチするとアラートを発報するので、アラートにてストップ狩りに気づくことができます。
このアラート発報については本インジケータオリジナルの機能となります。
表示可能な上位足のタイムフレームは固定です。月足、週足、日足およびH1とH4を表示することができます。
各タイムフレーム、直近から3つのラインを表示します。3つに絞ることで視覚的に見やすく工夫しています。(本インジケータオリジナル)
■変位発生時のローソク色変更
大きな陽線、陰線を付けた場合に、そのローソク足をカラー表示を変更します。
さらに"Require FVG"オプションを有効にすることで、FVG(Fair Value Gap)を容易に発見することができます。ICTトレードにを行うにあたり大変有用な機能となっています。
■MSB(market structure break)ライン表示
パラメータで指定した期間のHigh/Lowをライン表示します。ICTトレードで重要視しているBoS & CHoCH/MSSの発見に役立ちます。
<パラメータ説明>
- HTF LIQUIDITY
- Daily … 日足ライン表示設定(色、線幅)
- Weekly … 週足ライン表示設定(色、線幅)
- Monthly … 月足ライン表示設定(色、線幅)
- INTRADAY LIQUIDITY
- 1H … 1時間足ライン表示設定(色、線幅)
- 4H … 4時間足ライン表示設定(色、線幅)
- PURGED LIQUIDITY … 一度到達したラインの表示設定
- Show Purge Daily … 日足ライン表示/非表示設定
- Show Purge Weekly … 週足ライン表示/非表示設定
- Show Purge Monthly … 月足ライン表示/非表示設定
- Show Purge 1H … 1時間足ライン表示/非表示設定
- Show Purge 4H … 4時間足ライン表示/非表示設定
- MARKET STRUCTURE BREAK - MBS
- Loopback … High/Lowを探索する期間
- DISPLACEMENT FOR FVG
- Require FVG … FVG発生時のみ描画する
- Displacement Type … openからcloseまでの変位か?highからlowまでの変位か?
- Displacement Length … 標準偏差を計算する期間
- Displacement Strength … 変位の強さ(数字が大きいほど強い変位を検出)

Supply and DemandThis is a "Supply and Demand" script designed to help traders spot potential levels of supply (resistance) and demand (support) in the market by identifying pivot points from past price action.
Differences from Other Scripts:
Unlike many pivot point scripts, this one offers a greater degree of customization and flexibility, allowing users to determine how many ranges of pivot points they wish to plot (up to 10), as well as the number of the most recent ranges to display.
Furthermore, it allows users to restrict the plotting of pivot points to specific timeframes (15 minutes, 30 minutes, 1 hour, 4 hours, and daily) using a toggle input. This is useful for traders who wish to focus on these popular trading timeframes.
This script also uses the color.new function for a more transparent plotting, which is not commonly used in many scripts.
How to Use:
The script provides two user inputs:
"Number of Ranges to Plot (1-10)": This determines how many 10-bar ranges of pivot points the script will calculate and potentially plot.
"Number of Last Ranges to Show (1-?)": This determines how many of the most recent ranges will be displayed on the chart.
"Limit to specific timeframes?": This is a toggle switch. When turned on, the script only plots pivot points if the current timeframe is one of the following: 15 minutes, 30 minutes, 1 hour, 4 hours, or daily.
The pivot points are plotted as circles on the chart, with pivot highs in red and pivot lows in green. The transparency level of these plots can be adjusted in the script.
Market and Conditions:
This script is versatile and can be used in any market, including Forex, commodities, indices, or cryptocurrencies. It's best used in trending markets where supply and demand levels are more likely to be respected. However, like all technical analysis tools, it's not foolproof and should be used in conjunction with other indicators and analysis techniques to confirm signals and manage risk.
A technical analyst, or technician, uses chart patterns and indicators to predict future price movements. The "Supply and Demand" script in question can be an invaluable tool for a technical analyst for the following reasons:
Identifying Support and Resistance Levels : The pivot points plotted by this script can act as potential levels of support and resistance. When the price of an asset approaches these pivot points, it might bounce back (in case of support) or retreat (in case of resistance). These levels can be used to set stop-loss and take-profit points.
Timeframe Analysis : The ability to limit the plotting of pivot points to specific timeframes is useful for multiple timeframe analysis. For instance, a trader might use a longer timeframe to determine the overall trend and a shorter one to decide the optimal entry and exit points.
Customization : The user inputs provided by the script allow a technician to customize the ranges of pivot points according to their unique trading strategy. They can choose the number of ranges to plot and the number of the most recent ranges to display on the chart.
Confirmation of Other Indicators : If a pivot point coincides with a signal from another indicator (for instance, a moving average crossover or a relative strength index (RSI) divergence), it could provide further confirmation of that signal, increasing the chances of a successful trade.
Transparency in Plots : The use of the color.new function allows for more transparent plotting. This feature can prevent the chart from becoming too cluttered when multiple ranges of pivot points are plotted, making it easier for the analyst to interpret the data.
In summary, this script can be used by a technical analyst to pinpoint potential trading opportunities, validate signals from other indicators, and customize the display of pivot points to suit their individual trading style and strategy. Always remember, however, that no single indicator should be used in isolation, and effective risk management strategies should always be employed.

Multi-Timeframe High Low (@JP7FX)Multi-Timeframe High Low Levels (@JP7FX)
This Price Action indicator displays high and low levels from a selected timeframe on your current chart.
These levels COULD represent areas of potential liquidity, providing key price points where traders can target entries, reversals, or continuation trades.
Key Features:
Display high and low levels from a selected timeframe.
Customize line width, colors for high and low levels, and label text color.
Enable or disable the display of high levels, low levels, and labels.
Receive alerts when the price takes out high or low levels.
How to use:
It is important to note that using this indicator on it's own is not advisable. Instead, it should be combined with other tools and analysis for a more comprehensive trading strategy.
Possibly look to use my MTF Supply and Demand Indicator to look for zones to trade from at these levels?
If the price breaks above a high level, you might consider entering a long position, with the expectation that the price will continue to rise. Conversely, if the price breaks below a low level, you may think about entering a short position, anticipating further downward movement.
On the other hand, you can also use high or low levels to look for reversal trades, as these areas can represent attractive liquidity zones.
By identifying these key price points, you could take advantage of potential market reversals and capitalise on new trading opportunities.
Always remember to use this indicator in conjunction with other technical analysis tools for the best results.
Additionally, you can enable alerts to notify you when the price takes out high or low levels, helping you stay informed about significant price movements.
This indicator could be a valuable tool for traders looking to identify key price points for potential trading opportunities.
As always with the markets, Trade Safe :)

Draw Several Horizontal Lines [MsF]Japanese below / 日本語説明は英文の後にあります。
-------------------------
This indicator that automatically draws a horizontal line by copying from the input High/Low. Useful for doing horizon analysis. It's possible to display Fibonacci based on the entered High/Low. You can get the alert of each Fibonacci point.
- Parameter
Input Upper Value: Enter the High value
Input Lower Value: Enter the Low value
Band Range Count : Enter the number of horizontal lines
Fibonacci : visible or invisible
-------------------------
入力したHigh/Lowを起点に水平線を上下にコピーして自動で描画するインジケーターです。水平線分析を行うのに役立ちます。
また、入力したHigh/Lowを元にfibonacciを表示することも可能です。fibonacciについては、各ポイント毎にアラートの設定も可能です。
<パラメータ説明>
Input Upper Value:起点となるHighを入力してください
Input Lower Value:起点となるLowを入力してください
Band Range Count :水平線を上下にコピーする本数を入力してください
Fibonacci :フィボナッチが不要な場合はfalseにしてください