Kama and HMA trend followerThis strategy is meant to be used to follow trending markets. Use of other methodologies to define or anticipatetrends will greatly enhance profits. Enjoy!
HMA

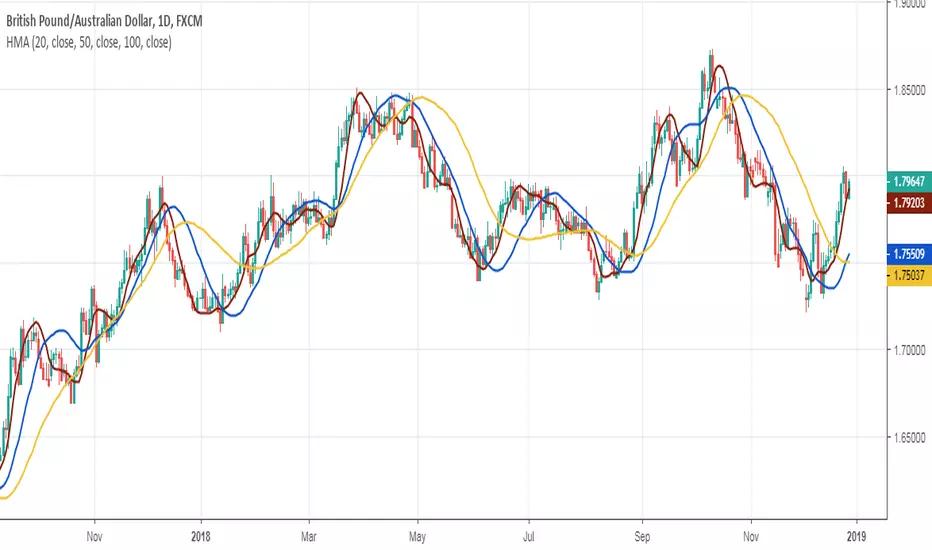
GR-Multiple Moving AveragesA simple indicator that contains all the main Moving Averages you'll probably need.
This indicator can be used on any time frame you wish.
The default periods for the moving averages are 5, 10, 20, 50, 100 & 200.
However you can set these values to whatever works for you, for example 5, 8, 10, 21, etc.
Please let me know in the comments below which values you use the most, so that I can adjust the defaults accordingly.
The lines get darker and thinker the more periods the MA covers.
You can easily adjust the colours of the lines and their thickness too.
The current colours seem to work OK on both the light and dark TradingView themes, but please do make suggestions for better default value.
You can also choose between 7 different ways of calculating the moving averages:
!None = You don't want to see this line
SMA ( Simple Moving Average )
EMA ( Exponential Moving Average )
WMA ( Weighted Moving Average )
DEMA ( Double Exponential Moving Average )
TEMA (Triple Moving Average
HMA ( Hull Moving Average )
Comments and suggestions are most welcome.
I'm available for hire to create custom indicators or to work on more complex projects.

Stratergy CM_Ultimate_MA_MTFThis is the script for the idea published by @ChrisMoody
Below is the link to the idea
()
Try the scripts for longer periods (e.g. 1 D).
The script still requires some tweaks as one of the issue is that the shorts and puts are being placed 2 candles after a confirmation is there. So use this strategy at your own risk.
Any inputs will really be helpful.
(Also thanks to @ChrisMoody for such a good indicator).


Double HULL Moving AverageTHIS IS A COMBINATION OF TWO HULL MOVING AVERAGE LINES
-ONE WITH LONGER PERIOD
-OTHER WITH SHORTER PERIOD TO INDICATE BUY/SELL SIGNALS
AS THE KNOWN GENERAL RULE;
IT WOULD BE A BUY SIGNAL WHEN SHORTER(BLUE LINE) HULL CROSSES ABOVE LONGER (RED LINE) ONE
AND CONVERSELY A SELL SIGNAL WHEN LONGER HULL CROSSES ABOVE SHORTER ONE
THIS STUFF IS USEFUL FOR USERS COMPLAINING ABOUTREACHING THE MAXIMUM NUMBER OF INDICATORS :)
KıvanÇ
@fr3762 on twitter (only tweeting in TURKISH)
fr3762 on youtube for indicator explanations in TURKISH)
TURKISH EXPLANATION:
2 HULL hareketli ortalaması aynı grafikte:
Kısa periyotlu (mavi) olan uzunu yukarı kestiğinde AL
Uzun periyotlu (kırmızı) olan kısayı yukarı kestiğinde SAT sinyalleri üretir
Varsayılan periyotlar, birer Fibonacci sayıları olan 8 ve 21 olarak belirlenmiştir, değiştirilebilir.
İndikatör sayısı sınırlamasının önüne geçmek amacıyla geliştirilmiştir.
