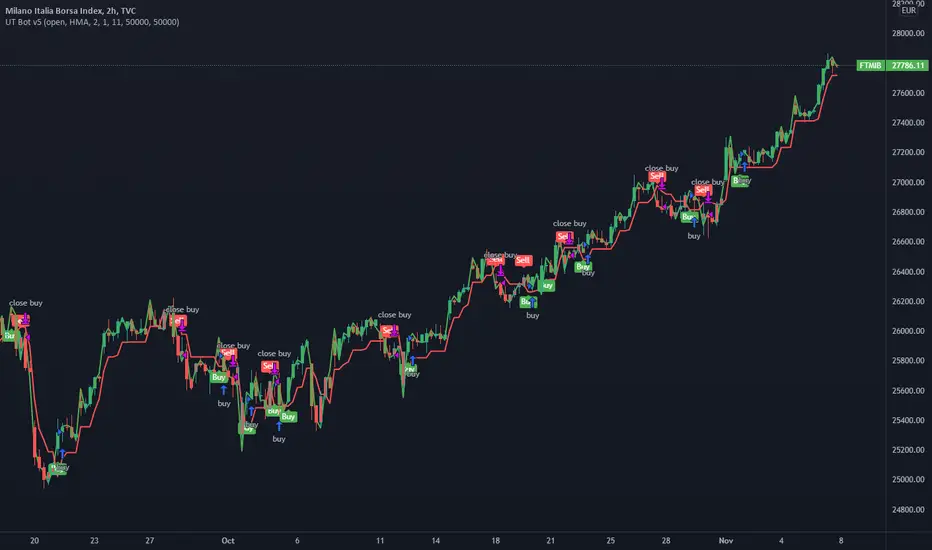
UT Bot v5This is an update by request, on someone elses strategy! well more of an edit, but also update from pine v4 to pine v5.
//CREDITS to HPotter for the orginal code. The guy trying to sell this as his own is a scammer lol.
//Edited and converted to @version=5 by SeaSide420 for Paperina
The UT Bot v5 is Movinging average (the MA) vs ATR (the ATR is in the form intended for use as trailing stop loss (ATR_TSL))
Entry logic:
buy = the MA > ATR_TSL and Price > ATR_TSL
sell = the MA < ATR_TSL and Price < ATR_TSL
The Moving average type can be changed in the settings:
options = "SMA", "EMA", "WMA", "HMA"]
the edits i made were:
convert to v5
Add TP and SL
Add Buy only or Sell only option
Add MA type option
Add price source option
Draw MA and ATR_TSL on-chart
船體移動平均線(HMA)
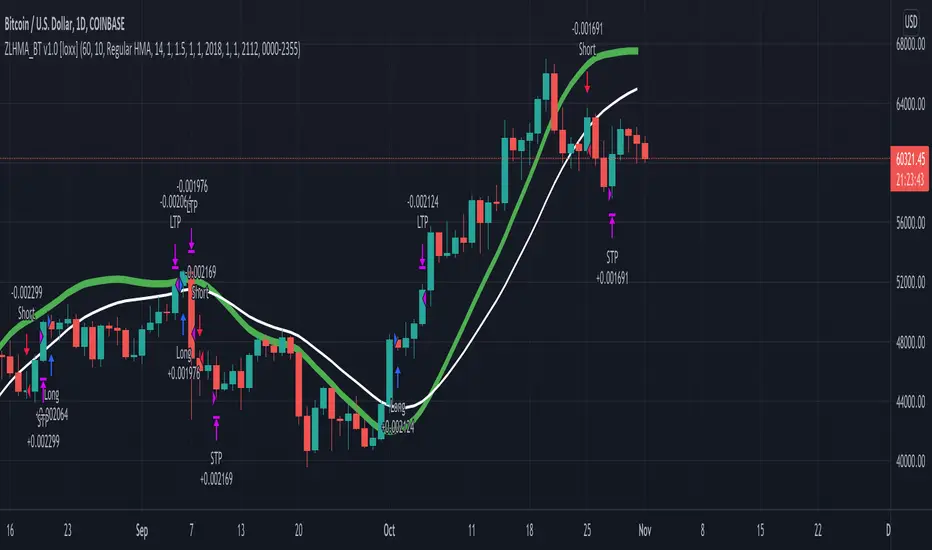
Zero-Lag HMA Backtest v1.0 [loxx]This backtest compares profitability differences between a regular Hull Moving Average ( HMA ) and a Zero-Lag HMA .
Things to know:
- Profit is set to 1 ATR
- Stop-loss is set to 1.5 ATR.
- This is by design to test the minimum the profit scenario (1 ATR up) and the worst case loss scenario (1.5 ATR down) for momentum trading. Actual results vary when additional TPs are added
How to use:
- Adjust settings and dates to view different market structures and position scenarios
- See results in the "Strategy Tester" pane
Conclusions and what's next
- Modifying HMA does very little to improve backtest results
- Future iterations will include options to backtest various moving averages with additional modifiers to improve profits and avoide losses
Comment below or send a PM with questions, comments, observations, or concerns.
HMA_ATR StrategyATR with HMA experimental minimalist bot for ETHBTC .
A strategy for use by Automated Algorithm systems.
Different from normal ATR as it uses HMA for smoothing.
Example settings result shown here on chart include commission 0.5%

HULLTSIBOTDo you like TSI indicator?
Do you like HMA indicator?
The all new, HULLTSIBOT indicator!
About:
TSI indicator was on a space mission to mine other planets and then the crew stumbled upon a bunch of HMA indicator eggs. In the darkness of the slime room they found, There was a suddenly a bunch of failing and swearing and machinegun fire muzzle flashes, then all fell silent.
from the back shadow mist stepped forward a TSI indicator, but its eyes were bloodshot and it did not look the same...
The rescue ship found the TSI indicator motionless but still with a heartbeat....
a few days went past, the TSI indicator layed in the medic bay,
A medic noticed a bulge in the abdomen, that started to move!
The alien lifeform burst through the stomach of the TSI indicator and flew at the medic, covering the face and overpowering the new victim with ease...
Quickly it spread throughout the entire rescue ships crew, with many new alien lifeforms searching every corner for a new host.
The rescue ship flew on, able to land with autopilot as programmed for in emergencies, Thus the HULLTSIBOT was introduced to the humans world...
planet earth
wtfBUYorSELLffsMultiple timeframe Hull moving averages. 1 Hull period, 3 timeframes.
With Info Panel
This strategy is for any pair but the settings are tuned for DOGEUSDT
It is 3 Hull moving averages crossovers.
The first HMA is taken from the timeframe of the chart.
The second and third HMA's have a setting for TIMEFRAME.
For example the user can have the chart on 15m, 2nd HMA on 60m(1H), 3rd HMA on 240m(1H)
A info panel is on chart with the signal from each timeframe.
The binance (where DOGEUSDT can be traded) commission fee of 0.1% is added to the results.
Adjust the commission fee to suit your broker and pair.
Tuned for trading cryptocurrency Elon Musk has constantly been backing – dogecoin.

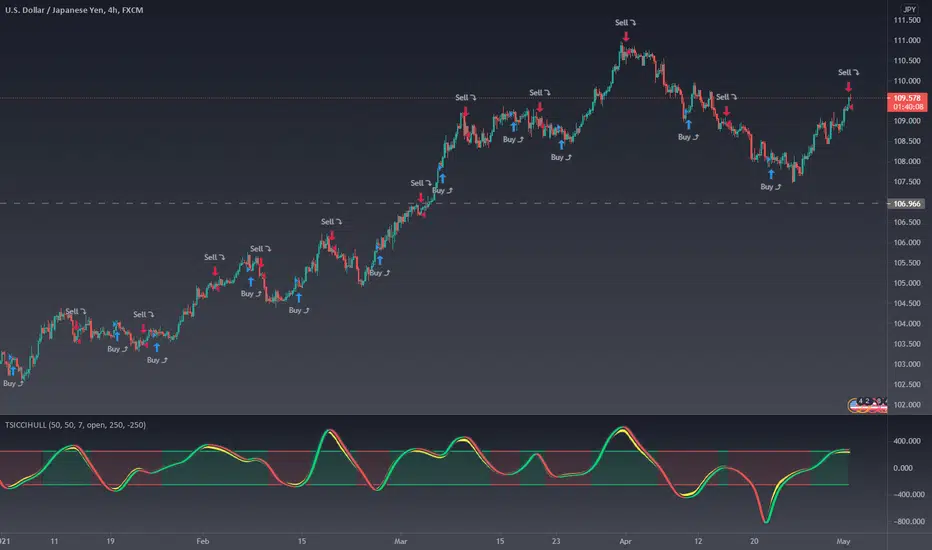
TSI HMA CCIHi!
This strategy has TSI and CCI indicators with the CCI being based on a HMA instead of the Price.
There is a number of conditions that must combine to create buy or sell signals, but it is basically a couple of MA crossovers.
The strategy opens new orders on each candle if the conditions are met, Either direction, so it is hedging.
It wont open new orders if there is a floating loss, and so is constantly attempting to hold a floating profit (drawup instead of drawdown)
But It has a StopLoss (set by user) for closing of losing orders, and it closes all orders in basket style when account is in profit to users set amount target profit.
Low commission set to simulate swap but Forex pairs generally dont have commission like the crypto exchanges do. So if you use this on cryptos, remember to increase the commission to your brokers amount.
Crypto users will likely find that because this opens so many orders the commission could erase its profits.
So i recommend this for Forex only, and perhaps, only NZDUSD 4H chart. other pairs, change settings for.
The strategy has settings for testing on target time spans, so you could test it on just Jan-Feb 2020 for example, if you want, or from Jan 2020 to present day.
Have Fun! Open Script for copy/paste/edit/publish your own version :)

Fancy Bollinger Bands Strategy [BigBitsIO]This script is for a Bollinger Band type indicator with built-in TradingView strategy including as many features as I can possibly fit into a Bollinger Band type indicator including a wide variety of options to create the most flexible Bollinger Bands strategy possible.
Features:
- A single custom moving average serving as the middle band.
- Standard MA inputs.
- MA type.
- MA period.
- MA price.
- MA resolution (time frame).
- Visibility toggle.
- MA Candle Type
- Fancy MA inputs.
- Toggle to show only candles included in the MA calculation ("Highlight inclusion") or display entire MA history.
- Toggle to show a ghost trail when Highlight inclusion is toggled on. Displays a shaded version of past MA history before the inclusion period (as seen on snapshot).
- Toggle to show forecast values for the MA.
- Other inputs related to forecasting:
- Forecast bias. (Neutral forecasts MA if the current price remains the same.)
- Forecast period.
- Forecast magnitude.
- Toggle showing details on the screen
- Toggle the visibility of the fill between the upper and lower bands.
- Toggle to use ATR instead of the standard deviation to calculate the location of the upper and lower bands.
- Custom input for the ATR period.
Strategy Features
-Strategy Window - only test during this window
-Take Profit and Stop Loss
-Open and Close conditions, including condition counts and any/all requirements
-Many conditions to choose from that can either be selected to open, close or open and close a position
-Conditions include:
-Price crossing above/below the Upper, Middle, or Lower bands
-Price being above/below the Upper, Middle, or Lower bands
-Bollinger Band width crossing or being above/below custom values
-Percent B crossing or being above/below custom values
This script may contain errors, or out of date code. Please be mindful of updates to the script.
*** DISCLAIMER: For educational and entertainment purposes only. Nothing in this content should be interpreted as financial advice or a recommendation to buy or sell any sort of security or investment including all types of crypto. DYOR, TYOB. ***

MrBS:Directional Movement Index [Trend Friend Strategy]This goes with my MrBS:DMI+ indicator. I originally combined them into one, but then you cannot set alerts based on what the ADX and DMI is doing, only strategy alerts, so separate ones have more flexibility and uses.
Indicator Version is found under "MrBS:Directional Movement Index " ()
//// THE IDEA
The majority of profits made in the market come from trending markets. Of course there are strategies that would say otherwise but for the majority of people, THE TREND IS YOUR FRIEND (until the end). The idea is to follow the trend, entering once it has established its self and exiting positions when the trend weakens. This strategy gives a rough idea of the returns produced from following purely the ADX signals. At first Heikin Ashi values were used for the calculation but the results show it's not that effective. The functionality to switch between calculation types has been left in, so we can uses HA candle data to generate signals from while looking at an OHLC chart, if we want to experiment. Due to the way strategies work, we are unable to get reliable results when running the strategy on the HA chart even if we are calculating the signals from the real OHLC values. It is best to always run strategies on standard charts.
When using this strategy, I look for confirmation of the signal based on stochastic (14:3:6) direction, reversal level of stochastic, and divergance, to add confidence and adjust position size accordingly. I am going to try and code some version of that in future updates, if anyone can help or has suggestions please drop me a message.
//// INDICATOR DETAILS
- The default settings are for optimized Daily charts, for 4 hour I would suggest a smoothing of 2.
- The default values used for calculation are the Real OHLC, we can change this to Heikin Ashi in the menu.
- The strategy enters a position when ADX crosses the threshold level, and closes the position when ADX starts to fall.
- There is a signal filter in the form of a 377 period Hull Moving Average, which the price must be above or bellow for long and short positions respectively.
- The strategy closes the position when a cross-under of the ADX and its 4 period EMA. This is an attempt to stay into positions longer as sometimes the ADX will fall for 1 bar and then keep rising, while the overall trend is strong. The downside to this is that we exit trades later and this affects our max drawdown.

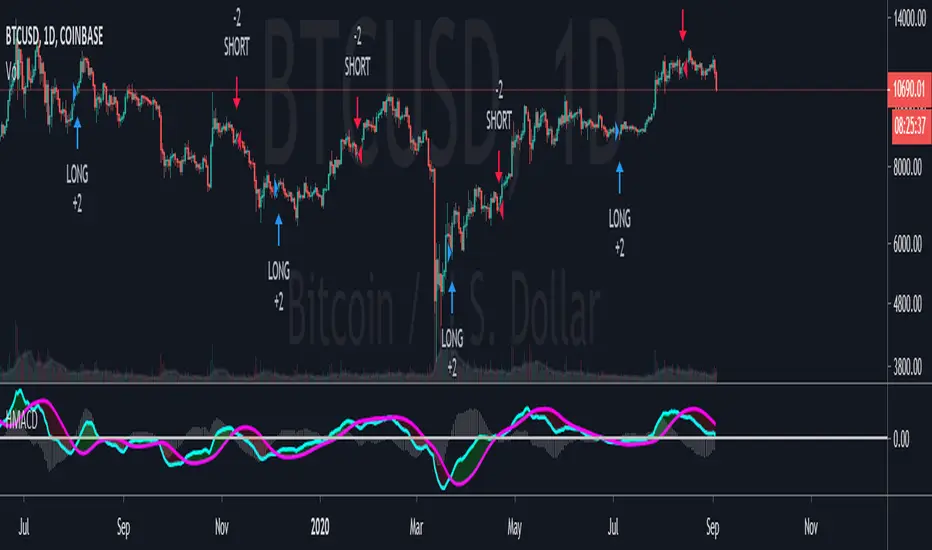
MACD TRADING SYSTEMThis is a conservative Trend Continuation Trading System.
Uses a Hull Moving Average to determine general trend direction
Uses MACD to initiate Trade entries
Uses a variant of Chaikin Money Flow for volume confirmation
Also uses the Average True Range (ATR) to determine take profit and stoploss.
Stoploss becomes trailing when take profit target has been hit.
I built it mainly for myself to use.
Wanted an objective trading system to take all the emotions out of my trading.

MillebotHello Traders,
Here you find a simplified version of the Millebot strategy.
This strategy can be used as a complete system with integrated risk management. The strategy also uses a fixed stoploss and take-profit, in contrast to the full version of the Millebot, which applies a variabele SL, TP an trailing TP derived from the assets volatility.
The Millebot is a trend-following system which detects the direction of the trend through "the Baseline". The entry-point is derived by using the Hull Moving Average.
If the HMA switches direction, the trade also will be closed.
An extra confirmation indicator can be activated to verify that the trend-detection is correct.
If you have found this trading system informative or useful, please leave a comment.
This strategy works very well on leveraged trading due to the low drawdown.
Greetings Michael

Hull FisherThis strategy has a Fisher-Transform indicator applied to the highs and lows of a Hull moving average instead of the price. It also has a Commodity Channel Index to help with entry/exit. Each part of the strategy can be turned on and off, for example turn off CCI or HMA so they are not used in the order opening/exiting. The base of the strategies entry and exit logic is the fisher transform line, if it crosses over outside the lines or either side of zero (adjustable in settings).
This example on ETHBTC Daily chart has common crypto exchange commission 0.25% added. Please adjust that setting to suit your pair/broker. For example a Forex pair does not have that much commission so reduce it for Forex charts.
Can be applied to any time frame or trading instrument.

Hull Moving Average vs CandleA Hull moving average is applied to the chart with settings for user to change the period of the Hull MA.
And a value of a previous candle is compared to the HMA. If the HMA is above the previous candle value, then the strategy will buy.
If below, it will sell. The default setting for the HMA is 50 and the Candle is D1 (Daily timeframe)
So basically if the HMA value is greater than yesterdays candle open, buy. ( i use open as a price source to avoid repainting)
This example is put onto ETHBTC chart and currency changed from default to BTC and Equity set to 1 BTC and commission set to 0.25%
The ETHBTC chart seems to follow good old moving average more than other pairs.
The strategy can be used on any pair and timeframes.
A good idea for setting the HMA period is:
small timeframe=big period, big timeframe=small period.
range from period=3 to period=200 is about right, for charts from 4H to 1 minute.
This HMA strategy is fairly simple, best to use other sources of information in combination with moving averages.
And strict money management, risk/reward control is very important to any trading strategy.
Not intended as stand alone strategy but has potential for bot use, i will publish a study version soon, for use with alerts and API bots.

HULL MACDA modified version of MACD.
Uses Hull moving average for the signal line instead of your typical EMA.
Can be used as a crossover strategy with decent win rate.
Alternatively, can also be used for histogram divergences.
Try it out! :)
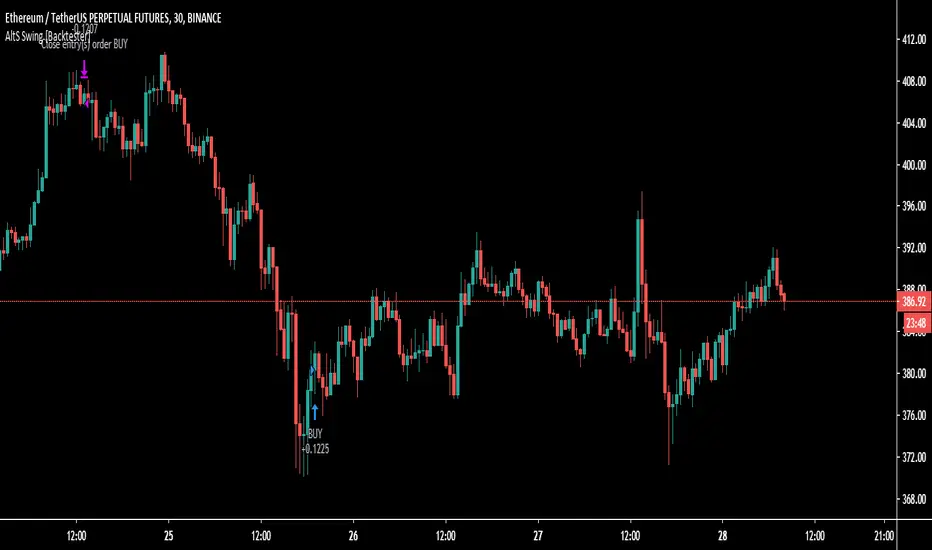
AltS Swing [Backtester]
PLEASE READ THIS DESCRIPTION TO SAVE TIME AND UNDERSTAND WHAT THIS INDICATOR DOES
This is the backtesting version for this script
In this back tested version I have shown it to be used on regular candles with realistic calculations in regards to positions sizes, slippage, fees and more
Kind Regards
This is a official version of AltSignals Long/Short Reverse Indicator
Description:
This indicator uses various indicators in combination with each other, some of the key ones to mention is Hulls, EMA , MA. Along with that it uses EMA crossovers to get the precise entries and exits.
The recommended time frames with this indictor are shorter ones, for example 5m,10m,15m work well, along with that I have found that some of the more unique time frames also work well such as 20m,45m,2hr and so on.
This indicator is not super advanced but it's still very powerful, with only 130 lines of code.
This indicator works on every chart, time, and candle type but you must play with the settings to find what is best, the same setting will not work on every pair etc.
With AltSignals Swing Indicator it trades one way, that means it gives 3 pieces of information. BUY/TakeProfit/StopLoss.
Unlike most indicators which Buy and Sell both ways this one focuses on one direction of trading so please take into account when using this.
I have added in a reverse strategy which basically shows the opposite values of of the buy, so if you select the box in the settings and un-tick it, then it will show opposite directions so sells only.
This feature is very useful especially in general bear markets when buying is difficult.
I have also added in the option for no stop losses to be used, if you set the stop loss value = 100 then it will show no stop losses.
I suggest a stop loss somewhere in the region of 1-2-3%, please note that you can use decimal stop losses too so for example 0.1 or 0.5.
This indicator is NOT a once size fits all, every chart is different, time frame and candles also, so i would suggest spending some time going through and playing with the channel length settings, which will change the EMA numbers.
Using this along with the back script to find the ideal settings is the best way to use this script, once you have done that make sure to save those values somewhere.
Its important to remember that the Regular script and the back testing script values should be the same for them to match up on the chart, so the channel lengths, stop losses and so on values should be the same.
Side note
This is not financial advice.
We will continue making updates as time goes on.
If you would like to try this script for free please visit our website or message us on Tradingview live chat.

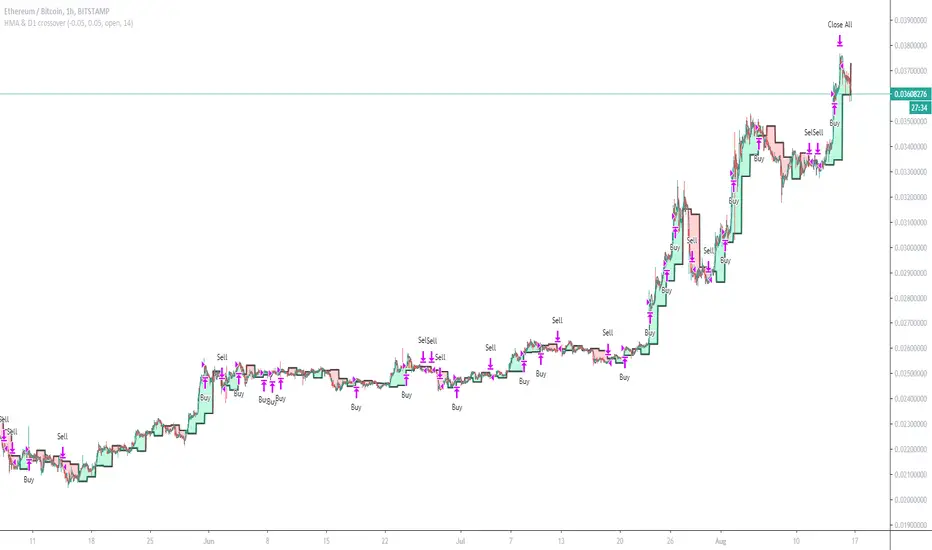
HMA & D1 crossoverCan work on Forex if change equity currency and SL and TP etc
This example tuned for ETH/BTC
Enters on HMA (Hull Moving Average) and D1 (Daily Candle) crossovers, Exits basket when profit = TP (Target Profit)
Has Commission and slippage added, test equity at 1 BTC lotsize set too 1% of equity for each order
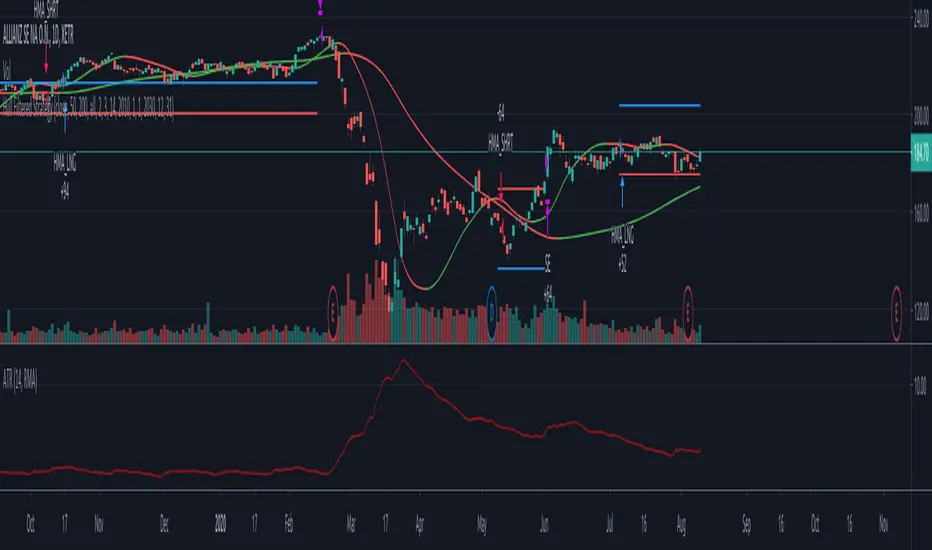
Hull Moving Average based strategyThis is a simple Hull Moving Average based strategy using a short term HMA for signal generation and a long term HMA for filtering purposes.
A long entry is generated if the short term HMA changes direction from decreasing to increasing values and if the long term HMA indicates an uptrend (i.e. previous value < current value)
A short entry is generated if the short term HMA changes direction from increasing to decreasing values and if the long term HMA indicates a downtrend (i.e. previous value > current value)
Positions are closed using an ATR based stop loss/take profit system. Stop Loss (red) and Take Profit (blue) levels are plotted on the chart.
TSI CCI Hull with profit$$$This is a modified version of @SeaSide420 TSI CCI Hull with profits exit on long and short order
ORIGINAL SCRIPT:
/// /// feel free to edit/improve and comment

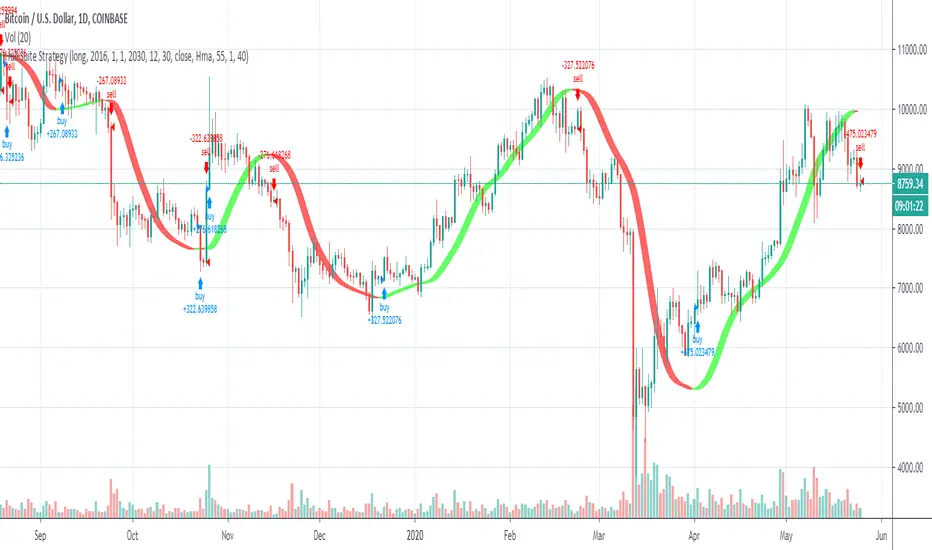
Hull Suite StrategyConverted the hull suite into a strategy script for easy backtesting and added ability to specify a time periods to backtest over.
1337 StrategyThis is a WIP strategy based on the 1337 Oscillator. It seems to catch some of the nice trending moves on the 1H but needs work to filter the choppy signals after a move and during consolidation.


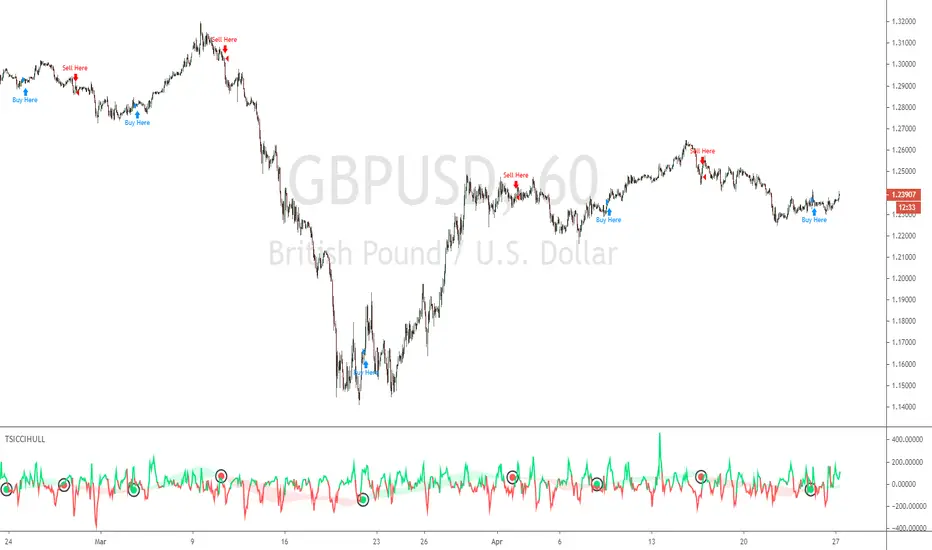
TSI CCI HullThis Strategy is Using TSI and CCI and Hull Moving Average to make swing trades on 1H chart but can be used on any pair and timeframe just change settings to suit (Hull Period mostly)
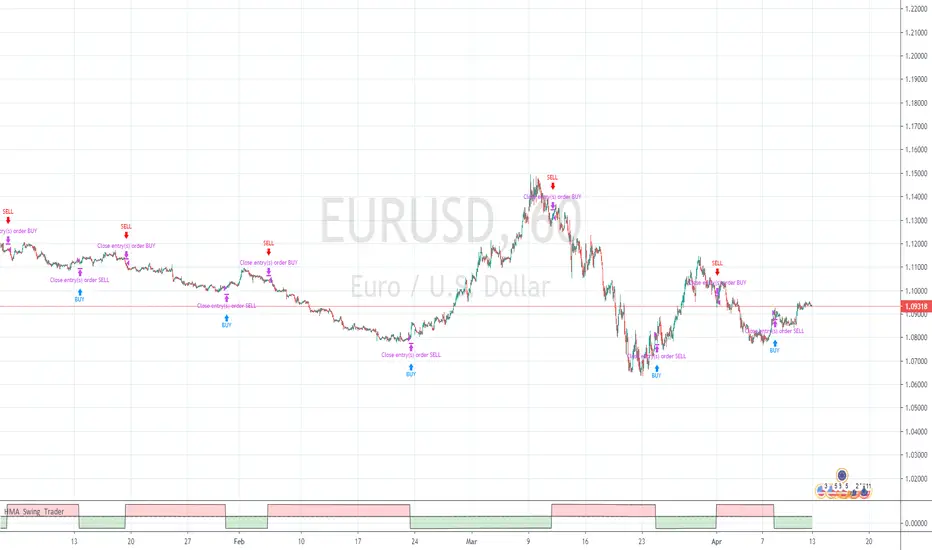
Hull Moving Average Swing TraderHull Moving Average Strategy
2 X HMA's,
1st HMA on current price (recommended source OPEN)
2nd HMA on previous candle. signal on crossover.
Buy and Sell signals on chart, red & green view pane (Green Buy, Red Sell)