CandelaCharts - OHLC Macro Range Map 📝 Overview
Elevate your candlestick analysis with the OHLC Macro Range Map!
Unlike conventional OHLC charts, this advanced indicator weaves Inner Circle Trader (ICT) principles into its design, helping you decode accumulation, manipulation, and distribution patterns—candle by candle.
ICT traders recognize manipulation through wicks that extend against the candle’s closing direction—a deliberate move to mislead participants into unfavorable positions. These deceptive movements often hint at market manipulation phases. By decoding these subtle signals, traders can anticipate the distribution phase of a candle, where price action reveals potential liquidity targets, retracement zones, and key reversal points.
These levels offer valuable insights into order flow, revealing how price interacts with them and the sequence of movements within the market.
To enhance price analysis, the tool also monitors the average duration of manipulation and distribution phases. By blending historical timing patterns with key price levels associated with these phases, traders can conduct deeper analyses and fine-tune their strategies for better decision-making.
Although grounded in historical data, this indicator does not promise that past patterns will replicate in future market conditions. Instead, it provides a data-driven framework to identify moments when candles are likely to reverse after manipulation phases or retrace following completed distributions. This empowers traders to pinpoint potential market turning points with greater accuracy.
📦 Features
This tool offers a range of powerful features to enhance your trading analysis:
Average Range Accuracy : Simplify candlestick analysis with advanced lines and labels to pinpoint manipulation, distribution, and time pivots. Graph average ranges for your chosen timeframe to navigate market volatility and uncover key support and resistance zones.
Custom Timeframe Selection : Align your analysis with your trading strategy by choosing a timeframe that highlights the candle’s manipulation, distribution, and key timing.
Real-time Data Feed : Stay updated with live candlestick stats, with each new candle updating OHLC data and performing ongoing historical calculations, even on sub-minute timeframes.
Historical Mapping : Backtest past market scenarios with ease using the historical mapping feature. Traders can revisit and analyze previous data, refine strategies, and customize label displays for journaling flexibility.
User-Friendly Interface : Designed for advanced traders, the intuitive interface allows easy navigation and customization of display settings, offering a personalized experience for data-driven analysis.
⚙️ Settings
Macros: Sets the timeframe to which will be drawn.
Lookback: Controls period length in days.
Method: Sets the desired calculation algorithm.
History: Display Macro Range Map drawings for previous sessions.
Timezone: Dsiplay the data based on the selected timezone.
Opn: Style for Open line.
Man: Style for Manipulation line.
Dis: Style for Distribution line.
Time: Style for Timeline.
Labels: Controls the size and abbreviations.
Table Position: Manage the Macro Range Map table position
⚡️ Showcase
Here’s a visual showcase of the tool in action, highlighting its key features and capabilities:
Manipilation & Distribution
Time
📒 Usage
Here’s how you can use the OHLC Macro Range Map to enhance your analysis:
Add OHLC Macro Range Map to your Tradingview chart.
Select a timeframe and customize the styles to fit your preferences.
Watch as calculated manipulation, distribution, and delivery times align with your analysis.
Combine this data with other models and insights to strengthen your trading strategy.
Example 1
By following these steps, you'll unlock powerful insights to refine and elevate your trading strategies.
🔹 Notes
On Bullish candles:
Manipulation: Open - Low
Distribution: Open - High
On Bearish candles:
Manipulation: Open - High
Distribution: Open - Low
Available calculation methods:
Mean
Median
Price patterns on OHLC Macro Range Map:
Open - -Man - +Dis
Open - -Man - Open - +Dis
Open - -Man - +Man - +Dis
Open - -Man - +Man - -Dis
Open - +Man - -Dis
Open - +Man - Open - -Dis
Open - +Man - -Man - -Dis
Open - +Man - -Man - +Dis
🚨 Alerts
The indicator does not provide any alerts!
⚠️ Disclaimer
These tools are exclusively available on the TradingView platform.
Our charting tools are intended solely for informational and educational purposes and should not be regarded as financial, investment, or trading advice. They are not designed to predict market movements or offer specific recommendations. Users should be aware that past performance is not indicative of future results and should not rely on these tools for financial decisions. By using these charting tools, the purchaser agrees that the seller and creator hold no responsibility for any decisions made based on information provided by the tools. The purchaser assumes full responsibility and liability for any actions taken and their consequences, including potential financial losses or investment outcomes that may result from the use of these products.
By purchasing, the customer acknowledges and accepts that neither the seller nor the creator is liable for any undesired outcomes stemming from the development, sale, or use of these products. Additionally, the purchaser agrees to indemnify the seller from any liability. If invited through the Friends and Family Program, the purchaser understands that any provided discount code applies only to the initial purchase of Candela's subscription. The purchaser is responsible for canceling or requesting cancellation of their subscription if they choose not to continue at the full retail price. In the event the purchaser no longer wishes to use the products, they must unsubscribe from the membership service, if applicable.
We do not offer reimbursements, refunds, or chargebacks. Once these Terms are accepted at the time of purchase, no reimbursements, refunds, or chargebacks will be issued under any circumstances.
By continuing to use these charting tools, the user confirms their understanding and acceptance of these Terms as outlined in this disclaimer.
Ict

CandelaCharts - OHLC Session Range Map 📝 Overview
Master the art of candlestick analysis with the OHLC Session Range Map!
Enhance your TradingView strategies by incorporating this advanced tool for actionable insights. Far beyond standard OHLC visuals, this innovative indicator integrates Inner Circle Trader (ICT) concepts to analyze accumulation, manipulation, and distribution, one candle at a time.
ICT traders identify manipulation through wicks that extend opposite the candle’s close—a tactic designed to mislead market participants into taking positions in the "wrong" direction. These movements often signify potential manipulation phases. By interpreting these signals, traders can anticipate a candle’s distribution phase, where the price expands to higher or lower levels. This provides valuable insights into liquidity targets, retracement zones, and potential reversals.
These levels provide critical insights into order flow, illustrating how price interacts with them and the sequence in which it unfolds.
To refine price analysis further, the tool also tracks the average timing for the completion of manipulation and distribution phases. By combining historical timing patterns with price levels tied to these phases, traders can perform more in-depth analyses and enhance their market strategies.
While rooted in historical data, this indicator does not guarantee that past patterns will repeat in future market conditions. Instead, it offers a data-driven approach to identifying moments when candles are likely to reverse after manipulation phases or retrace following completed distributions, enabling traders to spot potential turning points with greater precision.
📦 Features
This tool offers a range of powerful features to enhance your trading analysis:
Average Range Accuracy : Simplify candlestick analysis with advanced lines and labels to pinpoint manipulation, distribution, and time pivots. Graph average ranges for your chosen timeframe to navigate market volatility and uncover key support and resistance zones.
Custom Timeframe Selection : Align your analysis with your trading strategy by choosing a timeframe that highlights the candle’s manipulation, distribution, and key timing.
Real-time Data Feed : Stay updated with live candlestick stats, with each new candle updating OHLC data and performing ongoing historical calculations, even on sub-minute timeframes.
Historical Mapping : Backtest past market scenarios with ease using the historical mapping feature. Traders can revisit and analyze previous data, refine strategies, and customize label displays for journaling flexibility.
User-Friendly Interface : Designed for advanced traders, the intuitive interface allows easy navigation and customization of display settings, offering a personalized experience for data-driven analysis.
⚙️ Settings
Sessions: Sets the timeframe to which will be drawn.
Lookback: Controls period length in days.
Method: Sets the desired calculation algorithm.
History: Display Session Range Map drawings for previous sessions.
Timezone: Dsiplay the data based on the selected timezone.
Opn: Style for Open line.
Man: Style for Manipulation line.
Dis: Style for Distribution line.
Time: Style for Timeline.
Labels: Controls the size and abbreviations.
Table Position: Manage the Session Range Map table position
⚡️ Showcase
Here’s a visual showcase of the tool in action, highlighting its key features and capabilities:
Manipilation & Distribution
Time
📒 Usage
Here’s how you can use the OHLC Session Range Map to enhance your analysis:
Add OHLC Session Range Map to your Tradingview chart.
Select a timeframe and customize the styles to fit your preferences.
Watch as calculated manipulation, distribution, and delivery times align with your analysis.
Combine this data with other models and insights to strengthen your trading strategy.
Example 1
Example 2
By following these steps, you'll unlock powerful insights to refine and elevate your trading strategies.
🔹 Notes
On Bullish candles:
Manipulation: Open - Low
Distribution: Open - High
On Bearish candles:
Manipulation: Open - High
Distribution: Open - Low
Available calculation methods:
Mean
Median
Price patterns on OHLC Session Range Map:
Open - -Man - +Dis
Open - -Man - Open - +Dis
Open - -Man - +Man - +Dis
Open - -Man - +Man - -Dis
Open - +Man - -Dis
Open - +Man - Open - -Dis
Open - +Man - -Man - -Dis
Open - +Man - -Man - +Dis
🚨 Alerts
The indicator does not provide any alerts!
⚠️ Disclaimer
These tools are exclusively available on the TradingView platform.
Our charting tools are intended solely for informational and educational purposes and should not be regarded as financial, investment, or trading advice. They are not designed to predict market movements or offer specific recommendations. Users should be aware that past performance is not indicative of future results and should not rely on these tools for financial decisions. By using these charting tools, the purchaser agrees that the seller and creator hold no responsibility for any decisions made based on information provided by the tools. The purchaser assumes full responsibility and liability for any actions taken and their consequences, including potential financial losses or investment outcomes that may result from the use of these products.
By purchasing, the customer acknowledges and accepts that neither the seller nor the creator is liable for any undesired outcomes stemming from the development, sale, or use of these products. Additionally, the purchaser agrees to indemnify the seller from any liability. If invited through the Friends and Family Program, the purchaser understands that any provided discount code applies only to the initial purchase of Candela's subscription. The purchaser is responsible for canceling or requesting cancellation of their subscription if they choose not to continue at the full retail price. In the event the purchaser no longer wishes to use the products, they must unsubscribe from the membership service, if applicable.
We do not offer reimbursements, refunds, or chargebacks. Once these Terms are accepted at the time of purchase, no reimbursements, refunds, or chargebacks will be issued under any circumstances.
By continuing to use these charting tools, the user confirms their understanding and acceptance of these Terms as outlined in this disclaimer.

CandelaCharts - OHLC Range Map 📝 Overview
Explore the intricate art of candlestick analysis with the OHLC Range Map!
Elevate your TradingView experience by integrating this dynamic tool into your trading strategies with actionable insights. This cutting-edge indicator transcends standard OHLC visuals, leveraging Inner Circle Trader (ICT) concepts to dissect accumulation, manipulation, and distribution on a candle-by-candle basis.
ICT traders recognize manipulation through the wick extending opposite the candle’s close. This movement often serves to mislead market participants into taking positions in the "wrong" direction, signaling potential manipulation legs. Analysts can use these insights to anticipate a candle’s distribution phase. During distribution, price extends to higher or lower levels, offering key clues for identifying liquidity draws, potential retracements, or reversals.
These levels offer valuable insights into order flow, highlighting how price interacts with them and the sequence of its delivery.
To enhance price mapping, the tool also charts the average timing for the completion of manipulation and distribution phases. This feature empowers traders to combine historical timing patterns with the price levels associated with manipulation and distribution for a deeper analysis.
Like all tools based on historical data, this indicator does not guarantee that past patterns will replicate in future market conditions. Designed with a data-driven edge, it highlights moments when candles are likely to reverse following manipulation phases or retrace after completing defined distributions, helping analysts spot potential turning points.
📦 Features
This tool offers a range of powerful features to enhance your trading analysis:
Average Range Accuracy : Simplify candlestick analysis with advanced lines and labels to pinpoint manipulation, distribution, and time pivots. Graph average ranges for your chosen timeframe to navigate market volatility and uncover key support and resistance zones.
Custom Timeframe Selection : Align your analysis with your trading strategy by choosing a timeframe that highlights the candle’s manipulation, distribution, and key timing.
Real-time Data Feed : Stay updated with live candlestick stats, with each new candle updating OHLC data and performing ongoing historical calculations, even on sub-minute timeframes.
Historical Mapping : Backtest past market scenarios with ease using the historical mapping feature. Traders can revisit and analyze previous data, refine strategies, and customize label displays for journaling flexibility.
User-Friendly Interface : Designed for advanced traders, the intuitive interface allows easy navigation and customization of display settings, offering a personalized experience for data-driven analysis.
⚙️ Settings
Timeframe: Sets the timeframe to which will be drawn.
Period: Controls period length in days.
Algorithm: Sets the desired calculation algorithm.
History: Display Range Map drawings for previous sessions.
Timezone: Dsiplay the data based on the selected timezone.
Use NY Midnight Open: Controls from where a Range Map will start detection.
Opn: Style for Open line.
Man: Style for Manipulation line.
Dis: Style for Distribution line.
Time: Style for Timeline.
Labels: Controls the size and abbreviations.
Line Position: Manage the Range Map line position
Table Position: Manage the Range Map table position
⚡️ Showcase
Here’s a visual showcase of the tool in action, highlighting its key features and capabilities:
Manipilation & Distribution
Time
📒 Usage
Here’s how you can use the OHLC Range Map to enhance your analysis:
Add OHLC Range Map to your Tradingview chart.
Select a timeframe and customize the styles to fit your preferences.
Watch as calculated manipulation, distribution, and delivery times align with your analysis.
Combine this data with other models and insights to strengthen your trading strategy.
Example 1
Example 2
By following these steps, you'll unlock powerful insights to refine and elevate your trading strategies.
🔹 Notes
On Bullish candles:
Manipulation: Open - Low
Distribution: Open - High
On Bearish candles:
Manipulation: Open - High
Distribution: Open - Low
Available calculation methods:
Mean
Median
Price patterns on OHLC Range Map:
Open - -Man - +Dis
Open - -Man - Open - +Dis
Open - -Man - +Man - +Dis
Open - -Man - +Man - -Dis
Open - +Man - -Dis
Open - +Man - Open - -Dis
Open - +Man - -Man - -Dis
Open - +Man - -Man - +Dis
🚨 Alerts
The indicator does not provide any alerts!
⚠️ Disclaimer
These tools are exclusively available on the TradingView platform.
Our charting tools are intended solely for informational and educational purposes and should not be regarded as financial, investment, or trading advice. They are not designed to predict market movements or offer specific recommendations. Users should be aware that past performance is not indicative of future results and should not rely on these tools for financial decisions. By using these charting tools, the purchaser agrees that the seller and creator hold no responsibility for any decisions made based on information provided by the tools. The purchaser assumes full responsibility and liability for any actions taken and their consequences, including potential financial losses or investment outcomes that may result from the use of these products.
By purchasing, the customer acknowledges and accepts that neither the seller nor the creator is liable for any undesired outcomes stemming from the development, sale, or use of these products. Additionally, the purchaser agrees to indemnify the seller from any liability. If invited through the Friends and Family Program, the purchaser understands that any provided discount code applies only to the initial purchase of Candela's subscription. The purchaser is responsible for canceling or requesting cancellation of their subscription if they choose not to continue at the full retail price. In the event the purchaser no longer wishes to use the products, they must unsubscribe from the membership service, if applicable.
We do not offer reimbursements, refunds, or chargebacks. Once these Terms are accepted at the time of purchase, no reimbursements, refunds, or chargebacks will be issued under any circumstances.
By continuing to use these charting tools, the user confirms their understanding and acceptance of these Terms as outlined in this disclaimer.

CandelaCharts - Swing Failure Pattern (SFP)# SWING FAILURE PATTERN
📝 Overview
The Swing Failure Pattern (SFP) indicator is designed to identify and highlight Swing Failure Patterns on a user’s chart. This pattern typically emerges when significant market participants generate liquidity by driving price action to key levels. An SFP occurs when the price temporarily breaks above a resistance level or below a support level, only to quickly reverse and return within the previous range. These movements are often associated with stop-loss hunting or liquidity grabs, providing traders with potential opportunities to anticipate reversals or key market turning points.
A Bullish SFP occurs when the price dips below a key support level, triggering stop-loss orders, but then swiftly reverses upward, signaling a potential upward trend or reversal.
A Bearish SFP happens when the price spikes above a key resistance level, triggering stop-losses of short positions, but then quickly reverses downward, indicating a potential bearish trend or reversal.
The indicator is a powerful tool for traders, helping to identify liquidity grabs and potential reversal points in real-time. Marking bullish and bearish Swing Failure Patterns on the chart, it provides clear visual cues for spotting market traps set by major players, enabling more informed trading decisions and improved risk management.
📦 Features
Bullish/Bearish SFPs
Styling
⚙️ Settings
Length: Determines the detection length of each SFP
Bullish SFP: Displays the bullish SFPs
Bearish SFP: Displays the bearish SFPs
Label: Controls the size of the label
⚡️ Showcase
Bullish
Bearish
Both
📒 Usage
The best approach is to combine a few complementary indicators to gain a clearer market perspective. This doesn’t mean relying on the Golden Cross, RSI divergences, SFPs, and funding rates simultaneously, but rather focusing on one or two that align well in a given scenario.
The example above demonstrates the confluence of a Bearish Swing Failure Pattern (SFP) with an RSI divergence. This combination strengthens the signal, as the Bearish SFP indicates a potential reversal after a liquidity grab, while the RSI divergence confirms weakening momentum at the key level. Together, these indicators provide a more robust setup for identifying potential market reversals with greater confidence.
🚨 Alerts
This script provides alert options for all signals.
Bearish Signal
A bearish signal is triggered when a Bearish SFP is formed.
Bullish Signal
A bullish signal is triggered when a Bullish SFP is formed.
⚠️ Disclaimer
Trading involves significant risk, and many participants may incur losses. The content on this site is not intended as financial advice and should not be interpreted as such. Decisions to buy, sell, hold, or trade securities, commodities, or other financial instruments carry inherent risks and are best made with guidance from qualified financial professionals. Past performance is not indicative of future results.

4H CRT (1AM and 5AM)This TradingView script is designed to assist traders in implementing the "4-Hour Candle Ranges Theory Strategy (CRT)" by identifying key levels and setups based on the 1am and 4am (5am) 4-hour candles. This strategy is particularly effective for trading high-volatility assets such as Gold, EUR/USD, NAS100, US30, and S&P500, with US30 showing a notably high win rate. Here's how the strategy works:
Key Features:
1. Marking 1am and 4am 4-Hour Candle Ranges
- The script highlights the high and low of the 1am 4-hour candle.
- It visually tracks whether the high or low of the 1am candle is taken out by the subsequent 4-hour candle (5am).
2. Entry Setup Rules
- Primary Setup: Wait for the high or low of the 1am candle to be taken out by the 5am candle. Once this sweep occurs, wait for a Market Structure Shift (MSS) on the lower time frame (15min) to confirm your entry.
- Secondary Setup: If the 5am candle fails to take out the high or low of the 1am candle, the setup focuses on the levels formed by the 5am candle.
3. Trade Execution on 15-Minute Timeframe
- The script supports a lower time frame (15min) view to identify MSS and fine-tune entries.
4. Rinse and Repeat
- This process can be applied daily for consistent opportunities across the specified assets.
Advantages:
- Provides clear visual markers for key levels based on the 4-hour candles.
- Automates level plotting, saving traders time and reducing manual errors.
- Integrates well with the 15-minute timeframe for precise entry triggers.
- Optimized for popular trading instruments, especially US30 for a higher probability of success.
This script simplifies the application of CRT by automating the process of identifying and marking critical levels, enabling traders to focus on executing high-probability setups effectively.
Created by Hamid (poraymanfx)

ADR Table BY @ICT_YEROADR Table BY @ICT_YERO
Created by: @ICT_YERO
This custom indicator is designed to provide the Average Daily Range (ADR) for multiple timeframes, including Daily, 4-Hour, and 1-Hour. The indicator is tailored to assist traders in understanding price volatility and making informed trading decisions.
Key Features
Multi-Timeframe ADR Calculation:
Automatically calculates and displays the ADR for Daily, 4-Hour, and 1-Hour timeframes.
Helps traders identify potential price movement ranges for different trading sessions.
Dynamic Range Visualization:
Clear visual representation of the ADR on the chart, making it easy to spot price extremes.
Real-time updates to reflect changes in price movement.
Custom Alerts:
Option to set alerts when the price approaches the ADR high or low.
Useful for identifying potential reversal zones or breakout opportunities.
User-Friendly Interface:
Simple and intuitive settings to customize colors, levels, and display preferences.
Seamlessly integrates with your existing TradingView setup.
ICT-Inspired Methodology:
Designed for traders who follow ICT concepts, focusing on precision and high-probability setups.
Applications
Range Trading: Helps determine the high and low boundaries for scalping or intraday setups.
Volatility Analysis: Understand market behavior during different times of the day or week.
Reversal Zones: Identify areas where price is likely to reverse, based on ADR extremes.
Whether you're a scalper, day trader, or swing trader, this indicator provides a comprehensive overview of price volatility across multiple timeframes, making it an essential tool for your trading arsenal.

CandelaCharts - Equal Highs/Lows (EQH/EQL) 📝 Overview
The Equal Highs/Lows indicator is a specialized tool for detecting equal highs and lows within price movements.
These levels hold importance as they frequently signal possible reversal zones or consolidation phases in the market. By leveraging Average True Range (ATR) thresholds, the indicator employs tailored settings to pinpoint these critical price levels with precision.
Visual Markings: Lines and labels highlight equal highs and lows directly on the chart.
Dynamic Adaptability: It adjusts in real time to market volatility, ensuring accurate level identification through ATR-based thresholds.
Equal Highs are not used as entry and exit points; instead, they are used as confirmation that the current market trend will reverse. This means that when an EQH is formed on a chart, traders can adapt a bearish bias and look for only short entries.
📦 Features
Key features of the indicator include:
Visual Markings: Lines and labels highlight equal highs and lows directly on the chart.
Dynamic Adaptability: It adjusts in real time to market volatility, ensuring accurate level identification through ATR-based thresholds.
Styling
⚙️ Settings
Show: Controls whether EQH/EQL are displayed on the chart.
Line Style: Controls the line type and line width
Bullish Color: Color of the bullish EQH/EQL
Bearish Color: Color of the bearish EQH/EQL
⚡️ Showcase
Short Term
Intermediate Term
Long Term
🚨 Alerts
This script provides alert options for all signals.
Bearish Signal
A bearish signal is triggered when the price forms an EQH.
Bullish Signal
A bullish signal is triggered when the price forms an EQL.
⚠️ Disclaimer
Trading involves significant risk, and many participants may incur losses. The content on this site is not intended as financial advice and should not be interpreted as such. Decisions to buy, sell, hold, or trade securities, commodities, or other financial instruments carry inherent risks and are best made with guidance from qualified financial professionals. Past performance is not indicative of future results.

Enigma Unlocked 2.0Description for "Enigma Unlocked 2.0" Pine Script Indicator
Overview
Enigma Unlocked 2.0 is an advanced and highly customizable indicator designed to deliver actionable buy and sell signals by leveraging precise candlestick logic during specific market transitions. This indicator is built for flexibility, helping traders identify high-probability trade setups during key trading periods, specifically the transitions between the Asian Kill Zone and London Kill Zone as well as the London Kill Zone and New York Kill Zone on the 30-minute timeframe.
By combining Enigma Unlocked 2.0 with the ICT Killzones & Pivots indicator, traders can gain a deeper understanding of the timing and location of these transitions. Waiting for signals during these defined kill zones increases the likelihood of finding high-probability trade setups.
How to Use
Follow the Kill Zone Transitions:
Use the ICT Killzones & Pivots indicator to clearly visualize the boundaries of the Asian, London, and New York kill zones.
Focus on the signals generated by Enigma Unlocked 2.0 that align with these kill zone transitions.
Plotting Entries and Targets with Gann Box:
For Buy Signals:
Use the Gann Box tool to mark the high and low of the signal candle.
Ensure your Gann Box settings include only the 50%, 0%, and 100% levels.
Your entry zone lies between the 50% and 100% levels (discount zone). This is where buy trades are expected to offer an optimal risk-reward ratio.
For Sell Signals:
Similarly, plot the Gann Box on the high and low of the signal candle.
The 50% to 100% zone acts as the premium area for sell trades.
Setting Stop Loss and Targets:
To identify a safe stop loss, split the 50% zone of the Gann Box using another Gann Box.
Draw the secondary Gann Box from 50% to 100% of the initial box, then extend it to double the height.
For sell trades, place the stop loss above the extended 100% level.
For buy trades, place the stop loss below the extended 100% level.
Aim for a minimum of 1:1 risk-to-reward to ensure optimal trade management.
How It Works
Buy Logic:
Buy Logic 1: Detects a bullish candle (close > open) that:
Closes above its midpoint (50% of the candle body).
Has a low lower than the previous candle's low.
Buy Logic 2: Identifies a bearish candle (close < open) that:
Closes above its midpoint (50% of the candle body).
Has a low lower than the previous candle's low.
Sell Logic:
Sell Logic 1: Detects a bearish candle (close < open) that:
Closes below its midpoint (50% of the candle body).
Has a high higher than the previous candle's high.
Sell Logic 2: Identifies a bullish candle (close > open) that:
Closes below its midpoint (50% of the candle body).
Has a high higher than the previous candle's high.
Real-Time Alerts and Visual Cues:
Green triangles below candles indicate buy opportunities.
Red triangles above candles indicate sell opportunities.
Built-in alert conditions notify you of signals in real-time, so you never miss a trading opportunity.
Why Use Enigma Unlocked 2.0?
Precision: Advanced candlestick logic ensures that signals are generated only under optimal conditions.
Session-Based Filtering: Signals occur exclusively during the most active market sessions (kill zones), improving trade quality.
Visualization: Simple yet effective tools like Gann Box integration and clear visual signals make this indicator easy to use and highly effective.
Real-Time Alerts: Stay informed of potential trades even when you're away from your screen.
Enigma Unlocked 2.0 empowers traders to harness the power of candlestick analysis and session-based strategies for disciplined and effective trading. Pair this with a solid understanding of risk management and kill zones to achieve consistent results in your trading journey.

CandelaCharts - Volume Imbalance (VI) 📝 Overview
Volume Imbalance occurs when there’s a noticeable gap between the bodies of two consecutive candlesticks, with no overlap between them. While the wicks of the candles might intersect, the candle bodies remain entirely separate. This phenomenon often signifies that the algorithm driving market activity did not evenly distribute prices between these two levels, leaving behind a small Volume Imbalance (VI).
A Bullish Volume Imbalance forms when the body of a green candlestick gaps above the previous candle’s body, with no overlap, indicating strong upward momentum and insufficient sell-side liquidity.
A Bearish Volume Imbalance forms when the body of a red candlestick gaps below the previous candle’s body, with no overlap, signaling intense downward pressure and a lack of buy-side liquidity.
This indicator can automatically identify volume imbalances by scanning candlestick patterns and detecting gaps between consecutive candle bodies. These volume imbalances act as price magnets, often attracting the market back to fill the gap before resuming its original direction. Recognizing and leveraging these gaps can be a powerful tool in technical analysis for predicting price movements.
📦 Features
MTF
Mitigation
Consequent Encroachment
Threshold
Hide Overlap
Advanced Styling
⚙️ Settings
Show: Controls whether VIs are displayed on the chart.
Show Last: Sets the number of VIs you want to display.
Length: Determines the length of each VI.
Mitigation: Highlights when a VI has been touched, using a different color without marking it as invalid.
Timeframe: Specifies the timeframe used to detect VIs.
Threshold: Sets the minimum gap size required for VI detection on the chart.
Show Mid-Line: Configures the midpoint line's width and style within the VI. (Consequent Encroachment - CE)
Show Border: Defines the border width and line style of the VI.
Hide Overlap: Removes overlapping VIs from view.
Extend: Extends the VI length to the current candle.
Elongate: Fully extends the VI length to the right side of the chart.
⚡️ Showcase
Simple
Mitigated
Bordered
Consequent Encroachment
Extended
🚨 Alerts
This script provides alert options for all signals.
Bearish Signal
A bearish alert triggers when a red candlestick gaps below the previous body, signaling downward pressure.
Bullish Signal
A bullish alert triggers when a green candlestick gaps above the previous body, indicating upward momentum.
⚠️ Disclaimer
Trading involves significant risk, and many participants may incur losses. The content on this site is not intended as financial advice and should not be interpreted as such. Decisions to buy, sell, hold, or trade securities, commodities, or other financial instruments carry inherent risks and are best made with guidance from qualified financial professionals. Past performance is not indicative of future results.

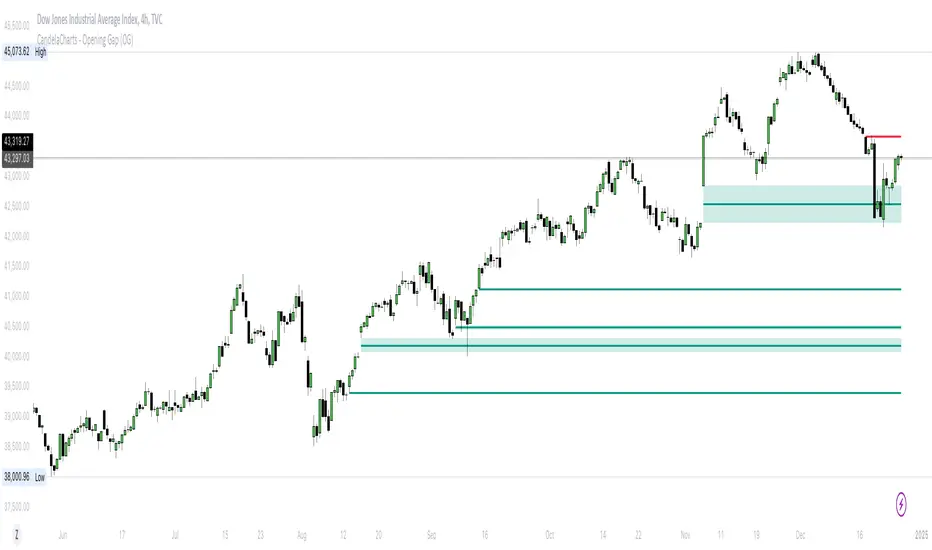
CandelaCharts - Opening Gap (OG) 📝 Overview
The ICT (Inner Circle Trader) Opening Gap represents the price difference between the previous trading session's closing price and the current session's opening price. This gap serves as a key indicator of market sentiment and can offer valuable clues about the market's potential direction throughout the trading day.
A bullish Opening Gap forms when the market opens higher than the previous session's close, signaling strong buying interest or positive sentiment heading into the new session
A bearish Opening Gap occurs when the market opens lower than the previous session's close, reflecting heightened selling pressure or negative sentiment among market participants
The Opening Gap is significant as it often establishes the market's tone for the trading session. Accurately interpreting this gap enables traders to make informed decisions about when to enter or exit positions. Serving as a gauge of market strength or weakness, the gap provides a clear signal of whether the market is likely to trend upward or downward during the day.
📦 Features
MTF
Mitigation
Consequent Encroachment
Threshold
Hide Overlap
Advanced Styling
⚙️ Settings
Show: Controls whether OGs are displayed on the chart.
Show Last: Sets the number of OGs you want to display.
Length: Determines the length of each OG.
Mitigation: Highlights when an OG has been touched, using a different color without marking it as invalid.
Timeframe: Specifies the timeframe used to detect OGs.
Threshold: Sets the minimum gap size required for OG detection on the chart.
Show Mid-Line: Configures the midpoint line's width and style within the OG. (Consequent Encroachment - CE)
Show Border: Defines the border width and line style of the OG.
Hide Overlap: Removes overlapping OGs from view.
Extend: Extends the OG length to the current candle.
Elongate: Fully extends the OG length to the right side of the chart.
⚡️ Showcase
Simple
Mitigated
Bordered
Consequent Encroachment
Extended
🚨 Alerts
This script provides alert options for all signals.
Bearish Signal
A bearish signal is triggered when the price opens lower than the previous session's close.
Bullish Signal
A bullish signal is triggered when the price opens higher than the previous session's close.
⚠️ Disclaimer
Trading involves significant risk, and many participants may incur losses. The content on this site is not intended as financial advice and should not be interpreted as such. Decisions to buy, sell, hold, or trade securities, commodities, or other financial instruments carry inherent risks and are best made with guidance from qualified financial professionals. Past performance is not indicative of future results.
CandelaCharts - Inversion Fair Value Gap (IFVG) 📝 Overview
An ICT Inversion Fair Value Gap, often called an Inverse FVG, occurs when a Fair Value Gap (FVG) fails to maintain price support or resistance, resulting in a price breach beyond the FVG. This phenomenon highlights an initial shift in price momentum, signaling potential reversals or retracements.
A Bullish IFVG forms when the price breaks above a bearish fair value gap, signaling a potential shift to bullish momentum.
A Bearish IFVG forms when the price breaks below a bullish fair value gap, signaling a potential shift to bearish momentum.
The IFVG Indicator is a powerful tool designed to automatically detect Inversion Fair Value Gaps (IFVGs) on your charts. It highlights key zones where price breaches fair value gaps, signaling potential momentum shifts or trend reversals. Whether you're tracking bullish or bearish IFVGs, this indicator provides clear visual cues, helping you make informed trading decisions with precision and confidence. Perfect for traders seeking to anticipate market structure changes effortlessly.
📦 Features
MTF
Mitigation
Consequent Encroachment
Threshold
Hide Overlap
Advanced Styling
⚙️ Settings
Show: Controls whether FVGs are displayed on the chart.
Show Last: Sets the number of FVGs you want to display.
Length: Determines the length of each IFVG.
Mitigation: Highlights when an IFVG has been touched, using a different color without marking it as invalid.
Timeframe: Specifies the timeframe used to detect IFVGs.
Threshold: Sets the minimum gap size required for IFVG detection on the chart.
Show Mid-Line: Configures the midpoint line's width and style within the IFVG. (Consequent Encroachment - CE)
Show Border: Defines the border width and line style of the IFVG.
Hide Overlap: Removes overlapping IFVGs from view.
Extend: Extends the IFVG length to the current candle.
Elongate: Fully extends the IFVG length to the right side of the chart.
⚡️ Showcase
Simple
Mitigated
Bordered
Consequent Encroachment
Extended
🚨 Alerts
This script provides alert options for all signals.
Bearish Signal
A bearish signal is invalidated if the price re-enters a bearish inversion zone but fails to reverse downward.
Bullish Signal
A bullish signal is invalidated if the price re-enters a bullish inversion zone but fails to reverse upward.
⚠️ Disclaimer
Trading involves significant risk, and many participants may incur losses. The content on this site is not intended as financial advice and should not be interpreted as such. Decisions to buy, sell, hold, or trade securities, commodities, or other financial instruments carry inherent risks and are best made with guidance from qualified financial professionals. Past performance is not indicative of future results.

CandelaCharts - Fair Value Gap (FVG) 📝 Overview
A Fair Value Gap is a three-candle pattern where an unfilled area exists between the high of the first candle and the low of the third candle. This Fair Value Gap represents a price imbalance and often serves as a level of support or resistance on the price chart.
A Bullish FVG occurs when the high of the first candle is below the low of the third candle, creating a gap in price between them.
A Bearish FVG happens when the low of the first candle is above the high of the third candle, also resulting in a price gap.
The indicator is designed to allow traders to precisely and accurately identify Fair Value Gaps (FVGs) across any chosen time frame. Automatically detecting these price imbalances, highlights potential areas where prices may retrace, providing valuable insights into market support and resistance levels. This capability enables traders to make informed decisions based on the presence of FVGs, enhancing their strategies for entry and exit points across different market conditions and time frames.
📦 Features
MTF
Mitigation
Consequent Encroachment
Threshold
Hide Overlap
Advanced Styling
⚙️ Settings
Show: Controls whether FVGs are displayed on the chart.
Show Last: Sets the number of FVGs you want to display.
Length: Determines the length of each FVG.
Mitigation: Highlights when an FVG has been touched, using a different color without marking it as invalid.
Timeframe: Specifies the timeframe used to detect FVGs.
Threshold: Sets the minimum gap size required for FVG detection on the chart.
Show Mid-Line: Configures the midpoint line's width and style within the FVG. (Consequent Encroachment - CE)
Show Border: Defines the border width and line style of the FVG.
Hide Overlap: Removes overlapping FVGs from view.
Extend: Extends the FVG length to the current candle.
Elongate: Fully extends the FVG length to the right side of the chart.
⚡️ Showcase
Simple
Mitigated
Bordered
Consequent Encroachment
Extended
🚨 Alerts
This script provides alert options for all signals.
Bearish Signal
A bearish signal is triggered when the price moves back into a bearish inversion zone and then reverses downward.
Bullish Signal
A bullish signal is triggered when the price returns to a bullish inversion zone and then breaks upward out of the top.
⚠️ Disclaimer
Trading involves significant risk, and many participants may incur losses. The content on this site is not intended as financial advice and should not be interpreted as such. Decisions to buy, sell, hold, or trade securities, commodities, or other financial instruments carry inherent risks and are best made with guidance from qualified financial professionals. Past performance is not indicative of future results.

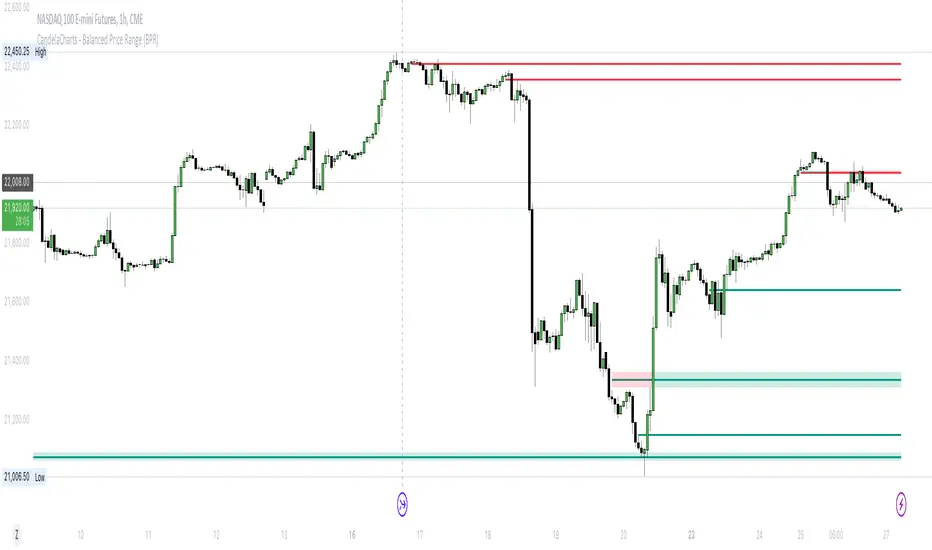
CandelaCharts - Balanced Price Range (BPR) 📝 Overview
ICT Balanced Price Range (BPR) is the area on the price chart where two opposite Fair Value Gaps overlap.
To identify a Balanced Price Range (BPR), mark a fair value gap (FVG) on the sell side of the price and another on the buy side. These FVGs should be directly opposite each other horizontally. The overlapping area between the two is the Balanced Price Range.
The significance of the ICT Balanced Price Range lies in its sensitivity to price movements. When the market approaches a BPR, it often triggers a rapid and notable price reaction.
This reaction occurs because the two opposing FVGs attract the attention of smart money traders—those with substantial capital capable of influencing market trends. As a key concept in the Inner Circle Trader (ICT) methodology, the BPR serves as an ideal entry point, frequently driving considerable market activity.
📦 Features
MTF
Mitigation
Consequent Encroachment (CE)
Threshold
Hide Overlap
Advanced Styling
⚙️ Settings
Show: Controls whether BPRs are displayed on the chart.
Show Last: Sets the number of BPRs you want to display.
Length: Determines the length of each BPR.
Mitigation: Highlights when an BPR has been touched, using a different color without marking it as invalid.
Timeframe: Specifies the timeframe used to detect BPRs.
Threshold: Sets the minimum gap size required for BPR detection on the chart.
Show Mid-Line: Configures the midpoint line's width and style within the BPR. (Consequent Encroachment - CE)
Show Border: Defines the border width and line style of the BPR.
Hide Overlap: Removes overlapping BPRs from view.
Extend: Extends the BPR length to the current candle.
Elongate: Fully extends the BPR length to the right side of the chart.
⚡️ Showcase
Simple
Mitigated
Bordered
Consequent Encroachment
Extended
🚨 Alerts
This script offers alert options for all signal types.
Bearish Signal
A bearish signal is generated when the price re-enters a bearish inversion zone and then reverses downward.
Bullish Signal
A bullish signal is generated when the price revisits a bullish inversion zone and then breaks upward through the top.
⚠️ Disclaimer
Trading involves significant risk, and many participants may incur losses. The content on this site is not intended as financial advice and should not be interpreted as such. Decisions to buy, sell, hold, or trade securities, commodities, or other financial instruments carry inherent risks and are best made with guidance from qualified financial professionals. Past performance is not indicative of future results.
Turtle Soup ICT Strategy [TradingFinder] FVG + CHoCH/CSD🔵 Introduction
The ICT Turtle Soup trading setup, designed in the ICT style, operates by hunting or sweeping liquidity zones to exploit false breakouts and failed breakouts in key liquidity Zones, such as recent highs, lows, or major support and resistance levels.
This setup identifies moments when the price breaches these liquidity zones, triggering stop orders placed (Stop Hunt) by other traders, and then quickly reverses direction. These movements are often associated with liquidity sweeps that create temporary market imbalances.
The reversal is typically confirmed by one of three structural shifts : a Market Structure Shift (MSS), a Change of Character (CHoCH), or a break of the Change in State of Delivery (CISD). Each of these structural shifts provides a reliable signal to interpret market intent and align trading decisions with the expected price movement. After the structural shift, the price frequently pullback to a Fair Value Gap (FVG), offering a precise entry point for trades.
By integrating key concepts such as liquidity, liquidity sweeps, stop order activation, structural shifts (MSS, CHoCH, CISD), and price imbalances, the ICT Turtle Soup setup enables traders to identify reversal points and key entry zones with high accuracy.
This strategy is highly versatile, making it applicable across markets such as forex, stocks, cryptocurrencies, and futures. It offers traders a robust and systematic approach to understanding price movements and optimizing their trading strategies
🟣 Bullish and Bearish Setups
Bullish Setup : The price first sweeps below a Sell-Side Liquidity (SSL) zone, then reverses upward after forming an MSS or CHoCH, and finally pulls back to an FVG, creating a buying opportunity.
Bearish Setup : The price first sweeps above a Buy-Side Liquidity (BSL) zone, then reverses downward after forming an MSS or CHoCH, and finally pulls back to an FVG, creating a selling opportunity.
🔵 How to Use
To effectively utilize the ICT Turtle Soup trading setup, begin by identifying key liquidity zones, such as recent highs, lows, or support and resistance levels, in higher timeframes.
Then, monitor lower timeframes for a Liquidity Sweep and confirmation of a Market Structure Shift (MSS) or Change of Character (CHoCH).
After the structural shift, the price typically pulls back to an FVG, offering an optimal trade entry point. Below, the bullish and bearish setups are explained in detail.
🟣 Bullish Turtle Soup Setup
Identify Sell-Side Liquidity (SSL) : In a higher timeframe (e.g., 1-hour or 4-hour), identify recent price lows or support levels that serve as SSL zones, typically the location of stop-loss orders for traders.
Observe a Liquidity Sweep : On a lower timeframe (e.g., 15-minute or 30-minute), the price must move below one of these liquidity zones and then reverse. This movement indicates a liquidity sweep.
Confirm Market Structure Shift : After the price reversal, look for a structural shift (MSS or CHoCH) indicated by the formation of a Higher Low (HL) and Higher High (HH).
Enter the Trade : Once the structural shift is confirmed, the price typically pulls back to an FVG. Enter a buy trade in this zone, set a stop-loss slightly below the recent low, and target Buy-Side Liquidity (BSL) in the higher timeframe for profit.
🟣 Bearish Turtle Soup Setup
Identify Buy-Side Liquidity (BSL) : In a higher timeframe, identify recent price highs or resistance levels that serve as BSL zones, typically the location of stop-loss orders for traders.
Observe a Liquidity Sweep : On a lower timeframe, the price must move above one of these liquidity zones and then reverse. This movement indicates a liquidity sweep.
Confirm Market Structure Shift : After the price reversal, look for a structural shift (MSS or CHoCH) indicated by the formation of a Lower High (LH) and Lower Low (LL).
Enter the Trade : Once the structural shift is confirmed, the price typically pulls back to an FVG. Enter a sell trade in this zone, set a stop-loss slightly above the recent high, and target Sell-Side Liquidity (SSL) in the higher timeframe for profit.
🔵 Settings
Higher TimeFrame Levels : This setting allows you to specify the higher timeframe (e.g., 1-hour, 4-hour, or daily) for identifying key liquidity zones.
Swing period : You can set the swing detection period.
Max Swing Back Method : It is in two modes "All" and "Custom". If it is in "All" mode, it will check all swings, and if it is in "Custom" mode, it will check the swings to the extent you determine.
Max Swing Back : You can set the number of swings that will go back for checking.
FVG Length : Default is 120 Bar.
MSS Length : Default is 80 Bar.
FVG Filter : This refines the number of identified FVG areas based on a specified algorithm to focus on higher quality signals and reduce noise.
Types of FVG filter s:
Very Aggressive Filter: Adds a condition where, for an upward FVG, the last candle's highest price must exceed the middle candle's highest price, and for a downward FVG, the last candle's lowest price must be lower than the middle candle's lowest price. This minimally filters out FVGs.
Aggressive Filter: Builds on the Very Aggressive mode by ensuring the middle candle is not too small, filtering out more FVGs.
Defensive Filter: Adds criteria regarding the size and structure of the middle candle, requiring it to have a substantial body and specific polarity conditions, filtering out a significant number of FVGs.
Very Defensive Filter: Further refines filtering by ensuring the first and third candles are not small-bodied doji candles, retaining only the highest quality signals.
In the indicator settings, you can customize the visibility of various elements, including MSS, FVG, and HTF Levels. Additionally, the color of each element can be adjusted to match your preferences. This feature allows traders to tailor the chart display to their specific needs, enhancing focus on the key data relevant to their strategy.
🔵 Conclusion
The ICT Turtle Soup trading setup is a powerful tool in the ICT style, enabling traders to exploit false breakouts in key liquidity zones. By combining concepts of liquidity, liquidity sweeps, market structure shifts (MSS and CHoCH), and pullbacks to FVG, this setup helps traders identify precise reversal points and execute trades with reduced risk and increased accuracy.
With applications across various markets, including forex, stocks, crypto, and futures, and its customizable indicator settings, the ICT Turtle Soup setup is ideal for both beginner and advanced traders. By accurately identifying liquidity zones in higher timeframes and confirming structure shifts in lower timeframes, this setup provides a reliable strategy for navigating volatile market conditions.
Ultimately, success with this setup requires consistent practice, precise market analysis, and proper risk management, empowering traders to make smarter decisions and achieve their trading goals.

Hidden SMT Divergence ICT 01 [TradingFinder] HSMT SMC Technique🔵 Introduction
Hidden SMT Divergence, an advanced concept within the Smart Money Technique (SMT), identifies discrepancies between correlated assets by focusing on their closing prices.
Unlike the standard SMT Divergence, which uses high and low prices for analysis, Hidden SMT Divergence uncovers subtle signals by examining divergences based on the assets' closing values.
These divergences often highlight potential reversals or trend continuations, making this technique a valuable tool for traders aiming to anticipate market movements.
This approach applies across various markets and asset classes, including :
Commodities : CAPITALCOM:GOLD vs. CAPITALCOM:SILVER or BLACKBULL:BRENT vs. BLACKBULL:WTI .
Indices : NASDAQ:NDX vs. TVC:SPX vs. FX:US30 .
FOREX : FX:EURUSD vs. OANDA:GBPUSD vs. TVC:DXY (US Dollar Index).
Cryptocurrencies : BITSTAMP:BTCUSD vs. COINBASE:ETHUSD vs. KUCOIN:SOLUSDT vs. CRYPTOCAP:TOTAL3 .
Volatility Measures : FOREXCOM:XAUUSD vs. TVC:VIX (Volatility Index).
By identifying divergences within these asset groups, traders can gain actionable insights into potential market reversals or shifts in trend direction. Hidden SMT Divergence is particularly effective for pinpointing subtle market signals that traditional methods may overlook.
Bullish Hidden SMT Divergence : This divergence emerges when one asset forms a higher low, while the correlated asset creates a lower low in terms of their closing prices. It often signals weakening downward momentum and a potential reversal to the upside.
Bearish Hidden SMT Divergence : This occurs when one asset establishes a higher high, while the correlated asset forms a lower high based on their closing prices. It typically reflects declining upward momentum and a probable shift to the downside.
🔵 How to Use
The Hidden SMT Divergence indicator provides traders with a systematic approach to identify market reversals or trend continuations through divergences in closing prices between two correlated assets.
🟣 Bullish Hidden SMT Divergence
Bullish Hidden SMT Divergence occurs when the closing price of the primary asset forms a higher low, while the correlated asset creates a lower low. This pattern indicates weakening downward momentum and signals a potential reversal to the upside.
After identifying the divergence, confirm it using additional tools like support levels, volume trends, or indicators such as RSI and MACD. Enter a buy position as the price shows signs of reversal near support zones, ensuring proper risk management by placing a stop-loss below the support level.
Bearish Hidden SMT Divergence
Bearish Hidden SMT Divergence is identified when the closing price of the primary asset forms a higher high, while the correlated asset creates a lower high. This divergence suggests a weakening uptrend and a likely reversal to the downside.
Validate the signal by examining resistance levels, declining volume, or complementary indicators. Consider entering a sell position as the price starts declining from resistance levels, and set a stop-loss above the resistance zone to limit potential losses.
🔵 Setting
Second Symbol : Select the secondary asset to compare with the primary asset. By default, "XAUUSD" (Gold) is used, but it can be customized to any stock, cryptocurrency, or currency pair.
Divergence Fractal Periods : Defines the number of past candles considered for identifying divergences. The default value is 2, but traders can adjust it for greater precision.
Bullish Divergence Line : Displays a dashed line connecting the points of bullish divergence.
Bearish Divergence Line : Shows a similar line for bearish divergence points.
Bullish Divergence Label : Marks areas of bullish divergence with a "+SMT" label.
Bearish Divergence Label : Highlights bearish divergences with a "-SMT" label.
Chart Type : Choose between Line or Candle charts for enhanced visualization.
🔵 Conclusion
Hidden SMT Divergence offers traders a refined method for identifying market reversals by analyzing closing price discrepancies between correlated assets. Its ability to uncover subtle divergences makes it an essential tool for traders who aim to stay ahead of market trends.
By integrating this technique with other technical analysis tools and sound risk management, traders can enhance their decision-making process and capitalize on market opportunities with greater confidence.
Hidden SMT Divergence’s focus on closing prices ensures more precise signals, helping traders refine their strategies across various markets, including Forex, commodities, indices, and cryptocurrencies.
Its open-source nature allows for customization and verification, providing transparency and flexibility to suit diverse trading needs. Hidden SMT Divergence stands as a powerful addition to the arsenal of any trader seeking to unlock hidden opportunities in dynamic financial markets.

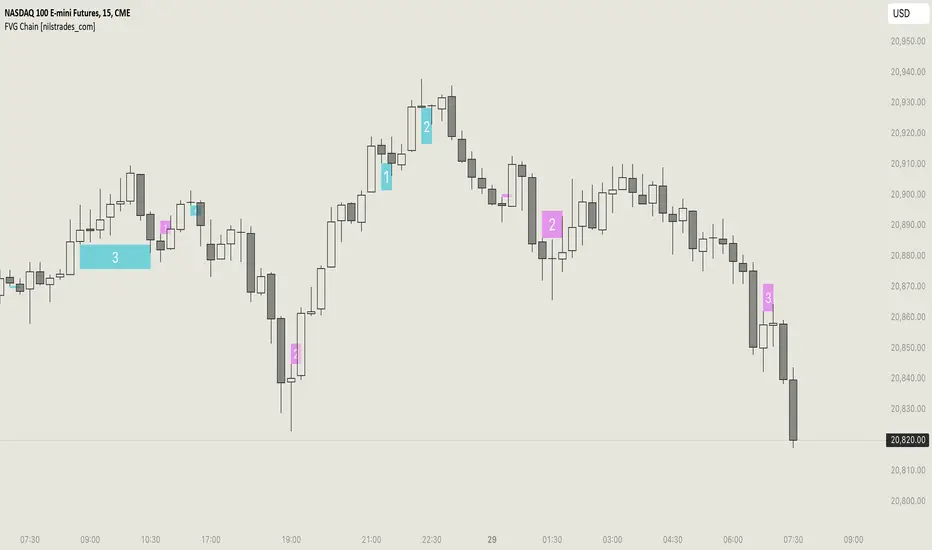
FVG Chain (Consecutive Fair Value Gaps / Imbalances)This indicator detects fair value gaps that are created out of the touch of older fair value gaps, hence creating an "FVG chain".
It counts +1 for the chain whenever a new price leg's FVG is touched.
You can use the current FVG Chain count, as well as the high, low, and price leg high/low of the current FVG as input source in external indicators. Check the data window to see the plot values.
How FVGs are detected:
Bullish: The low of the current confirmed bar is above the high of 2 bars back.
Bearish: The high of the current confirmed bar is below the low of 2 bars back.
A bullish FVG chain is broken if:
The current FVG's price leg low is broken.
The previous bar closed below the FVG, and the current confirmed bar closed below the previous bar.
A bearish FVG chain is broken if:
The current FVG's price leg high is broken.
The previous bar closed above the FVG, and the current confirmed bar closed above the previous bar.
ICTProTools | ICT Insight - Market Environment🚀 INTRODUCTION
The Market Environment Indicator provides traders with an essential contextual framework for analyzing price movements. Built on the principles of ICT (Inner Circle Trader) and Smart Money Concepts (SMC), this tool offers a structured view of how institutional players drive markets through liquidity manipulation and price level interactions. By defining the market environment, the indicator helps traders focus on the most relevant price zones, reducing distractions and enhancing decision-making.
At its core, the Interbank Dealing Range (IBDR) creates a clear structure of protected highs/lows and Premium/Discount zones , highlighting key areas for potential price reactions. This framework gives traders a lens to interpret market behavior and concentrate on meaningful liquidity zones and price action. The indicator helps traders navigate the market with precision, spotting significant opportunities while filtering out market noise. Indeed, the IBDR isn't always easily identifiable, and not every move will form a distinct dealing range.
This indicator goes beyond mere price levels… It reveals the larger market context in which prices evolve. By mastering this environment, traders can align their strategies with institutional logic and make well-informed decisions.
💎 FEATURES
The Interbank Dealing Range (IBDR) is a crucial concept within the ICT methodology that helps traders identify the market environment across multiple timeframes, specifically the premium and discount zones. The IBDR delineates areas where traders have the potential to buy low and sell high.
Its extremes are defined by the sweep of both buy-side and sell-side liquidity . These levels indicate the boundaries within which price is expected to evolve . Understanding these boundaries allows traders to determine where it is appropriate to enter or exit trades.
The primary goal of utilizing the IBDR is to capitalize on price movements by buying at discounted levels and selling at premium levels. This strategy aligns with the fundamental principle of trading: to buy at lower prices and sell at higher prices, maximizing profit potential.
By visualizing the IBDR on your charts, you can gain valuable insights into the prevailing market conditions and make informed trading decisions that align with the institutional approach to buying and selling.
This chart illustrates the Interbank Dealing Range (IBDR) applied to the US100 index, displaying two from different timeframes: a 1-hour (1h) IBDR on the left and a 30-minute (30m) IBDR on the right. This multi-timeframe view provides essential context for price action analysis.
The 1h IBDR could here function as the primary reference range, establishing key boundaries (High and Low) for price movement. Within this range, the Equilibrium (midpoint) separates the Premium zone (above) from the Discount zone (below). The 0.25 and 0.75 levels add further precision by subdividing these zones.
Price action then flows between these zones, creating and targeting liquidity at higher and lower levels through Relative Equal Highs and Lows. A strong upward movement into the deeper level of the Premium Zone captures high-side liquidity (with a notable reaction at the FVG on the left), forming a secondary 30m IBDR. After this liquidity sweep, the remaining liquidity is on the low side. Price then reverses downward toward it. Here, the 30m IBDR would suggest a confirmation for a potential sell entry by targeting the IBDR lows.
The relationship between the broader 1h IBDR, the more detailed 30m IBDR, and all related levels creates a powerful analytical framework. The larger timeframe provides context, while the smaller one reveals specific trading opportunities by providing entry confirmations.
✨ SETTINGS
IBDR Metrics: Adjust the timeframe and sensitivity for calculating the IBDR so traders can adapt the indicator to both short-term intraday movements and longer-term trends.
Premium/Discount Zones: Customize the levels such as 0, 0.5, 1, and other levels like 0.25 and 0.75 by default and their displayed colors and associated labels.
Alerts: Configure the alerts for Premium/Discount zones, High/Low breaks, and new IBDR, ensuring traders are kept up to date on key market events.
🎯 CONCLUSION
The Market Environment indicator serves as a powerful tool for analyzing and navigating market structure through liquidity zones. It helps identify optimal buy and sell areas while aligning with the institutional logic of major market players. While its features provide a valuable edge, it’s essential to remember that none should be used on its own, and many more factors go into being a profitable trader.

ICTProTools | ICT Insight - Momentum Structures🚀 INTRODUCTION
The Momentum Structures Indicator builds upon the principles of ICT (Inner Circle Trader) and Smart Money Concepts (SMC) to give traders a clearer view of market dynamics. These methods reveal how institutional trading activity shapes price movements, particularly through different types of market liquidity.
The indicator is designed to provide traders with advanced insights into market dynamics by focusing on key price imbalances and higher-timeframe structures . By combining these elements, the indicator allows users to analyze price behavior across multiple timeframes, helping them anticipate potential liquidity pools and price reversals. The emphasis on price imbalances and liquidity zones makes it a versatile tool for both intraday and longer-term strategies, providing critical insights for understanding market cycles and potential turning points.
💎 FEATURES
Imbalance Bar Colors / Zones
Imbalances are fundamental components of the ICT methodology, highlighting areas where price accelerates, creating gaps that may indicate a lack of liquidity . These voids often point to potential reversal or continuation zones in the price action.
An imbalance typically arises when supply and demand are out of balance, resulting in a gap between price levels. Traders keep a close eye on these gaps, as they could present opportunities to enter trades when the price revisits them , as they suggest a strong institutional interest.
We can notice two types of imbalances… A Fair Value Gap (FVG) usually forms from three consecutive candles, defining the space between the wicks of the first and last candle. Conversely, a Volume Imbalance (VI) occurs when a gap appears between the opening and closing prices of two consecutive candles. When these imbalances align with FVGs, they offer a well-rounded framework for assessing market strength.
By analyzing both FVGs and VIs together, traders can gain valuable insight into potential price movements and better evaluate the likelihood of continuation or reversal.
This chart illustrates the Fair Value Gaps (FVG) and Volume Imbalances (VI) within the GBPUSD price action. The FVG Bar Color and FVG Zone represent the same Fair Value Gaps, and similarly, the VI Bar Color and VI Zone display the same Volume Imbalances. They highlight areas where rapid price movements have created gaps in the market. These gaps indicate potential zones for trade entries or exits as the price may return to fill them. As we can see on the chart, the major part of imbalances created has already been filled. They constitute really interesting Point of Interest (POI).
The 50% FVG line marks the midpoint of the gap, which is often considered an important level for price action. A clear example appears in the Bearish FVG on the top left, where price first filled it below the midline, creating a small reaction. The price then liquidated this "fake mitigation" by moving just above the midline before beginning its significant downward movement. This demonstrates the crucial role of imbalances and how precisely price interacts with them.
Traders can use this information to identify potential buying or selling opportunities based on the interaction of price with these gaps and volume imbalances, aiding in the development of their trading strategies.
PO3 Candles (Power of Three)
The Power of Three is a critical concept in the ICT methodology that analyzes Higher Timeframe (HTF) candles focusing on the opening price, high wick, low wick, and closing price. This framework helps traders understand the current market cycle, in three phases , and its trading implications.
Accumulation Phase: In this initial phase, the price consolidates around the opening price as the market gathers liquidity. This often signals that larger players are positioning for the next move.
Manipulation Phase: Represented by the candle wicks, this phase indicates the extreme points where liquidity grabs often occur. Observing these wicks helps traders identify the end of the accumulation phase and potential turning points.
Distribution Phase: The candle body reflects a decisive price movement in one direction , following accumulation and manipulation. Traders align with the direction of this phase to capture the “real candle move”.
Our indicator provides you with the valuable capability to integrate the True Day Range, as defined by ICT. This concept, rooted in institutional logic, defines a trading day as starting at 00:00 New York time. You can customize it to match your trading style and analysis needs.
You can also overlay imbalances (FVG and VI) directly onto PO3 Candles, seamlessly combining imbalance detection with high-timeframe price action. This approach gives you a sharper market perspective, uncovering potential turning points with greater clarity.
In summary, PO3 Candles help traders assess the market structure and identify cycle positions on HTF candles, enabling them to make more strategic trading decisions, which allows for better entry and exit timing, avoiding traps, and seizing the best opportunities to capture significant market moves.
This chart illustrates the application of the Power of Three concept to EURUSD price action, highlighting key phases of market behavior.
In this example, we observe the Daily candles, where a significant Bullish imbalance appears from previous days, forming a Fair Value Gap (FVG). Additionally, there’s a small Volume Imbalance (VI) at the candle's opening, signaling liquidity that the price needs to fill.
Now, focusing on the Weekly candle, we can clearly identify its phases. First, there's an accumulation phase around the opening price, which, as shown by the Daily candles, took some time to develop. Then, the manipulation phase occurs, signaled by the upper wick of the Weekly candle, which liquidates the previously created accumulation. It’s time to look for a potential selling position... Finally, the price falls, beginning to form its bearish body and completing the real move of the week.
This framework allows traders to better understand the market structure and make informed decisions based on the current cycle.
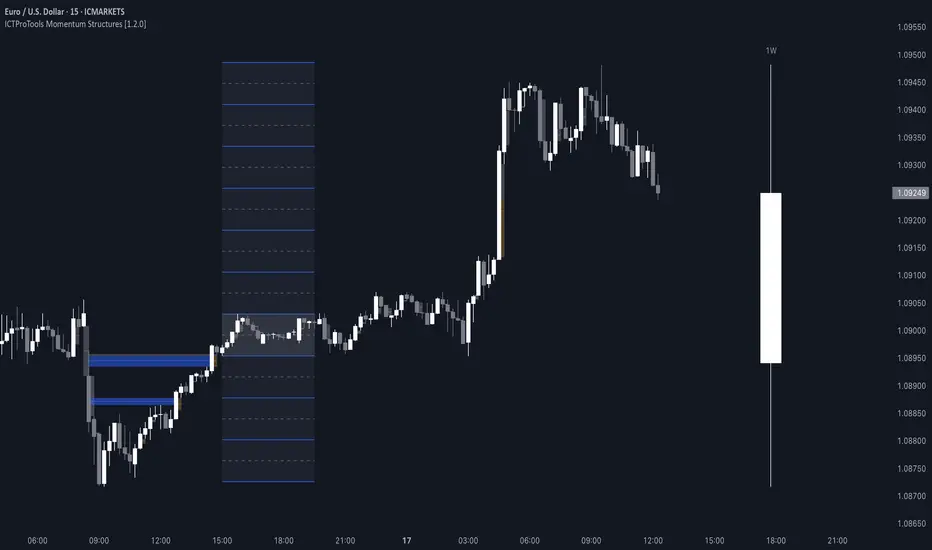
Standard Deviation (STD)
The Standard Deviation (STD) is a concept within the ICT methodology that focuses on identifying periods of consolidation within the market. Specifically, it examines the Central Bank Dealers Range (CBDR) , which occurs between 13:00 and 23:00 New York time. During this period, the market often exhibits consolidation , creating an environment where price action stabilizes before making significant moves.
This consolidation forms the basis of the Standard Deviation (STD) concept. This is based on the idea that the volatility observed during this consolidation phase can be used to anticipate future market volatility. Once this consolidation is identified, the STD framework duplicates the established range both above and below the consolidation area.
As price approaches these duplicated levels, it offers traders critical information on where to anticipate potential reactions. If the price nears the upper boundary of the consolidation, it suggests a potential reversal point, indicating an opportunity to consider selling. Conversely, if the price approaches the lower boundary, it may signal an opportunity to look for buying positions . This duplication could enable traders to determine potential high and low points for the trading day or week for example.
Finally, the Standard Deviation (STD) concept provides a valuable framework for identifying potential key reaction points in the market by leveraging consolidation within the CBDR. By duplicating these ranges, traders can anticipate significant price movements and refine their strategies.
This chart illustrates the Standard Deviation (STD) concept applied to EURUSD price action. The highlighted areas in blue indicate high duplications and low duplications derived from the consolidation identified during the Central Bank Dealing Range (CBDR), marked by the dark gray rectangle.
The high duplications represent potential resistance levels, suggesting areas where the price may encounter selling pressure, while the low duplications signify potential support levels, indicating where buying interest could emerge.
The annotations emphasize how price reacts at these duplicated levels, showing the critical role of the STD in determining where price movements may stall or reverse. In this example, the price responded perfectly to both an upward and a downward duplication, confirming that these levels could represent the day's high and low, an observation validated here. This highlights the precision of price movements, with the price stopping exactly at the full duplication levels (but we can not that the price could also have paused at the midline levels, indicated by the dashed gray lines).
This visualization helps traders anticipate potential reactions and align their strategies with market dynamics, ensuring informed decision-making based on established price behavior.
✨ SETTINGS
Imbalance Bar Colors / Zones: Choose to display FVGs, VIs, or both, with customizable color settings. Choose to extend zones or set them to be removed when mitigated.
PO3 Candles: Customize the PO3 Candles for different timeframes (Daily, Weekly, Monthly), including the calculation Mode (Classic or True Day Range) and timezone associated, and set your body, border, and wick preferred colors. The Imbalance Bar Color and FVG Zones can also be displayed on these HTF candles, as they are configured in their settings.
STD: Select the timeframe on which to base it and configure the number of duplications and midline settings. You can also define the time range and timezone related to consolidation detection, giving you control over when and where the STD should apply.
🎯 CONCLUSION
The Momentum Structures Indicator combines the core principles of ICT and Smart Money Concepts to provide traders with advanced tools for understanding market dynamics. By focusing on key elements like imbalances and liquidity zones, it offers a comprehensive framework for analyzing price behavior. This indicator empowers traders to identify key market phases, anticipate potential reversals, and refine their entry and exit points with precision. While its features provide a valuable edge, it’s essential to remember that none should be used on its own and many more factors go into being a profitable trader.
ICTProTools | ICT Insight - Time & Price Zones🚀 INTRODUCTION
The Time and Price Zones indicator builds upon the foundational concepts of ICT (Inner Circle Trader) and Smart Money Concepts (SMC). These methodologies analyze the behavior of institutional traders (known as "smart money") by focusing on liquidity, key price levels, and market timing.
Liquidity refers to areas with high concentrations of pending orders (stops, take-profits, entries) in the market. Large institutions efficiently need to execute their massive orders without causing excessive slippage. To achieve this, they strategically create and exploit liquidity pools by driving the price toward areas where retail traders cluster their positions.
Then, through "liquidity grabs" or "stop hunts,” institutions accumulate or distribute positions at optimal prices . This strategy allows them to fill large orders with minimal market impact, typically clearing out retail traders' positions before the price reverses.
This indicator helps traders apply these principles by merging time-based and price-based analysis tools for better market understanding. By combining high-impact sessions like Kill Zones with pivotal price markers such as Previous Highs and Lows, traders can see where institutional activity intersects with liquidity pools, improving their decision-making.
This powerful combination allows users to monitor market dynamics in real time, helping them spot sentiment shifts and identify crucial turning points more effectively.
💎 FEATURES
Kill Zones
Kill Zones are critical periods of the trading day characterized by heightened institutional activity, resulting in increased liquidity and significant price movements. By recognizing these zones, you can strategically focus your efforts on the most advantageous moments for trading.
The Asian Session , which runs from 5 PM to 1 AM New York time, serves as an essential liquidity provider before the onset of more volatile trading periods. This session is intricately linked to the Smart Money Tool (SMT - See below), as the highs and lows established during this period provide foundational liquidity levels. You can set alerts when these levels are breached , allowing you to stay informed without constant chart monitoring and make timely trading decisions.
Transitioning into the London Kill Zone from 2 to 5 AM New York time marks the beginning of the European session, often associated with increased volatility. Following this, the New York Kill Zone , occurring from 7 to 10 AM , sees significant overlap between the London and New York sessions, where liquidity flows intensify and frequently correlate with notable price reversals. Finally, the London Close from 10 to 12 PM signifies the end of the European session, often ending the day with a retracement in the daily range.
Thanks to the timezone you can select relative to a region, Kill Zones will automatically adapt to time changes throughout the year and between different brokers , ensuring accurate Kill Zone timings without manual adjustments.
Incorporating our advanced Kill Zones indicator into your trading strategy gives you unparalleled insights and enhanced functionality. With integrated alerts for breaches of key levels, you can stay informed and ready to act without the need for constant chart monitoring, allowing you to focus on executing your trading strategies effectively.
We can see on this chart the identified Kill Zones during the trading day on EURUSD , including the Asian Session in gray, which tends to consolidate slightly (creating liquidity), the London Kill Zone in orange, which tends to move fast, often taking Asian quickly, the New York Kill Zone in green, with always a lot of movements, and the London Close in blue, seeming rather to retrace.
The midline indicates the 50% mark of the session, serving as a reference point for potential price reactions. Additionally, the highs and lows established during the Asian Session are linked to the Smart Money Tool (SMT) and can trigger alerts when breached. Here, you could have received an alert when Asian Low (marked AL) and Asian High (marked AH) were swept.
Previous & Open Levels
Previous and Open levels are key elements in ICT methodology, showing important price points from major timeframes (Daily, Weekly, Monthly). These levels (Previous High, Low, Open, and their separators) help traders understand price dynamics and anticipate market shifts.
The Previous levels connect directly to the Smart Money Tool (SMT - See below) as they provide foundational liquidity levels. In ICT methodology, previous are levels where many traders place their Stop Loss, thus creating liquidity. This helps you understand potential market reactions and whether prices will likely continue their trend or reverse.
You’ll be instantly notified whenever the price interacts with any of these Previous levels. This means you can stay informed about critical market movements without the need to monitor your charts constantly.
The indicator also displays Opening prices and includes separators for daily, weekly, and monthly levels, offering a clear market overview.
Open levels can act as simplified indicators of Premium and Discount Zones. To be above the opening price can be considered as the Premium Zone , where the market offers higher prices, typically suitable for selling opportunities. Conversely, to be below this price can be considered as the Discount Zone , where prices are relatively lower, offering potential buying opportunities.
These visual elements help you identify crucial market zones that reflect both past price action and current market dynamics.
Our indicator offers you the exclusive ability to integrate the True Day Range, as described by ICT. Based on institutional logic, this concept defines the trading day starting at 00:00 New York time. You can adapt this flexible feature to match your trading style and analysis needs.
By incorporating our advanced Previous levels indicator into your trading arsenal, you gain powerful insights and enhanced functionality.
The chart above displays key Previous and open levels on EURUSD , including the Month, Week, and Day lines, along with separators for enhanced clarity. All levels are based on the True Day Range Mode. The notes indicate significant price points, highlighting how the price interacts with these important levels, which helps us to understand it…
We can start with the biggest liquidity, the Previous Month. In this example, we can see the PMH, and the price seems to have used this level as a reversal point. The PM levels are indeed significant liquidity zones. We can observe the creation of wicks that interact with this level, signaling a liquidity grab.
Following this, the price drops quickly before rebounding, creating a liquidity range, that will probably be liquidated then… This is why it rises again to form what is now the PDH (Previous Day High), using it as liquidity (inducement) while using the PWH (Previous Week High) as a rebound level. The PWH is indeed a High Resistance (HR) area since there is only a few liquidity at this point thanks to the liquidity grab. The price has no reason to move higher.
Looking ahead, we can forecast that the price may continue its decline, potentially targeting lower liquidity levels. There is likely additional liquidity beneath the current range, particularly near the PDL (Previous Day Low) and PWL (Previous Week Low).
Additionally, we can note that at this point, the price was above the D.O.P (Daily Open) and W.O.P (Weekly Open), areas where selling would be more favorable. The price reacts significantly around these levels, creating large wicks, demonstrating their importance.
SMT Dashboard (Smart Money Tool)
The Smart Money Tool (SMT) is a powerful concept within the ICT methodology that enables you to compare various assets based on liquidity uptake from significant price levels.
By utilizing the SMT, you can analyze any asset , whether it’s a currency pair, stock, cryptocurrency, or other financial instruments. The dashboard helps you identify the strongest and weakest assets by analyzing their interactions with critical liquidity levels and identifying divergences , including those related to the Previous Month, Previous Week, Previous Day, and Asian Session Highs and Lows. By doing so, he identifies the most bullish symbol. It will therefore tend to rise more easily, or at least fall less, than the other one.
The SMT includes alert functionality that notifies you whenever a new SMT is created or has changed , allowing you to stay informed about which asset is currently the strongest. This means you can react promptly to market changes without constantly monitoring your charts.
Additionally, since the SMT relies on the Previous levels, it is influenced by the selected mode, whether based on traditional Previous levels or the True Day Range . This flexibility ensures that you are using the most relevant information available for your trading decisions. Asian High and Asian Low levels are also calculated according to the schedules configured in the Kill Zones section.
In summary, the Smart Money Tool displays the strongest and weakest assets based on liquidity uptake, providing you with clear information on which asset to prioritize, so you can maximize your potential profits. By incorporating this concept into your approach, you align your decisions with prevailing market dynamics, offering you unparalleled insights and features tailored to enhance your trading strategy.
This chart displays the Smart Money Tool (SMT) dashboard on the GBPUSD symbol, which compares the liquidity uptake for EURUSD and GBPUSD pairs. The indicator shows that both Previous Month's and Week's High and Low were taken for both pairs. However, the Asian High (AH) has been breached on GBPUSD but not on EURUSD, while the Asian Low (AL) has been taken by EURUSD. As a result, GBPUSD is identified as the stronger asset, indicating that traders should focus on buying opportunities with GBPUSD rather than EURUSD. This analysis helps traders prioritize the best symbol for their strategies based on the most relevant liquidity divergences.
✨ SETTINGS
Kill Zones: Customize the display options for the Asian (with lines), London, New York, and London Close Kill Zones. Configure timezone options, midlines, and color preferences.
Previous & Open Levels: Adjust how Previous High/Low levels, Open and separators are displayed. Select between Classic or True Day Range Mode based on your trading preferences.
SMT: Choose the correlated assets for the SMT comparison and select which liquidity (Monthly, Weekly, Daily, Asian) to use and display. Configure settings like liquidity sweeps and strongest pair emojis.
Alerts: Configure alerts for key events such as the Asian High/Low or Previous Levels liquidity sweep, and SMT divergences.
🎯 CONCLUSION
The Time and Price Zones indicator offers a practical and insightful approach to market analysis by combining major principles of ICT and Smart Money Concepts into a cohesive tool. It empowers traders to understand key price levels, liquidity dynamics, and institutional activity with ease. By helping traders avoid being the liquidity of the market and instead align with institutional flows, the indicator can significantly enhance performances. While its features provide a valuable edge, it’s essential to remember that none should be used on its own and many more factors go into being a profitable trader.

SMT Divergence ICT 01 [TradingFinder] Smart Money Technique🔵 Introduction
SMT Divergence (short for Smart Money Technique Divergence) is a trading technique in the ICT Concepts methodology that focuses on identifying divergences between two positively correlated assets in financial markets.
These divergences occur when two assets that should move in the same direction move in opposite directions. Identifying these divergences can help traders spot potential reversal points and trend changes.
Bullish and Bearish divergences are clearly visible when an asset forms a new high or low, and the correlated asset fails to do so. This technique is applicable in markets like Forex, stocks, and cryptocurrencies, and can be used as a valid signal for deciding when to enter or exit trades.
Bullish SMT Divergence : This type of divergence occurs when one asset forms a higher low while the correlated asset forms a lower low. This divergence is typically a sign of weakness in the downtrend and can act as a signal for a trend reversal to the upside.
Bearish SMT Divergence : This type of divergence occurs when one asset forms a higher high while the correlated asset forms a lower high. This divergence usually indicates weakness in the uptrend and can act as a signal for a trend reversal to the downside.
🔵 How to Use
SMT Divergence is an analytical technique that identifies divergences between two correlated assets in financial markets.
This technique is used when two assets that should move in the same direction move in opposite directions.
Identifying these divergences can help you pinpoint reversal points and trend changes in the market.
🟣 Bullish SMT Divergence
This divergence occurs when one asset forms a higher low while the correlated asset forms a lower low. This divergence indicates weakness in the downtrend and can signal a potential price reversal to the upside.
In this case, when the correlated asset is forming a lower low, and the main asset is moving lower but the correlated asset fails to continue the downward trend, there is a high probability of a trend reversal to the upside.
🟣 Bearish SMT Divergence
Bearish divergence occurs when one asset forms a higher high while the correlated asset forms a lower high. This type of divergence indicates weakness in the uptrend and can signal a potential trend reversal to the downside.
When the correlated asset fails to make a new high, this divergence may be a sign of a trend reversal to the downside.
🟣 Confirming Signals with Correlation
To improve the accuracy of the signals, use assets with strong correlation. Forex pairs like OANDA:EURUSD and OANDA:GBPUSD , or cryptocurrencies like COINBASE:BTCUSD and COINBASE:ETHUSD , or commodities such as gold ( FX:XAUUSD ) and silver ( FX:XAGUSD ) typically have significant correlation. Identifying divergences between these assets can provide a strong signal for a trend change.
🔵 Settings
Second Symbol : This setting allows you to select another asset for comparison with the primary asset. By default, "XAUUSD" (Gold) is set as the second symbol, but you can change it to any currency pair, stock, or cryptocurrency. For example, you can choose currency pairs like EUR/USD or GBP/USD to identify divergences between these two assets.
Divergence Fractal Periods : This parameter defines the number of past candles to consider when identifying divergences. The default value is 2, but you can change it to suit your preferences. This setting allows you to detect divergences more accurately by selecting a greater number of candles.
Bullish Divergence Line : Displays a line showing bullish divergence from the lows.
Bearish Divergence Line : Displays a line showing bearish divergence from the highs.
Bullish Divergence Label : Displays the "+SMT" label for bullish divergences.
Bearish Divergence Label : Displays the "-SMT" label for bearish divergences.
🔵 Conclusion
SMT Divergence is an effective tool for identifying trend changes and reversal points in financial markets based on identifying divergences between two correlated assets. This technique helps traders receive more accurate signals for market entry and exit by analyzing bullish and bearish divergences.
Identifying these divergences can provide opportunities to capitalize on trend changes in Forex, stocks, and cryptocurrency markets. Using SMT Divergence along with risk management and confirming signals with other technical analysis tools can improve the accuracy of trading decisions and reduce risks from sudden market changes.

Breakaway Fair Value Gaps [LuxAlgo]The Breakaway Fair Value Gap (FVG) is a typical FVG located at a point where the price is breaking new Highs or Lows.
🔶 USAGE
In the screenshot above, the price range is visualized by Donchian Channels.
In theory, the Breakaway FVGs should generally be a good indication of market participation, showing favor in the FVG's breaking direction. This is a combination of buyers or sellers pushing markets quickly while already at the highest high or lowest low in recent history.
While this described reasoning seems conventional, looking into it inversely seems to reveal a more effective use of these formations.
When the price is pushed to the extremities of the current range, the price is already potentially off balance and over-extended. Then an FVG is created, extending the price further out of balance.
With this in consideration, After identifying a Breakaway FVG, we could logically look for a reversion to re-balance the gap.
However, it would be illogical to believe that the FVG will immediately mitigate after formation. Because of this, the dashboard display for this indicator shows the analysis for the mitigation likelihood and timeliness.
In the example above, the information in the dashboard would read as follows (Bearish example):
Out of 949 Bearish Breakaway FVGs, 80.19% are shown to be mitigated within 60 bars, with the average mitigation time being 13 bars.
The other 19.81% are not mitigated within 60 bars. This could mean the FVG was mitigated after 60 bars, or it was never mitigated.
The unmitigated FVGs within the analysis window will extend their mitigation level to the current bar. We can see the number of bars since the formation is represented to the right of the live mitigation level.
Utilizing the current distance readout helps to better judge the likelihood of a level being mitigated.
Additionally, when considering these mitigation levels as targets, an additional indicator or analysis can be used to identify specific entries, which would further aid in a system's reliability.
🔶 SETTINGS
Trend Length: Sets the (DC) Trend length to use for Identifying Breakaway FVGs.
Show Mitigation Levels: Optionally hide mitigation levels if you would prefer only to see the Breakaway FVGs.
Maximum Duration: Sets the analysis duration for FVGs, Past this length in bars, the FVG is counted as "Un-Mitigated".
Show Dashboard: Optionally hide the dashboard.
Use Median Duration: Display the Median of the Bar Length data set rather than the Average.

ICT FVG [TheFundedRoad]This indicator shows you all ICT Fair value gaps on chart with midpoint line
Fair value gap is a gap in a set of 3 candles, in a bullish FVG you have 1st candle high being lower than third candle low, and in a bearish FVG you have first candle low higher than third candle high, thats how this indicator finds these fair value gaps
It draws the fair value gap from the 2nd candle forward
You can customize the color and if you want to see the midpoint or not, midpoint is 50% of the gap
London/NY Sessions [jpkxyz]London/NY Sessions Indicator Guide
This indicator tracks the forex market's most active trading periods: London session, New York session, and their overlap.
This characteristics of the London and New York trading sessions are well documented and many traders use them as a key element in their trading strategies. It is most relevant in forex trading, however it is to an extend also applicable in cryptocurrencies.
London Session (08:00-16:00 UTC)
Most active trading session (35% of daily forex volume)
Highest trading volume and liquidity
Major price movements and trend development
Significant institutional participation
New York Session (13:00-20:00 UTC)
Second most active trading period
High institutional order flow
Major US economic releases
Significant impact on USD pairs
London/New York Overlap (13:00-16:00 UTC)
The most active period in forex markets:
Maximum market liquidity
Highest daily trading volume
Strong price movements
Tightest spreads
Peak institutional activity
This indicator helps traders:
Visualize key trading sessions
Track session highs and lows
Monitor overlap dynamics
Identify potential support/resistance levels (session highs/lows)
