Premium Index Generic TheHuntThis indicator is similar to the standard premium index we made for bitcoin, but this one is for alts.
Just like with the bitcoin premium index, you can compare the spot price of a certain altcoin with the price on a futures exchange. The indicator can be used to spot potential strength or weakness in the market.
You can fill in 1 spot exchange pair and compare it with 2 futures exchange pairs.
For example fill in ETHUSD on coinbase and compare it with the future prices on bitmex and bybit.
We can clearly see that on that dump in the blue area, the premium index showed that spot prices were consistently higher than future prices which told us spot was buying the dip.
Index

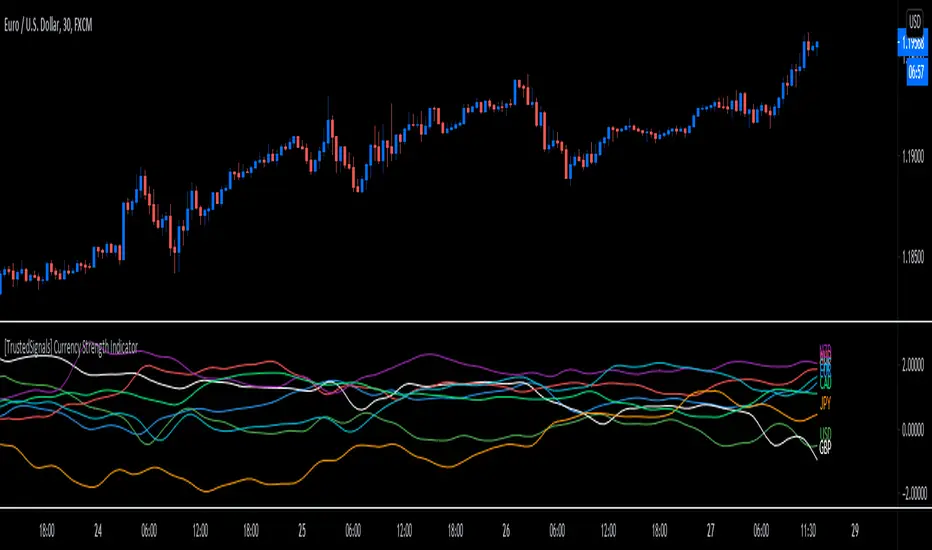
[TrustedSignals] Currency Strength IndicatorOur own branded currency strength meter gives you a quick visual guide to which currencies are currently strong, and which ones are weak.
The meter measures the strength of all forex cross pairs and applies calculations on them to determine the overall strength for each individual currency.
It is useful as a quick guide to which currencies you might want to trade, and which might be worth staying away from. For instance, if a certain currency is very strong, and another suddenly turns weaker, you may find a trading opportunity
The indicator has an extra option the user can activate, to show only the 2 indexes correlated to the displayed pair on the chart. For example, if the EURUSD pair is displayed on the chart, the indicator will only show the EUR index and the USD index.
It is recommended to use a lookback length of over 90 for Timeframes higher than 60min, and under 60 for lower intraday timeframes
Use the link below to obtain access to this indicator
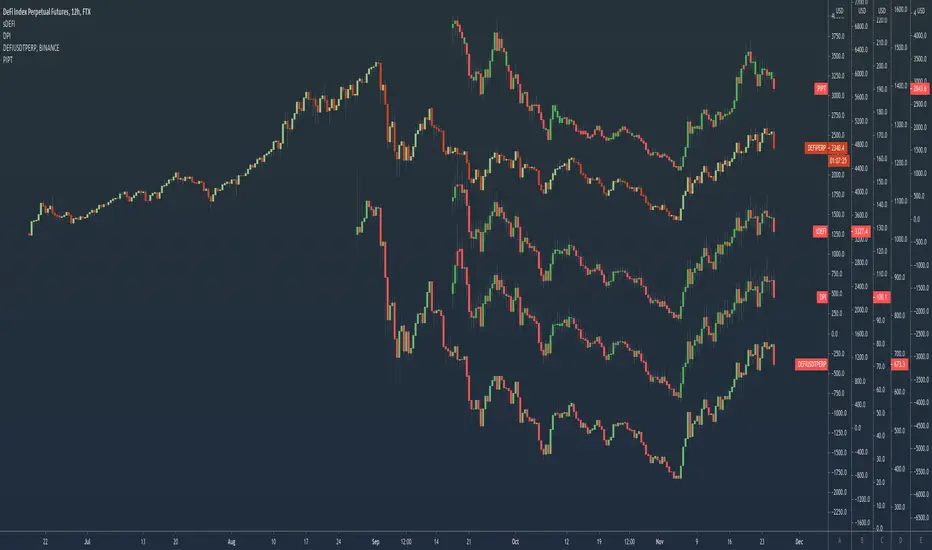
PIPT | Power Index Pool Token | DeFi indexPowerPool provides a DeFi index that has too many components to be used as a chart ticker.
So here is an indicator to bypass the ticker limit.
From the PowerPool docs : app.powerpool.finance
The chart shows it in comparison to other DeFi indexes, quite a difference as you can see!
DPI | DeFi Pulse IndexTokenSets and DeFi Pulse provide a DeFi index that has too many components to be used as a chart ticker.
So here is an indicator to bypass the ticker limit.
From the TokenSets docs : www.tokensets.com
The chart shows it in comparison to other DeFi indexes, quite a difference as you can see!

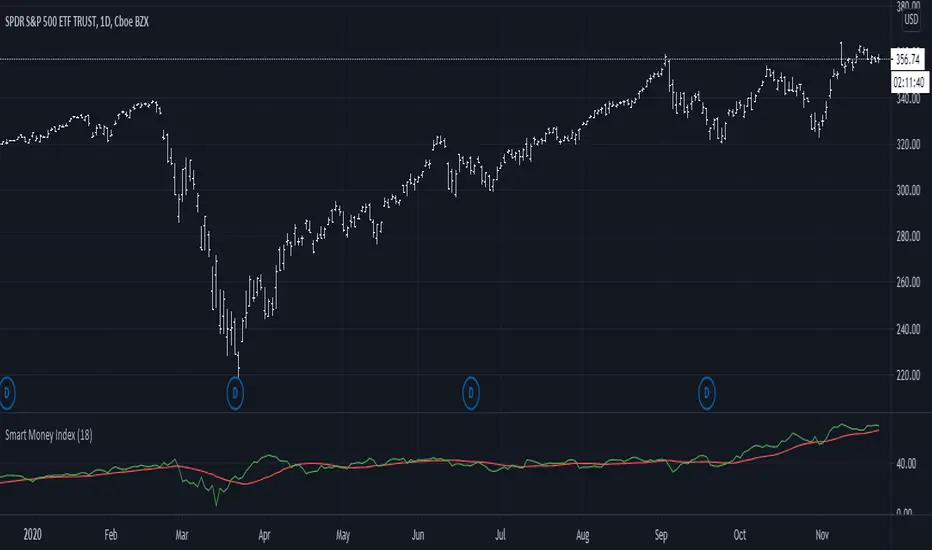
Smart Money Index (SMI)It came to my attention that one very common implementation of SMI was incorrect; rather than subtracting the first hour delta and adding the last hour delta it subtracts the whole day delta and adds the last 30m delta. While this indicator might have had some use, it is not what I understand to be the actual Smart Money Index and so I post this as a correction for use in other scripts.
Premium Index TheHuntThe indicator is used to see the difference in price between spot and futures prices. If future price is higher than spot in a rally, the rally isn't backed by real buys (spot) but by dumb perp longs which CAN be bearish . If spot price is higher than futures in a rally, the upside is backed by real money (spot) which is bullish.
The indicator allows you to pick a spot pair to compare it with the future exchanges you want. You can select which future exchange pairs to compare with by ticking them in the settings.
As you can see here on the chart during this last rally the index is high in the green which means the rally is backed by futures and spot ain't really following. This could be a sign of exhaustion.

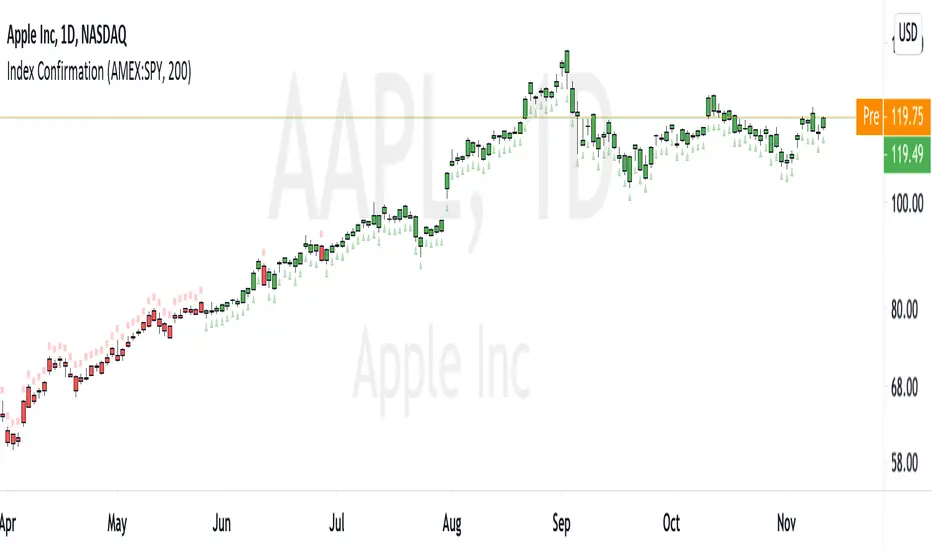
Index ConfirmationThis is a simple Confirmation Indicator that I extensively use in my own trading. Hope others will benefit from it.
Many times, we want to view where the broader index is going before exposing capital to individual stocks. Here's how to use it.
Input the correct Exchange and the Ticker.
Input the Simple Moving Average Period to be applied on the Index/other instrument.
Choose whether bars are colored or dots placed instead or both.
Bars will be colored green if the instrument is above it's moving average & red when below.
Binance Weighted BTC IndexThis is the weighted index for Binance's tether-margined BTC and ETH markets.
It was created to test the accuracy of the weighting and ensure the index was correct. With consideration to the history of tether's effect on Bitfinex's spot market, I had interest in the differences in Bitfinex's USD and UST pairs. Although the difference now is minor, xxx/UST pairs in the index are more accurate.
Options to configure are choosing the base currency, BTC or ETH, and the quote currency, USD or UST (USDT).

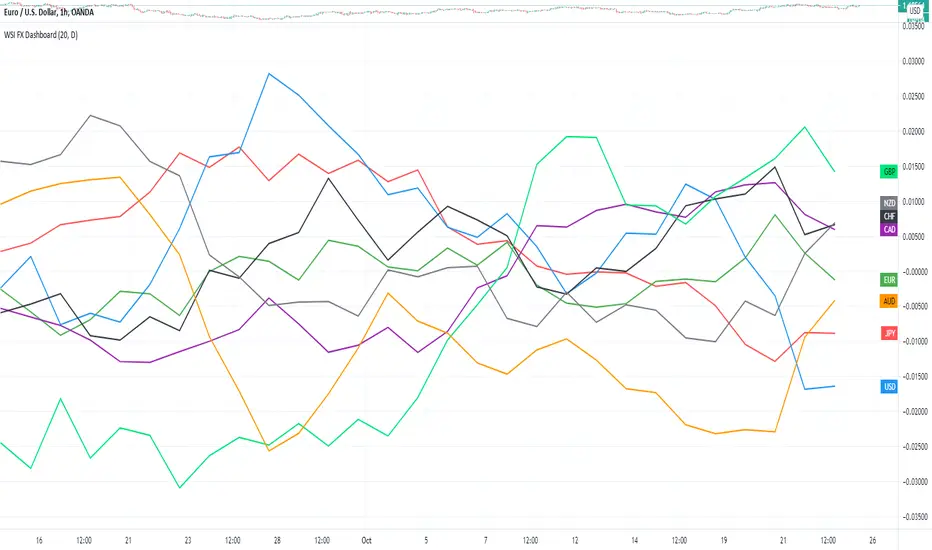
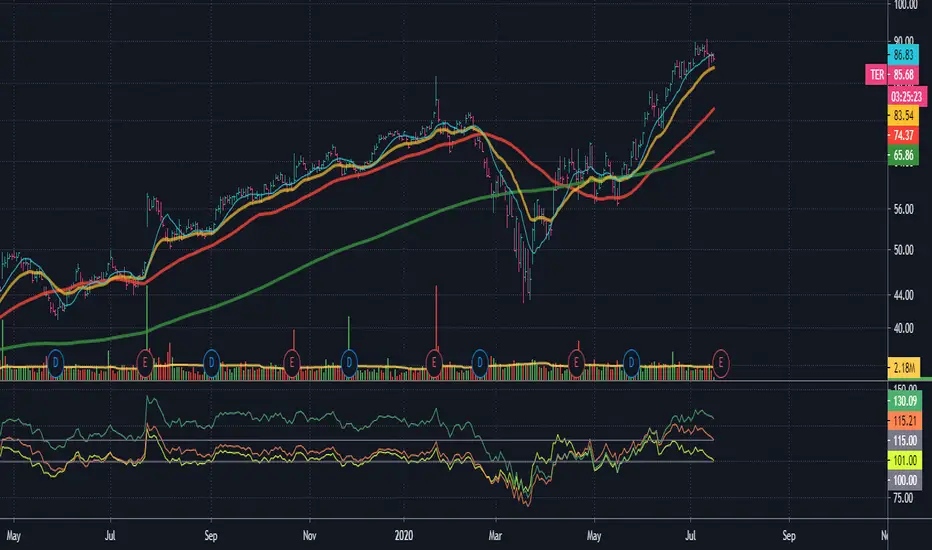
WSI FX DashboardThe WSI (Walton Strength Index) is a currency strength tool designed to show you how individual currencies are performing against each other.
It shows strength for 8 of the major currencies: USD, EUR, GBP, JPY, USD, CAD, AUD, NZD
Each of the lines corresponds to a currency, and you can use those readings to determine which currency pairs you would like to trade.
For example, if the EUR is higher than the rest of the currencies and the USD is lower than the rest of the currencies, then you may consider only buying on the EURUSD.
Don't look at this as an "entry mechanism" for placing trades, but rather a filter mechanism to help you determine which currency pairs might be best for a particular trading strategy that you intend to utilize. Once you have selected a currency pair, or set of currency pairs, then you would go to the individual currency pair charts and perform your usual technical analysis.
The Dashboard can be placed on any chart or timeframe. In the inputs you can select the timeframe you would like to use for the WSI calculations.
For example, if you are on a 1 hour chart and want to see a higher level view of the market, you might set the WSI Dashboard timeframe to Daily.
You can also change the WSI Period, which controls how many candles are used to calculate the strength for each currency.
Here is the 200 Period Daily WSI Dashboard:
Bollinger Bands Strategy with Intraday Intensity IndexFor Educational Purposes. Results can differ on different markets and can fail at any time. Profit is not guaranteed.
This only works in a few markets and in certain situations. Changing the settings can give better or worse results for other markets.
This is a mean reversion strategy based on Bollinger Bands and the Intraday Intensity Index (a volume indicator). John Bollinger mentions that the Intraday Intensity Index can be used with Bollinger Bands and is one of the top indicators he recommends in his book. It seems he prefers it over the other volume indicators that he compares to for some reason. III looks a lot like Chaikin Money Flow but without the denominator in that calculation. On the default settings of the BBs, the III helps give off better entry signals. John Bollinger however is vague on how to use the BBs and it's hard to say if one should enter when it is below/above the bands or when the price crosses them. I find that with many indicators and strategies it's best to wait for a confirmation of some sort, in this case by waiting for some crossover of a band. Like most mean reversion strategies, the exit is very loose if using BBs alone. Usually the plan to exit is when the price finally reverts back to the mean or in this case the middle band. This can potentially lead to huge drawdowns and/or losses. Mean reversion strategies can have high win/loss ratios but can still end up unprofitable because of the huge losses that can occur. These drawdowns/losses that mean reversion strategies suffer from can potentially eat away at a large chunk of all that was previously made or perhaps up to all of it in the worst cases, can occur weeks or perhaps up to months after being profitable trading such a strategy, and will take a while and several trades to make it all back or keep a profitable track record. It is important to have a stop loss, trailing stop, or some sort of stop plan with these types of strategies. For this one, in addition to exiting the trade when price reverts to the middle band, I included a time-based stop plan that exits with a gain or with a loss to avoid potentially large losses, and to exit after only a few periods after taking the trade if in profit instead of waiting for the price to revert back to the mean.

ADX Histogram with DI linesInspired by the user scarf from Tradingview. In contrast with that other indicator, this one instead of a simple moving average (SMA) for the ADX calculations, uses a running moving average (RMA) or also known as Wilder's Average. I like having a histogram for the DI lines over just having lines alone because it makes it easier to see. In addition I made it so that values less than 5 for the DI lines are colored lightly to note that the movement was less significant(might not matter but some might care about it, atleast I do). The ADX has a color fainting effect too, and when it goes above the threshold then it becomes black to note that it is trending, as the indicator suggests.
The advantages with these additions and changes are that it shows a more traditional moving average like the original author Wellers Wilder suggested and you can see the crossings and directional movement changes easier from seeing the colors on the histogram easier than you would by looking at the DI lines alone. The disadvantages are you won't be able to tell when the ADX line is above both DI lines and when the ADX then makes a decrease from there(which can sometimes show a reversal), but personally it doesn't matter too much to me and perhaps to those who care more about seeing the direction than having to focus on all those 3 lines crossing all over the place.

Choppiness Index and RSI by ceyhun
Choppiness Index and RSI by ceyhun
This indicator is based on the inverse relationship between CHOP and RSI.
Bar color
If the RSI is greater than CHOP, the Bar color will be blue.
If CHOP is greater than RSI, the bar color will be red.
CHOP
If CHOP is less than 38.2, the color will turn blue. positive
If the CHOP is between 38.2 and 61.8, the color will be yellow and neutral.
If CHOP is greater than 61.8, the color will turn red. negative
Rsi
If Rsi is greater than 61.8, the color will turn blue, positive
If Rsi is between 38.2 and 61.8, the color will be hexagonal and neutral
If Rsi is less than 38.2 the color will be red, negative
The Choppiness Index (CHOP) is an indicator designed to determine if the market is choppy (trading sideways) or not choppy (trading within a trend in either direction). The Choppiness Index is an example of an indicator that is not directional at all. CHOP is not meant to predict future market direction, it is a metric to be used to for defining the market's trendiness only. A basic understanding of the indicator would be; higher values equal more choppiness, while lower values indicate directional trending.
Relative Strength Index (RSI)
The Relative Strength Index (RSI) is a well versed momentum based oscillator which is used to measure the speed (velocity) as well as the change (magnitude) of directional price movements. Essentially the RSI, when graphed, provides a visual mean to monitor both the current, as well as historical, strength and weakness of a particular market. The strength or weakness is based on closing prices over the duration of a specified trading period creating a reliable metric of price and momentum changes. Given the popularity of cash settled instruments (stock indexes) and leveraged financial products (the entire field of derivatives); RSI has proven to be a viable indicator of price movements.

Adaptive Commodity ChannelThis is part 4 of 11 in the system named Ninetales/Volt V2 you can find on Tradingview.
Use it however you would use standard CCI, just add your preferred values to test against each other, and set the period you would like for it to backtest.

The Lazy Trader - Index (ETF) Trend Following Robot50/150 moving average, index (ETF) trend following robot. Coded for people who cannot psychologically handle dollar-cost-averaging through bear markets and extreme drawdowns (although DCA can produce better results eventually), this robot helps you to avoid bear markets. Be a fair-weathered friend of Mr Market, and only take up his offer when the sun is shining! Designed for the lazy trader who really doesn't care...
Recommended Chart Settings:
Asset Class: ETF
Time Frame: Daily
Necessary ETF Macro Conditions:
a) Country must have healthy demographics, good ratio of young > old
b) Country population must be increasing
c) Country must be experiencing price-inflation
Default Robot Settings:
Slow Moving Average: 50 (integer) //adjust to suit your underlying index
Fast Moving Average: 150 (integer) //adjust to suit your underlying index
Bullish Slope Angle: 5 (degrees) //up angle of moving averages
Bearish Slope Angle: -5 (degrees) //down angle of moving averages
Average True Range: 14 (integer) //input for slope-angle formula
Risk: 100 (%) //100% risk means using all equity per trade
ETF Test Results (Default Settings):
SPY (1993 to 2020, 27 years), 332% profit, 20 trades, 6.4 profit factor, 7% drawdown
EWG (1996 to 2020, 24 years), 310% profit, 18 trades, 3.7 profit factor, 10% drawdown
EWH (1996 to 2020, 24 years), 4% loss, 26 trades, 0.9 profit factor, 36% drawdown
QQQ (1999 to 2020, 21 years), 232% profit, 17 trades, 3.6 profit factor, 2% drawdown
EEM (2003 to 2020, 17 years), 73% profit, 17 trades, 1.1 profit factor, 3% drawdown
GXC (2007 to 2020, 13 years), 18% profit, 14 trades, 1.3 profit factor, 26% drawdown
BKF (2009 to 2020, 11 years), 11% profit, 13 trades, 1.2 profit factor, 33% drawdown
A longer time in the markets is better, with the exception of EWH. 6 out of 7 tested ETFs were profitable, feel free to test on your favourite ETF (default settings) and comment below.
Risk Warning:
Not tested on commodities nor other financial products like currencies (code will not work), feel free to leave comments below.
Moving Average Slope Angle Formula:
Reproduced and modified from source:

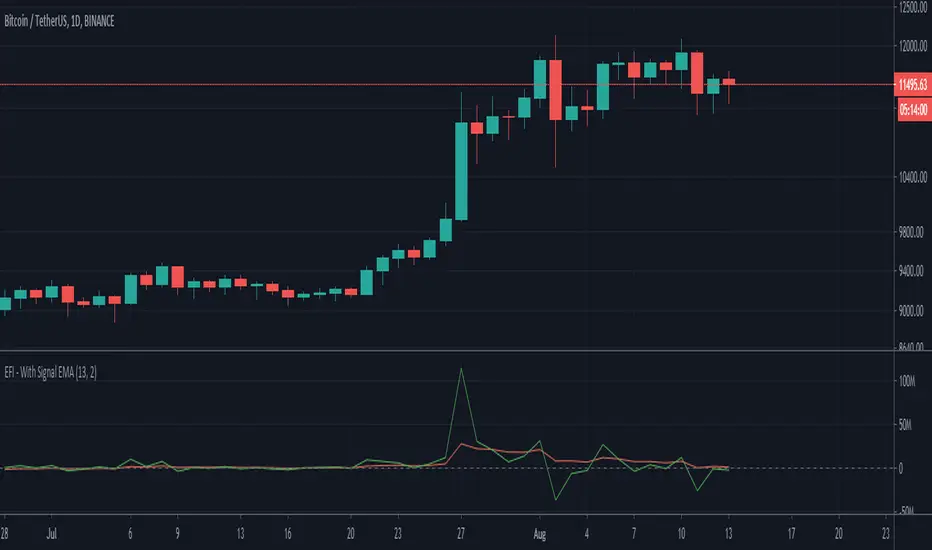
Elders Force Index - With Signal EMA - ValenteSame as Elders Force Index, but with an Additional EMA for buy and sell signal
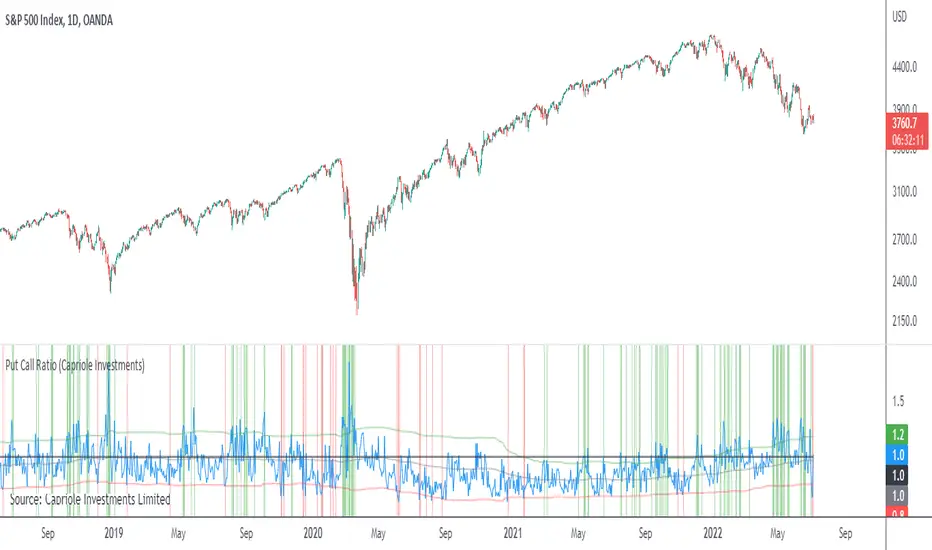
Put Call RatioPlots the CBOE Put Call Ratio and marks up locations of extremities.
Useful as a factor of confluence in identifying extremities in the market.
Nifty VolumeWhy this Script : Nifty 50 does not provide volume and some time it is really useful to understand the volume .
This is the pine script which calculate the nifty 50 volume .
Logic :
Take each stock contribute to nifty 50 and find it's volume .
Multiply the same with contribution percentage of the same on Nifty 50
Add up all of them and find the total volume .
There is a similar script by @daytraderph which is built for Bank Nifty (custom volume) . I took the same and built for Nfity.
Nifty has 50 stocks and you cant call security method more than 40 times from one Pine script, so this is the limitation of this script. It consider top 40 stocks and find the volume (which contribute pretty much around 95% of the volume) and convert the same to 100 %
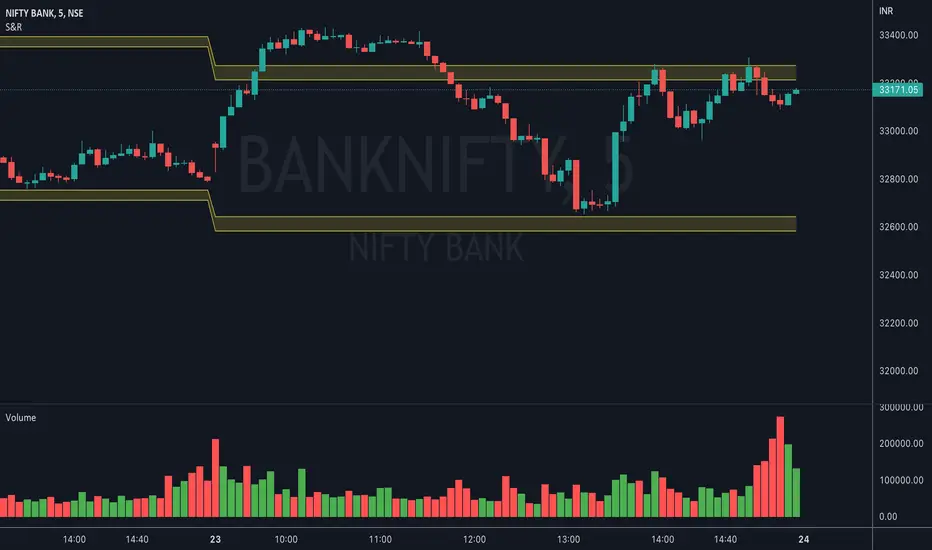
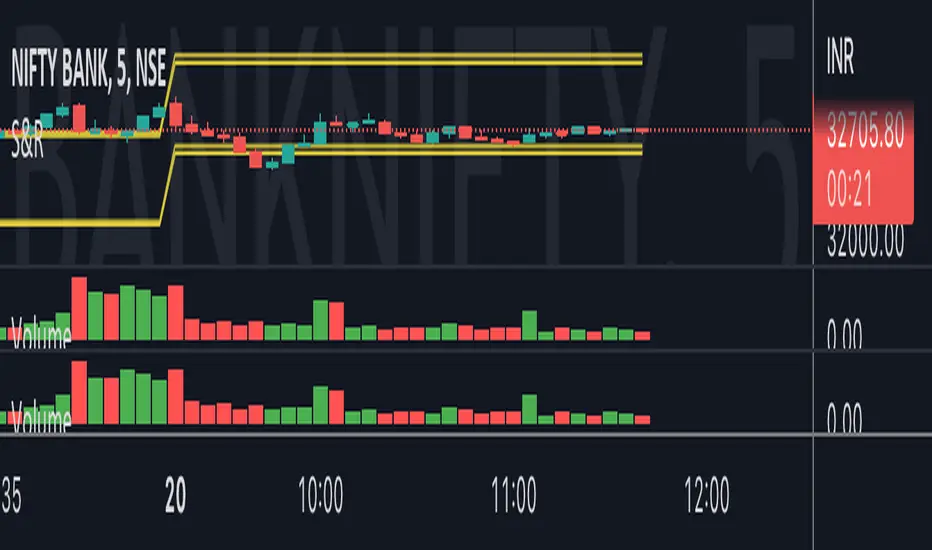
Bank Nifty VolumeWhy this Script : Nifty 50 does not provide volume and some time it is really useful to understand the volume .
This is the pine script which calculate the nifty 50 volume .
Logic :
Take each stock contribute to nifty 50 and find it's volume .
Multiply the same with contribution percentage of the same on Nifty 50
Add up all of them and find the total volume .
I took the open source code from @daytraderph script called, Custom Volume
I will make sure I will update the contribution percentage of all stocks my self instead o you update using input methods. This is the difference. Some people don't know where to look at this to update the value, so for them this script might be useful. And this is the only difference comparing to Custom Volume script.
Index SMA vs. CloseVery simple script that index the close price with the SMA 20,50 and 200. It is very useful to plot and see if stocks are extended vs. de SMAs.
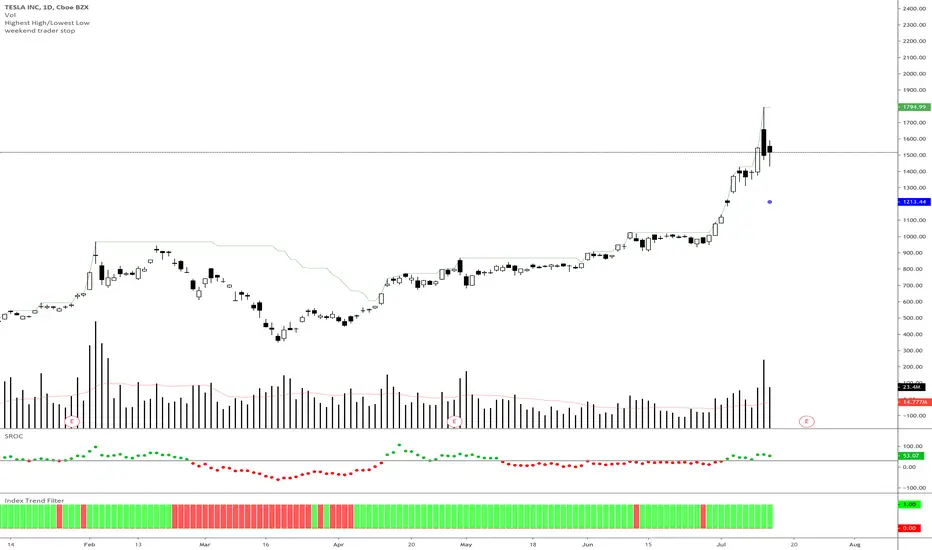
Index Trend Filter - Weekend Trend TraderThis little script simply gives you a quick visual cue of where price is compared to a particular EMA of another security or underlying index.
It is based on Nick Radge's broader market filter weekend trend trader system, but can be applied to other timeframes if you want to confirm if the index is in an up trend or down trend.
• Green means the underlying index price is above the EMA
• Red means the underlying index price is below the EMA
VIX TrendlineThis indicator helps to see the volatility index (VIX) trendline in all stock charts without opening the VIX chart explicitly.
Hope this helps many of you to be more efficient in your chart analysis - have fun!

FauxLife EFIModification to Elder's Force Index (EFI)
Ability to change calculation from standard EMA to your choice of SMA, EMA, WMA, or HMA. Very interesting results!
Adjust lookback from standard/suggested 13 candlesticks
Added a color indication to positive or negative force reading
Added background color tint for an easier read on dashboard setups
Suggested pair with my On Balance Volume with Cross to use as a filter & entry/exit setup. Enter or exit trades when the two indicators switch at the same time or within 1-2 candlesticks of each other.

COT extremes indexCalculates the difference between net of noncommercials and net of commercials.
Difference = (net of noncommercials) - (net of commercials).
The extreme reading in one end or another may indicate the possible change of trend.
Based on Tradingview COT sample script and Babypips formula.
Works on daily timeframe.
