Livermore's Pyramiding Trading - 3Commas [SwissAlgo]
📊 J. LIVERMORE'S PYRAMIDING TRADING - 3Commas Integrated
A Trading Approach Inspired by Jesse Livermore's Position Building Principles
━━━━━━━━━━━━━━━━━━━━━━━━━━━━━━━━━━━━━━━━━━━
DISCLAIMER
This indicator is an educational tool based on historical trading principles. Past performance is not indicative of future results. Trading involves substantial risk of loss. Only trade with capital you can afford to lose. You are responsible for all trading decisions.
━━━━━━━━━━━━━━━━━━━━━━━━━━━━━━━━━━━━━━━━━━━
📚 WHO WAS JESSE LIVERMORE?
Jesse Livermore (1877-1940) was one of the greatest traders in history.
His core insight: "Most traders do everything backward."
♦ "They deploy all capital at once" → Livermore entered with a small fraction of his capital (he started with a 'test position' to validate his trade idea and waited for market confirmation to deploy more, building positions in steps = "pyramiding")
♦ "They average down" (DCA) → Livermore added to trades showing good results only, and never to losing trades, as the trend kept aligning with his trade idea
♦ "They use arbitrary % stops" → Livermore exited when structure appeared broken (he trailed his stop loss to try to protect unrealized profit - if any)
♦ "They take profits too early or set arbitrary TP%" → Livermore let trades showing positive results run until proven wrong (trial take profit)
💬 "I always made money when I was sure I was right before I began. What beat me was not having enough brains to stick to my own game."
— Jesse Livermore
This indicator tries to translate his principles into a SYSTEMATIC FRAMEWORK :
BO = Base Order (first order, base of the pyramid)
PO = Pyramid Orders (additional layers of capital deployed as long as the 'tape' does not invalidate the trade idea)
♦ Test First (BO - 20%) - Small entry to test your idea. If wrong, lose small. If right, can consider pyramiding into strength.
♦ Build Position Size (PO1-3 - 80%) - Add only as trend unfolds favorably (the indicator uses specific Fibonacci levels to track milestones - 0.618, 1.0, 1.272 - and looks for strong confluence among price, volume, trend, momentum, break of resistance/support levels to suggest and trigger actions: entries, exit)
♦ Attempt to Protect Capital - Dynamic stops: the indicator trails the stop loss, to try to protect potential gains from previous steps (if any)
♦ Discipline - Trades fire only when ALL conditions align
━━━━━━━━━━━━━━━━━━━━━━━━━━━━━━━━━━━━━━━━━━━
🎯 INDICATOR FEATURES
You map 3 points on the chart → The indicator generates a systematic trading plan structure based on your wave analysis.
✓ Auto-detects trade direction: Uptrend wave (A➚B➘C) = Long signals | Downtrend wave (A➘B➚C) = Short signals
✓ Entry/exit prices: BO, PO1, PO2, PO3, and dynamic EXIT (trailing stop)
✓ Real-time condition monitoring: Live ✓/✗ checks for each order (price closes + volume + trend + pivot breaks + candle quality + sequence)
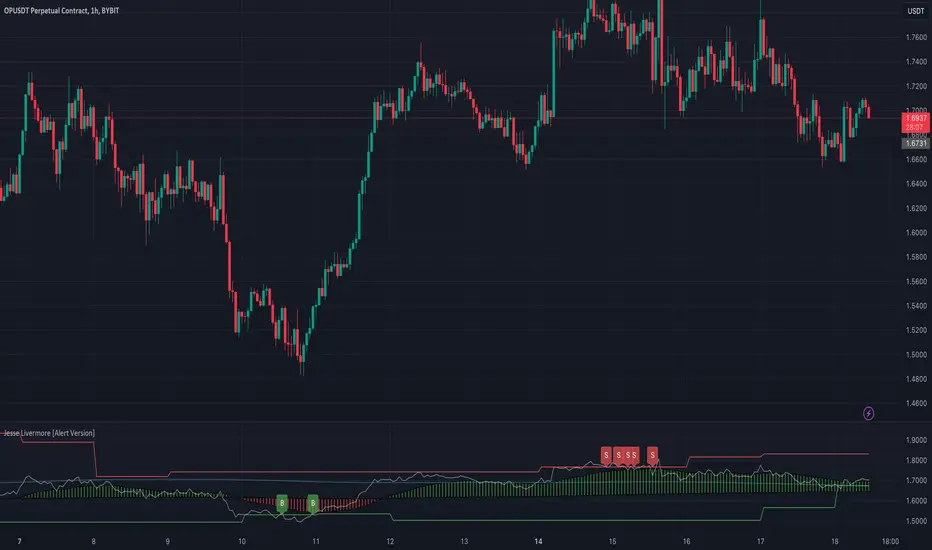
✓ Visual trade execution: Green labels mark entries (BO/PO1/PO2/PO3), red labels mark EXIT
✓ Optional 3Commas automation: JSON webhooks for hands-free execution via Signal Bots
⏰ Recommended Timeframes: 1H, 4H, Daily
(Lower timeframes like 15m/5m produce excessive noise and false signals)
💬 "Watch the market leaders, the stocks that have led the charge. That is where the action is and where the money is made."
— Jesse Livermore
━━━━━━━━━━━━━━━━━━━━━━━━━━━━━━━━━━━━━━━━━━━
⚙️ SETUP IN 3 STEPS
🟡 STEP 1: Map Your Wave (Points A → B → C)
Identify a completed wave pattern:
For LONGS:
♦ Point A = Swing low (wave start)
♦ Point B = Swing high (impulse end)
♦ Point C = Pullback low (retrace end - where next wave may begin)
For SHORTS:
♦ Point A = Swing high (wave start)
♦ Point B = Swing low (impulse end)
♦ Point C = Pullback high (retrace end - where next wave may begin)
How to set points:
Settings → Enter dates manually OR drag the vertical lines directly on the chart (easier - just click and drag the pre-mapped A/B/C lines)
Requirements (auto-validated by code):
✓ All dates must be in the past (Point C = completed retrace, not forming)
✓ Clear impulse A→B (minimum 5% move)
✓ Clear retrace B→C (minimum 3% pullback)
───────────────────────────────────────────
🟡 STEP 2: Set Budget & Allocation
Settings → "TRADE PARAMETERS"
♦ Total Budget: $10,000 (example - capital for THIS trade only, not your entire account)
♦ Allocation (must total 100%):
BO = 20% ($2,000) - test position
PO1 = 25% ($2,500) @ Fib 0.618
PO2 = 30% ($3,000) @ Fib 1.0
PO3 = 25% ($2,500) @ Fib 1.272
💬 "It was never my thinking that made big money for me. It was always my sitting. Men who can both be right and sit tight are uncommon."
— Jesse Livermore
───────────────────────────────────────────
🟡 STEP 3: Monitor Your Trade Plan Table
The table (top-right corner) has 4 sections that guide your execution:
BUDGET DEPLOYMENT
♦ Trigger prices for each order (BO auto-calculated at 0.5 Fib between B-C)
♦ Dollar amount per entry
♦ Fibonacci level assigned to each PO
ENTRY/EXIT CONDITIONS
Each column (BO, PO1, PO2, PO3) shows live status (✓ or ✗) for:
♦ Price: 2 consecutive closes (BO) | 3 consecutive closes (POs)
♦ Volume: OBV directional alignment OR volume spike above average
♦ Trend: Normal or Strong Bull/Bear (no entries in Uncertain trend)
♦ Pivot: Nearest resistance (longs) or support (shorts) broken
♦ Clean Candle: Momentum without reversal wicks <30% (POs only)
♦ Sequence: Prior order must have fired first (POs only - no skipping levels)
TRIGGERED?
Shows execution status for each order (✓ = fired, ✗ = waiting)
If using 3Commas: ✓ confirms JSON alert was sent to your bot for real execution
VALIDATIONS
✓ Green = All checks passed, setup is valid
⚠️ Yellow = Warning (e.g., budget doesn't equal 100%, deep retrace)
✗ Red = Error (e.g., dates in wrong order, invalid wave structure)
⚠️ Wait for ALL ✓✓✓✓✓ (or ✓✓✓✓✓✓) to align in a column before that order fires at bar close
💬 "The game of speculation is the most uniformly fascinating game in the world. But it is not a game for the stupid, the mentally lazy, the person of inferior emotional balance, or the get-rich-quick adventurer."
— Jesse Livermore
━━━━━━━━━━━━━━━━━━━━━━━━━━━━━━━━━━━━━━━━━━━
📊 CHART VISUALS - READING THE INDICATOR
Fibonacci Extension Lines
After mapping A-B-C, horizontal lines extend to the right:
♦ Solid green/red lines = Active PO entry levels (0.618, 1.0, 1.272)
♦ Dotted gray lines = Reference Fib levels used for exit tracking (2.0, 2.618, 3.0, etc.)
♦ Labels on right = Show level and price: "Fib 0.618 / $67,324 "
Entry/Exit Price Lines
♦ Thick green line (longs) / red line (shorts) = BO entry price with direction label
♦ Dashed red line = Current EXIT price (your trailing stop loss - appears after BO fires and moves as price extends)
Trade Execution Labels
Visual confirmation when orders fire on the chart:
♦ Green labels (below/above candles) = BO, PO1, PO2, PO3 entries executed
♦ Red label = EXIT triggered (position closed)
Trend Strength Indicator (EMA Line)
The thick colored line shows real-time trend status:
♦ Bright lime = Strong bullish trend
♦ Light green = Normal bullish trend
♦ Bright red = Strong bearish trend
♦ Light red = Normal bearish trend
♦ Gray = Uncertain/weak trend (no entries fire in this state)
Entries require at least Normal trend strength aligned with your trade direction.
💬 "I never argue with the tape. Getting sore at the market doesn't get you anywhere."
— Jesse Livermore
━━━━━━━━━━━━━━━━━━━━━━━━━━━━━━━━━━━━━━━━━━━
🔧 ENTRY LOGIC - TECHNICAL DETAILS
💬 "The big money was never made in the buying or the selling. The big money was made in the waiting."
— Jesse Livermore
───────────────────────────────────────────
🟢 BASE ORDER (BO) - TEST POSITION
BO Price Calculation
Auto-calculated at the 0.5 Fibonacci retracement between Point B and Point C
Formula: (Price B + Price C) / 2
Why this level?
♦ Midpoint between impulse end (B) and retrace end (C)
♦ Breakout above/below suggests retrace may be complete
♦ Designed to help position BO below all Fib extensions (to control sequence issues)
───────────────────────────────────────────
BO Entry Conditions - ALL 5 Must Align:
1️⃣ PRICE: 2 Consecutive Closes Beyond BO
♦ Longs: close > BO AND close > BO
♦ Shorts: close < BO AND close < BO
♦ Why: Designed to confirm breakout commitment and filter fakeouts
2️⃣ TREND: Normal OR Strong Trend Aligned
♦ Detection: 18-period EMA + ADX/DMI + higher timeframe slope
♦ States: Strong Bull/Bear (ADX>30), Normal Bull/Bear (price vs EMA), Uncertain
♦ Confirmation: Requires 3 consecutive bars in the same state (to reduce flip-flop)
♦ BO accepts: Normal OR Strong (you're testing early, basic alignment sufficient)
3️⃣ PIVOT: Nearest Resistance/Support Broken
♦ Storage: 60 most recent pivot highs/lows (dynamic lookback per timeframe)
♦ Longs: Nearest pivot HIGH above BO → must break with 2 closes
♦ Shorts: Nearest pivot LOW below BO → must break with 2 closes
♦ Price Discovery: If no pivot exists beyond BO = auto-pass
♦ Why: Aims to confirm momentum has overcome previous rejection zones
4️⃣ VOLUME: OBV Aligned OR Spike
♦ Directional OBV: OBV > 20-EMA (longs) OR OBV < 20-EMA (shorts)
♦ OR Volume Spike: Current volume > 20-period SMA
♦ Why: Checks for institutional participation signals
5️⃣ VALIDATIONS: Setup Valid (✅)
♦ Dates valid (A < B < C, all in past)
♦ Wave structure valid (min 5% impulse, min 3% retrace)
♦ Budget allocation = 100%
♦ Prices detected at all points
⚠️ BO fires once per bar close. Flag set permanently until trade resets.
───────────────────────────────────────────
🔺 PYRAMID ORDERS (PO1-3) - PYRAMIDING INTO STRENGTH
💬 "Never buy a stock because it has had a big decline from its previous high. The big money was never made in the stock market by buying on declines."
— Jesse Livermore
PO Price Calculation
Fixed Fibonacci extensions from Point C:
Formula: Price C ± (Impulse Range × Fib Level)
Where: Impulse Range = |Price B - Price A|
Default Levels:
♦ PO1 @ Fib 0.618 (Golden Ratio)
♦ PO2 @ Fib 1.000 (Full impulse repeat)
♦ PO3 @ Fib 1.272 (Fibonacci sequence extension)
───────────────────────────────────────────
PO Entry Conditions - ALL 6 Must Align (STRICTER):
1️⃣ PRICE: 3 Consecutive Closes Beyond PO
♦ Longs: close > PO AND close > PO AND close > PO
♦ Shorts: close < PO AND close < PO AND close < PO
♦ Why: Higher conviction needed when adding capital (3 vs 2 closes for BO)
2️⃣ TREND: Same as BO
Normal OR Strong trend must remain aligned with trade direction
3️⃣ PIVOT: Per-Level Pivot Break
♦ Each PO checks its OWN nearest pivot (not shared with BO)
♦ Same 2-close break requirement
♦ PO3 Exception: Price discovery allowed (no pivot required if already profitable)
4️⃣ VOLUME: Same as BO
Sustained confirmation required (not weakening)
5️⃣ CLEAN CANDLE: <30% Reversal Wick (NEW)
♦ Filter: Uses ATR(14) - candles < ATR auto-pass (consolidation noise)
♦ Longs: Upper wick < 30% of candle range (no rejection at top)
♦ Shorts: Lower wick < 30% of candle range (no rejection at bottom)
♦ Why: Don't pyramid into weakness/rejection - only add on clean momentum
♦ Not checked for BO: Test position tolerates some wick risk
6️⃣ SEQUENCE: Prior Order Fired
♦ PO1 requires: BO fired
♦ PO2 requires: PO1 fired
♦ PO3 requires: PO2 fired
♦ Why: No skipping levels - disciplined building only
───────────────────────────────────────────
⚙️ KEY DIFFERENCE:
BO (20% capital) = Lighter requirements, testing your idea early
POs (80% capital) = Stricter requirements, adding only to confirmed winners
♦ BO: 2 closes | POs: 3 closes
♦ BO: No candle check | POs: Clean candle required
♦ BO: Independent | POs: Sequential (must follow order)
♦ BO: No price discovery | PO3: Allows price discovery when profitable
💬 "Profits always take care of themselves, but losses never do. The speculator has to ensure himself against considerable losses by taking the first small loss."
— Jesse Livermore
━━━━━━━━━━━━━━━━━━━━━━━━━━━━━━━━━━━━━━━━━━━
🚪 EXIT LOGIC - TECHNICAL DETAILS
🔴 EXIT PHILOSOPHY
The indicator uses TWO INDEPENDENT EXIT TRIGGERS (whichever fires first):
1) Structural Breakdown
Price breaks through the EXIT level with confirmation
2) Trend Reversal
Trend flips against your position AND price breaks EXIT level
Why two methods?
♦ Structure = price-based protection (hard stop)
♦ Trend = momentum-based exit (early warning when market character changes)
♦ Combined: Exit either when proven wrong (structure) or when conditions no longer favor your direction (trend)
───────────────────────────────────────────
🔴 EXIT PRICE CALCULATION
The EXIT price (your stop loss) adjusts dynamically based on position size:
BEFORE PO3 Fires (Fixed Stops):
♦ BO only = Stop at Point C (small position, tight stop near entry)
♦ PO1 fired = Stop at Fib 0.5 (moved to breakeven zone)
♦ PO2 fired = Stop at Fib 0.786 (protecting partial profits)
AFTER PO3 Fires (Trailing Stops):
♦ Tracking: Monitors the highest Fib reached (longs) or the lowest Fib reached (shorts)
♦ Placement: EXIT moves 1-2 Fib levels below the highest (longs) or above the lowest (shorts)
♦ Example: Price reaches Fib 2.618 → EXIT trails up to Fib 2.0
♦ Purpose: Designed to protect accumulated profits while allowing room for normal pullbacks
💬 "It never was my thinking that made the big money for me. It was always my sitting. Men who can both be right and sit tight are uncommon."
— Jesse Livermore
───────────────────────────────────────────
🔴 EXIT CONDITIONS
Exit Speed (Based on Risk Exposure):
♦ Full position (PO3 fired) = 1 close required (fast exit - more capital at risk)
♦ Partial position (BO/PO1/PO2 only) = 2 closes required (confirmation - less urgency)
METHOD 1: Structural Breakdown
Price violates the EXIT level with clean momentum:
For Longs:
♦ Price closes BELOW EXIT level (1 or 2 closes depending on position size)
♦ Clean candle required (lower wick < 50% of range - no false breakdown)
For Shorts:
♦ Price closes ABOVE EXIT level (1 or 2 closes depending on position size)
♦ Clean candle required (upper wick < 50% of range - no false breakout)
Why clean candle check?
Designed to reduce exits on wicks/fakeouts. If there's a large reversal wick (>50%), it suggests buyers/sellers are defending the level - not a true breakdown.
METHOD 2: Trend Reversal
Market character shifts against your position:
For Longs:
♦ Trend shifts from Bull → Normal Bear OR Strong Bear
♦ AND price breaks below EXIT level (same close requirements)
For Shorts:
♦ Trend shifts from Bear → Normal Bull OR Strong Bull
♦ AND price breaks above EXIT level (same close requirements)
Why this matters?
♦ Proactive exit before structural stop is hit
♦ If the trend that confirmed your entries reverses, the setup is invalidated
♦ Livermore principle: Exit when market proves you wrong, don't wait for max pain
───────────────────────────────────────────
⚠️ EXIT BEHAVIOR
♦ Fires once per bar close (same as entries)
♦ Resets all tracking after exit (ready for fresh trade setup)
♦ Clears flags: boSignalFired, po1/po2/po3SignalFired, highestFib/lowestFib tracking
♦ If using 3Commas: Sends exit_long or exit_short JSON (market order closes 100% position)
💬 "I never argue with the tape. Getting sore at the market doesn't get you anywhere."
— Jesse Livermore
━━━━━━━━━━━━━━━━━━━━━━━━━━━━━━━━━━━━━━━━━━━
🤖 3COMMAS AUTOMATION (OPTIONAL)
💬 "There is the plain fool, who does the wrong thing at all times everywhere, but there is also the Wall Street fool, who thinks he must trade all the time."
— Jesse Livermore
Automation designed to help remove emotion and support disciplined execution.
───────────────────────────────────────────
⚡ QUICK SETUP IN 5 STEPS
STEP 1: Create Your Signal Bots
You need 2 SEPARATE BOTS (one for Longs, one for Shorts):
Go to 3Commas → Bots → Create Bot → Select "Signal Bot"
Basic Settings:
♦ Bot Name: "Livermore Long - " (example: "Livermore Long - BTCUSDT")
♦ Exchange: Your connected exchange
♦ Trading Pair: Must match TradingView chart exactly
♦ Strategy: Custom Signal
♦ Direction: LONG (for first bot) or SHORT (for second bot)
♦ Max Active Deals: 1
⚠️ CRITICAL SETTINGS:
Entry Orders:
♦ Toggle ON: "Entry Orders"
♦ Volume per Order: "Send in webhook, quote"
♦ Why: This lets the indicator control exact $ amounts per order (BO=$2K, PO1=$2.5K, etc.)
♦ If you skip this: Orders will use wrong sizes and break your allocation plan
Exit Orders:
♦ Toggle ON: "Exit Orders"
♦ Volume per Order: "100 Position %"
♦ Why: Closes your entire position when EXIT signal fires
♦ Toggle OFF: "Take Profit" (managed by indicator)
♦ Toggle OFF: "Stop Loss" (managed by indicator)
Click "Start Bot" for both Long and Short bots.
───────────────────────────────────────────
STEP 2: Get Your Bot Credentials
For EACH BOT (Long and Short):
♦ Open the bot → Click "Orders" tab
♦ Scroll down to "Webhook Messages" section
♦ Copy these 3 values:
bot_uuid (long string like: a362cbcf-7e68-4379-a83d-ae6e47dba656)
secret (very long token starting with: eyJhbGciOiJ...)
webhook URL (refer to 3commas to get exact webhook - signal bots)
Note: The secret is usually the same for both bots, but the bot_uuid is different.
───────────────────────────────────────────
STEP 3: Enter Credentials in Indicator
Back in TradingView:
♦ Open indicator Settings
♦ Find section: "1️⃣ INTEGRATE 3COMMAS"
♦ Paste:
Long = Your Long bot UUID
Short = Your Short bot UUID
Secret = Your secret token (same for both)
♦ Click "OK"
The indicator now has everything needed to build JSON payloads.
───────────────────────────────────────────
STEP 4: Create TradingView Alert
This alert bridges TradingView → 3Commas. ONE ALERT HANDLES ALL SIGNALS (BO, PO1, PO2, PO3, EXIT).
How to create:
♦ Right-click chart → "Add Alert" (or click clock icon)
♦ Condition: Select this indicator from dropdown
♦ Trigger: "Any alert() function call"
♦ Alert Name: "Livermore Pyramiding - "
♦ Message: Leave default (indicator sends its own JSON)
♦ Webhook URL: Paste your 3Commas webhook URL from Step 2
♦ ⚠️ Alert Frequency: "Once Per Bar Close" (CRITICAL - controls duplicate orders)
♦ Expiration: Open-ended (or set specific date)
♦ Click "Create"
───────────────────────────────────────────
STEP 5: Test Before Going Live
🧪 NEVER TEST WITH REAL CAPITAL FIRST. Use one of these methods:
Test 1: Check Bot Status
♦ 3Commas → Bots → Both bots show "Active" (green)
♦ Click into each bot → Orders tab → Should say "Waiting for signal"
Test 2: Verify Alert Active
♦ TradingView → Alerts panel (bell icon)
♦ Your alert should show "Active" status
Test 3: Paper Trade / Tiny Position
♦ Use 3Commas paper mode if available, OR
♦ Set Total Budget to $10-50 for first real test
♦ Map a wave that's about to trigger
♦ Watch if orders actually appear on 3Commas
Test 4: Check JSON Format
♦ When alert fires → TradingView Alerts → Click your alert
♦ Look at "History" or "Log"
♦ Verify JSON has: bot_uuid, secret, action, price, amount
───────────────────────────────────────────
🛠️ COMMON ISSUES & SOLUTIONS
✗ Problem: Orders not appearing on 3Commas
Possible causes:
♦ Wrong webhook URL → Must be exact 3Commas URL (check for typos)
♦ Bot paused → Check bot status must be "Active" (green)
♦ Wrong bot UUID → Verify you copied Long UUID for longs, Short UUID for shorts
♦ Secret mismatch → Double-check secret is correct
♦ Exchange API issues → Verify exchange connection in 3Commas settings
How to debug:
♦ 3Commas → Your Signal Bot → Orders tab
♦ Look for "Rejected Signals" section
♦ Should show error messages if webhook failed
───────────────────────────────────────────
✗ Problem: Orders executing at wrong prices
Possible causes:
♦ Limit order not filled → Price gapped through your level before order filled
♦ Slippage on exits → Exits use market orders (intentional - speed over exact price)
♦ Exchange minimums → Some exchanges have minimum order sizes
Solution:
♦ Entries use limit orders (wait for exact price - may not fill if price gaps)
♦ Exits use market orders (prioritize fast execution when structure breaks)
♦ This is INTENTIONAL DESIGN following Livermore's principle: exit when proven wrong
───────────────────────────────────────────
✗ Problem: PO orders firing out of sequence or skipping
Possible causes:
♦ Alert not set to "Once Per Bar Close" → Change alert frequency setting
♦ Multiple alerts running → Delete old/duplicate alerts for this indicator
♦ Conditions changed mid-bar → Indicator only fires at bar close (protective feature)
Solution:
♦ Keep only 1 active alert per indicator instance
♦ Always use "Once Per Bar Close" frequency
♦ Wait for full bar to close before signals can fire
───────────────────────────────────────────
✗ Problem: Bot not closing position on EXIT
Possible causes:
♦ Exit order setting wrong → Check bot settings
♦ Wrong JSON action → Should be "exit_long" or "exit_short"
♦ No position open → Can't close what doesn't exist
Solution:
♦ Verify: Bot Settings → Exit Orders → Volume per Order = "100 Position %"
♦ Check alert history for correct JSON payload
♦ If stuck: Manually close position in 3Commas, then fix settings
♦ Delete and recreate alert if JSON format is wrong
───────────────────────────────────────────
🔒 SECURITY BEST PRACTICES
♦ Never share bot UUID or Secret - Treat them like passwords
♦ Use restricted API keys - Limit to specific pairs, disable withdrawals
♦ Start small - Test with $10-50 first, scale up only after success
♦ Monitor first trades - Don't set-and-forget immediately
♦ Delete old alerts - If you change A/B/C points, delete old alert and create new one
───────────────────────────────────────────
📊 PREFER MANUAL TRADING?
Skip 3Commas entirely and use the indicator for planning only:
♦ Watch Trade Plan table for ✓✓✓✓✓ alignment
♦ Manually place limit orders at displayed prices
♦ Manually move stop loss as EXIT price updates
♦ Manually close when EXIT signal fires
Benefits: Full control, no API concerns, can override based on context
Drawbacks: Must watch chart constantly, emotions can interfere, may miss signals
───────────────────────────────────────────
✅ FINAL CHECKLIST BEFORE LIVE TRADING
✓ Both Signal Bots created (Long + Short)
✓ Entry Orders: Volume = "Send in webhook, quote"
✓ Exit Orders: Volume = "100 Position %"
✓ Take Profit and Stop Loss disabled in bots
✓ Bot UUIDs and Secret entered in indicator
✓ TradingView alert created with correct webhook
✓ Alert frequency = "Once Per Bar Close"
✓ Alert status shows "Active"
✓ Tested with small amounts successfully
✓ Trade Plan table shows ✅ (no validation errors)
✓ Understand your risk per trade
Once all checked: You're ready for automated pyramiding execution.
━━━━━━━━━━━━━━━━━━━━━━━━━━━━━━━━━━━━━━━━━━━
💡 KEY REMINDERS - BEFORE YOU TRADE
💬 "The speculator's chief enemies are always boring from within. It is inseparable from human nature to hope and to fear."
— Jesse Livermore
───────────────────────────────────────────
⚠️ COMMON MISTAKES (AVOID THESE)
Mapping Incomplete Waves
♦ Point C must be in the PAST (completed retrace, not currently forming)
♦ Don't map a wave that's still developing - wait for confirmation
♦ Minimum requirements: 5% impulse (A→B), 3% retrace (B→C)
Ignoring Validation Warnings
♦ Never create alerts when status shows ✗ (red) or ⚠️ (yellow)
♦ Fix all errors first: dates in order, budget = 100%, valid wave structure
♦ Common issues: dates in future, Point C above B (longs) or below B (shorts)
Premature Manual Entries
♦ Don't enter just because price touched the level
♦ Wait for ALL ✓✓✓✓✓ (or ✓✓✓✓✓✓) to align in Trade Plan table
♦ Patience pays - partial confluence = partial edge = higher risk of losing trades
Wrong Timeframe Selection
♦ Avoid: 15m, 5m, 1m (too much noise, false signals)
♦ Use: 1H, 4H, Daily (cleaner structure, better confluence)
♦ Lower timeframes require faster decisions and produce more whipsaws
Over-Risking Capital
♦ Trade budget ≠ Account size
♦ Never risk capital you can't afford to lose
♦ One bad trade should NOT destroy your account
───────────────────────────────────────────
✅ LIVERMORE PRINCIPLES IN ACTION
Confirmation > Prediction
♦ Don't predict where price will go
♦ Wait for price to INDICATE direction via pivots + volume + trend
♦ Test first (BO 20%), build only when confirmed (POs 80%)
💬 "A man must believe in himself and his judgment if he expects to make a living at this game."
Pyramid on Strength, Never Weakness
♦ Add only when: 3 closes + clean candles + volume + pivot breaks
♦ Never average down (DCA into losers)
♦ If BO wrong, take small loss fast - don't hope and add more
💬 "Never buy a stock because it has had a big decline from its previous high."
Respect Market Structure
♦ Pivots = where smart money previously acted (support/resistance)
♦ Breaking them = momentum overcoming barriers
♦ Entering before pivot break = entering into known rejection zones
Trend is Your Friend
♦ Never pyramid against the trend
♦ If trend shifts to Uncertain or reverses → no new entries
♦ Exit when trend proves you wrong (don't fight it)
💬 "I never argue with the tape. Getting sore at the market doesn't get you anywhere."
Discipline > Emotion
♦ Can't "almost" have all conditions met
♦ Either 100% aligned (all ✓) or you wait
♦ No exceptions, no "this time is different"
♦ Automation designed to help remove emotion - consider using 3Commas
💬 "It never was my thinking that made the big money for me. It always was my sitting."
───────────────────────────────────────────
🎯 FINAL THOUGHT
This indicator is a SYSTEMATIC FRAMEWORK, not a magic solution. It translates Livermore's century-old principles into actionable rules:
♦ Test small, build big
♦ Add to winners, cut losers fast
♦ Let structure guide exits
♦ Stay disciplined when emotions scream
The market will test your patience, discipline, and conviction. The indicator aims to reduce guesswork - but YOU still need to:
♦ Find valid wave structures
♦ Choose appropriate market conditions
♦ Size positions properly
♦ Accept losses as part of the game
💬 "The game of speculation is the most uniformly fascinating game in the world. But it is not a game for the stupid, the mentally lazy, the person of inferior emotional balance, or the get-rich-quick adventurer."
— Jesse Livermore
Jesselivermore

Pivotal Point Detection
The indicator highlights price gaps (overnight gaps) with significantly increased volume in the daily chart only. These price jumps can occur after earnings reports or other significant news and often point to an important event (e.g., a new product or business model). According to Jesse Livermore, these are called Pivotal Points.
The price jumps displayed by the indicator are not a guarantee that they represent a true Pivotal Point, but they provide a hint of a significant business development - especially when they occur repeatedly alongside revenue growth. This can help identify potentially strong growth stocks and high-performing investments. However, the underlying events and connections must be investigated through additional research.
make posible to find stocks like:
NYSE:PLTR NASDAQ:ROOT NASDAQ:NVDA NYSE:CVNA NYSE:LRN
A "pivotal price line" is drawn at the opening price of the Pivotal Point. This line is considered a support level. If the price falls below this line, the Pivotal Point loses its validity.

JL Swing Signal - {UT}Hello all, This signal is created based on Jesse Livermore's formula, I have tried to enhance it by including other elements to make the experience better and rewarding.
1. Swing Highs and Swing Lows:
>Identifies a swing high when the current high is higher than the highs of the specified number of bars to its left and right.
>Identifies a swing low when the current low is lower than the lows of the specified number of bars to its left and right.
>Also marks the confirmed swing highs (SH) and swing lows (SL) on the chart for visual reference.
2. Breakout Confirmation:
> Finds out when the closing price crosses above the last confirmed swing high.
> Ensures that the breakout is sustained for the defined number of confirmation bars to filter out false breakouts.
>BuySignal: A buy signal is generated only when both the breakout and hold conditions are met.
3. Trend Filter:
>EMA Calculation: A 50-period EMA is used to filter trades in the direction of the existing trend. Trades are only taken in the direction of the trend.
>Ensures buy signals are only triggered if the price is above the EMA, indicating an uptrend.
4. Volume Confirmation:
Volume Moving Average: A 20-period Simple Moving Average (SMA) of volume is calculated to compare current volume levels.
5. Profit Target:
ATR-Based Profit Target: A dynamic profit target is set based on a multiple of the ATR. This helps capture profits when the market moves in the trade's favor.
6. Exit Strategy:
Stop Loss and Profit Target: The script exits the trade if the price hits the stop loss or the profit target.
Interpretaion:
Buy Signals: Displayed with a green "BUY" label.
Stop Loss and Profit Target: Plotted as orange and green lines, respectively.
Exit Signals: Displayed with a red "EXIT" label when the exit conditions are met.

High Volume Daily Warning Signal- Jesse Livermore // values are in %, so on right Y axis a value of 50 means 50% above the average volume of set length (default of 20)
These important confirming volume spurts often end the day with a 50 percent to 500 percent increase in the average daily volume of the stock. - Jesse Livermore
when daily volume increases by 50% of it average daily volume, it is a warning sign in the possible change of trend or pivotal point
you can select horizontal levels of interest

Jesse Livermore Strategy [Buy & Sell]Jesse Livermore was a famous trader who made a fortune in the early 20th century through his unique approach to trading.
While he did not leave behind a single, specific trading strategy that is attributed to him, I have tried to reproduce one.
His trading strategy was based on understanding market trends and sentiment, and he used several technical indicators to identify potential entry and exit points.
Some of the indicators he used include:
Price Action:
Jesse Livermore relied heavily on price action to make trading decisions.
He believed that the price itself was the best indicator of market sentiment, and that by analyzing the price movement, he could identify trends and market behavior.
Volume:
Livermore also used volume to confirm price movements.
He believed that a rise in volume along with a price increase indicated a strong bullish trend, while a decrease in volume with a price increase indicated a weak trend.
Pivot Points:
Another key component of Jesse Livermore's trading strategy was pivot points.
He used pivot points to identify potential support and resistance levels in the market, which he then used to identify potential entry and exit points.
Jesse Livermore outlined a simple trading system: wait for pivotal points before entering a trade.
When the points come into play, trade them using a buffer, trading in the direction of the overall market.
Let the price dictate your actions and stay with profitable trades until there is good reason to exit the trade.
The one I have tried to reproduce it's based on Pivot High and Low looking back 5 Days, and the average price oscillator.
When the price is bellow the support defined line it's time to Buy ( Long Position ), when the Price line is over the Resistance Line it's time to Sell ( Short Position )
This indicator has to be checked, and tried into a Real-Time context, so using the Replay functionality of TradingView is the best way to see and understand how Signals comes
(NB: look back into the chart without Replay should give you wrong Buy/Sell information)
The Indicator can be used on every TimeFrames, but the better ones are 5min - 15min.
I will add the possibility to choose the TimeFrames value for Pivot High and Low.
I will create a version with Alerts for Buy and Sell and the possibility to integrate it with "3commas Bot" where the best deal can be to set a TP to 1% for each Long or Short Entry.
Let's try it and comment for doubts or questions.