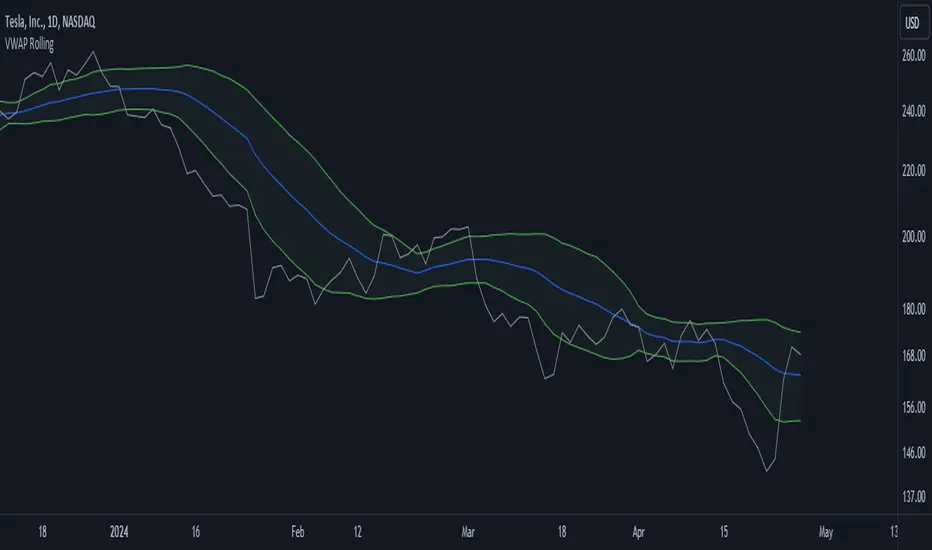
VWAP RollingThis indicator, referred to here as "VWAP Rolling," is a technical tool designed to provide insight into the average price at which an asset has traded over a specified rolling period, along with bands that can indicate potential overbought or oversold conditions based on standard deviations from this rolling VWAP.
Purpose and Utility:
The indicator's primary purpose is to track the volume-weighted average price (VWAP) over a specified period, typically 20 bars in this script. The VWAP Rolling is particularly useful in assessing the average price level at which a security has been traded over the recent history, incorporating both price and volume data. This can help traders understand the prevailing market price in relation to trading volume.
Advantages:
1. Dynamic Average: Unlike fixed VWAP indicators that calculate over a specific session, the rolling VWAP adapts to recent price and volume changes, offering a more responsive and dynamic average.
2. Volume Sensitivity: By weighting prices by volume, the rolling VWAP gives more importance to periods with higher trading activity, providing a clearer picture of where significant trading has occurred.
3. Standard Deviation Bands: The inclusion of standard deviation bands (configurable as 1x and 2x deviations in this script) around the rolling VWAP adds a layer of analytical depth. These bands can serve as potential areas of support and resistance, highlighting deviations from the mean price.
Singularization and Interpretation:
The VWAP Rolling indicator is singularized by its ability to adapt to changing market conditions, offering a dynamic representation of the average price level influenced by volume. To use and interpret this indicator effectively:
• Rolling VWAP Line: The main line represents the rolling VWAP. When this line trends upwards, it suggests that recent trading has been occurring at higher prices weighted by volume, indicating potential bullish sentiment. Conversely, a downtrend in the rolling VWAP may indicate bearish sentiment.
• Standard Deviation Bands: The upper and lower bands (configurable as 1x and 2x standard deviations from the rolling VWAP) are used to identify potential overbought or oversold conditions. A price crossing above the upper band may indicate overbought conditions, signaling a potential reversal or correction downwards. Conversely, a price crossing below the lower band may suggest oversold conditions, potentially signaling a bounce or reversal upwards.
• Band Interaction: Watch for interactions between price and these bands. Repeated touches or breaches of the bands can provide clues about the strength of the prevailing trend or potential reversals.
Interpretative Insights:
• Trend Confirmation: The direction of the rolling VWAP can confirm or contradict the prevailing price trend. If the price is above the rolling VWAP and the VWAP is rising, it suggests a strong bullish sentiment. Conversely, a falling rolling VWAP with prices below might indicate a bearish trend.
• ean Reversion Signals: Extreme moves beyond the standard deviation bands may signal potential mean reversion. Traders can look for price to revert back towards the rolling VWAP after such deviations.
In summary, the VWAP Rolling indicator offers traders a flexible tool to gauge average price levels and potential deviations, incorporating both price and volume dynamics. Its adaptability and standard deviation bands provide valuable insights into market sentiment and potential trading opportunities.
Julien_eche
Fair ValueThis indicator is designed to provide a valuation perspective based on a specified length and deviations from a base value. This code calculates fair value levels relative to a chosen source (typically closing prices) using simple moving averages (SMA) or exponential moving averages (EMA). Please note that this is purely educational and should not be considered financial advice.
Key Features:
1. Valuation Calculation: The indicator computes a base value using either SMA or EMA, providing a reference point for fair value.
2. Deviation Levels: Additional levels of valuation are defined as deviations from the base value, indicating potential overvalued or undervalued conditions.
3. Currency-Specific Display: It displays valuation levels in different currency symbols based on the asset's trading currency.
4. Visual Representation: The indicator plots fair value lines and shades areas to highlight potential deviations.
5. Line Projection: A projection line shows potential future movement based on the calculated slope. This feature forecasts future price movement using a linear regression line's slope, dynamically projecting the trend forward. It provides traders with valuable insight into potential future price behavior. The implementation involves complex mathematical computations to determine the slope and iterative drawing of projected segments.
Educational Purpose: This indicator is for educational purposes only. It does not guarantee accuracy or suitability for trading decisions.
Please use caution and consider consulting a financial professional before making any investment decisions based on this indicator. Keep in mind that market conditions can change rapidly, and historical performance may not predict future results.

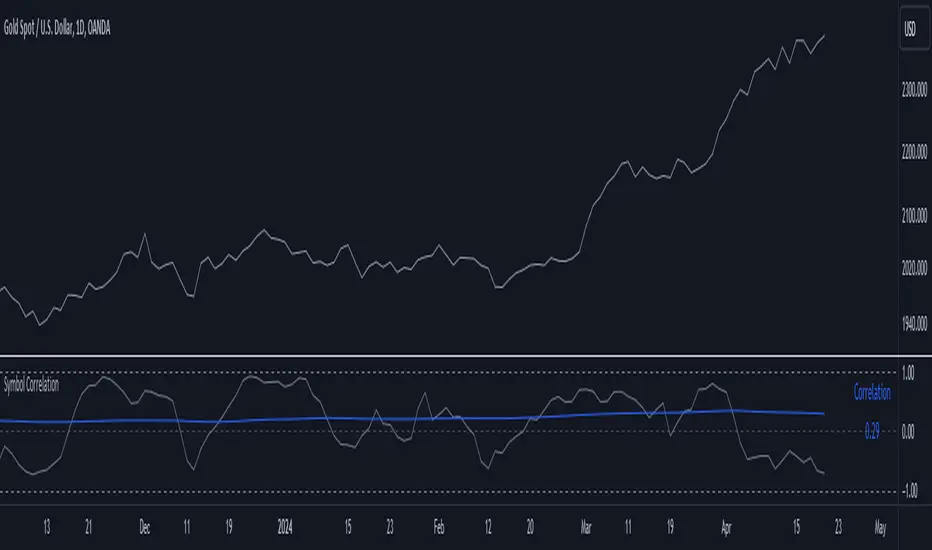
Symbol CorrelationThe "Symbol Correlation" indicator calculates and displays the correlation between the chosen symbol's price and another selected source over a specified period. It also includes a moving average (SMA) of this correlation to provide a smoothed view of the relationship.
Why SMA and Table Display ?
The inclusion of SMA (Simple Moving Average) with adjustable length (SMA Length) enhances the indicator's utility by smoothing out short-term fluctuations in correlation, allowing for clearer trend identification. The SMA helps to visualize the underlying trend in correlation, making it easier to spot changes and patterns over time.
The table display of the correlation SMA value offers a concise summary of this trend. By showcasing the current correlation SMA alongside its historical values, traders can quickly gauge the relationship's strength relative to previous periods.
Interpreting the Indicator:
1. Correlation Values: The primary plot shows the raw correlation values between the symbol's price and the specified source. A value of 1 indicates a perfect positive correlation, -1 signifies a perfect negative correlation, and 0 suggests no linear relationship.
2. Correlation SMA: The SMA line represents the average correlation over a defined period (SMA Length). Rising SMA values indicate strengthening correlation trends, while declining values suggest weakening correlations.
3. Choosing SMA Length: Traders can adjust the SMA Length parameter to tailor the moving average to their specific analysis horizon. Shorter SMA lengths react quickly to price changes but may be more volatile, while longer SMA lengths smooth out noise but respond slower to recent changes.
In summary, the "Symbol Correlation" indicator is a valuable tool for assessing the evolving relationship between a symbol's price and an external source. Its use of SMA and tabular presentation facilitates a nuanced understanding of correlation trends, aiding traders in making informed decisions based on market dynamics.
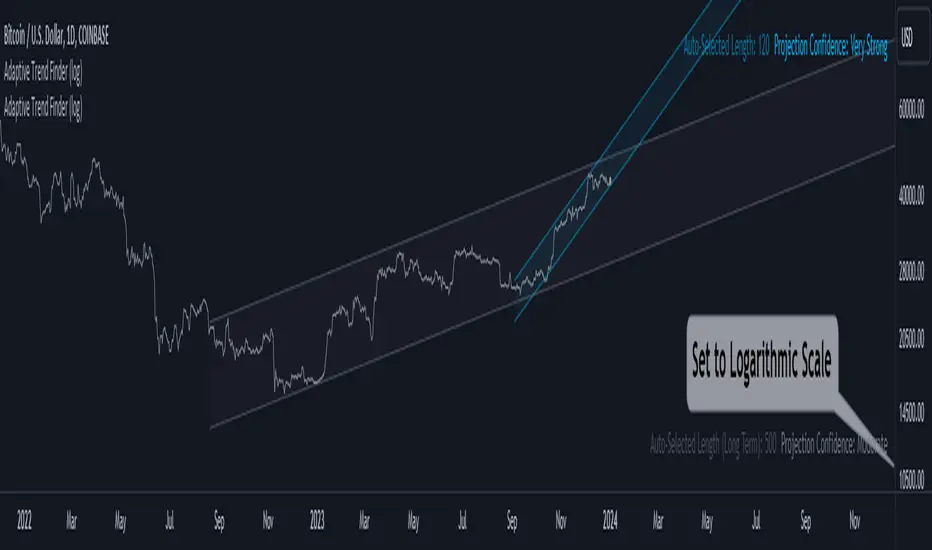
Adaptive Trend Finder (log)In the dynamic landscape of financial markets, the Adaptive Trend Finder (log) stands out as an example of precision and professionalism. This advanced tool, equipped with a unique feature, offers traders a sophisticated approach to market trend analysis: the choice between automatic detection of the long-term or short-term trend channel.
Key Features:
1. Choice Between Long-Term or Short-Term Trend Channel Detection: Positioned first, this distinctive feature of the Adaptive Trend Finder (log) allows traders to customize their analysis by choosing between the automatic detection of the long-term or short-term trend channel. This increased flexibility adapts to individual trading preferences and changing market conditions.
2. Autonomous Trend Channel Detection: Leveraging the robust statistical measure of the Pearson coefficient, the Adaptive Trend Finder (log) excels in autonomously locating the optimal trend channel. This data-driven approach ensures objective trend analysis, reducing subjective biases, and enhancing overall precision.
3. Precision of Logarithmic Scale: A distinctive characteristic of our indicator is its strategic use of the logarithmic scale for regression channels. This approach enables nuanced analysis of linear regression channels, capturing the subtleties of trends while accommodating variations in the amplitude of price movements.
4. Length and Strength Visualization: Traders gain a comprehensive view of the selected trend channel, with the revelation of its length and quantification of trend strength. These dual pieces of information empower traders to make informed decisions, providing insights into both the direction and intensity of the prevailing trend.
In the demanding universe of financial markets, the Adaptive Trend Finder (log) asserts itself as an essential tool for traders, offering an unparalleled combination of precision, professionalism, and customization. Highlighting the choice between automatic detection of the long-term or short-term trend channel in the first position, this indicator uniquely caters to the specific needs of each trader, ensuring informed decision-making in an ever-evolving financial environment.
ZigZag Channel with projection forecastThis indicator is created on top of existing Zigzag indicator .
The projection channel starts at the end of the last ZigZag line.
Disclaimer
Success in trading is all about following your trading strategy and indicators should fit into your own strategy, and not be traded purely on.
This script is for informational and educational purposes only. Use of the script does not constitute professional and / or financial advice. You are solely responsible for evaluating the outcome of the script and the risks associated with using the script. In exchange for the use of the script, you agree not to hold monpotejulien TradingView user responsible for any possible claims for damages arising out of any decisions you make based on the use of the script.
