K-macd
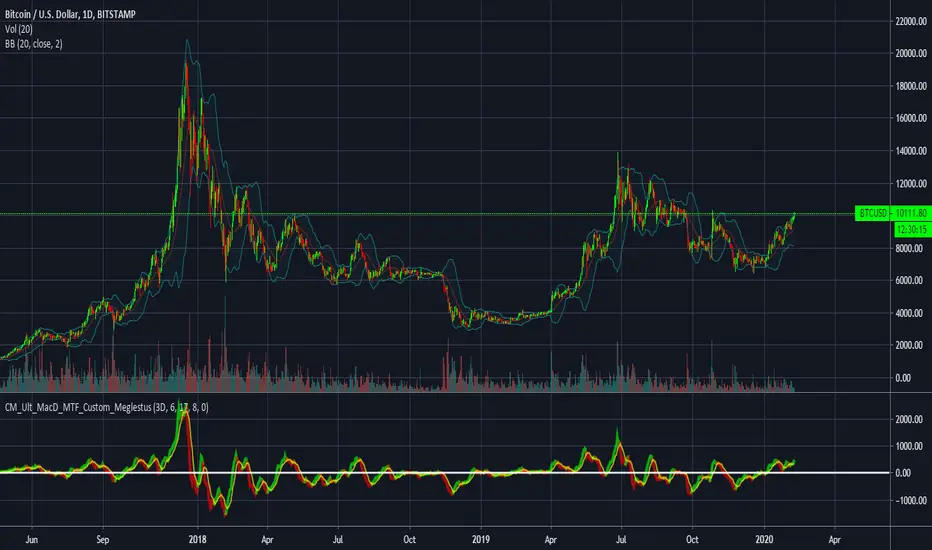
CM_MacD_Ult_MTF_Custom_MeglestusBased of off ChrisMoody his version of this
With some customization from my side to make it more reliable on BTC, Crypto.
I have made it a long time ago so I am not too sure on what it all uses, just look through the code :P
MACD_RSI strategyUse three indicator to entry a position
EMA (20), MACD (12, 26, 20), RSI (14)
apply ema20 on rsi as signal line
Entry long when
price above EMA20, MACD above signal line and RSI above signal line
Entry short when
price below EMA20, MACD below signal line and RSI below signal line
Study only, use it under your own risk.

Point and Figure (PnF) MACDThis is live and non-repainting Point and Figure Chart MACD tool. The script has it’s own P&F engine and not using integrated function of Trading View.
Point and Figure method is over 150 years old. It consist of columns that represent filtered price movements. Time is not a factor on P&F chart but as you can see with this script P&F chart created on time chart.
P&F chart provide several advantages, some of them are filtering insignificant price movements and noise, focusing on important price movements and making support/resistance levels much easier to identify.
P&F MACD is calculated and shown by using its own P&F engine.
If you are new to Point & Figure Chart then you better get some information about it before using this tool. There are very good web sites and books. Please PM me if you need help about resources.
Options in the Script
Box size is one of the most important part of Point and Figure Charting. Chart price movement sensitivity is determined by the Point and Figure scale. Large box sizes see little movement across a specific price region, small box sizes see greater price movement on P&F chart. There are four different box scaling with this tool: Traditional, Percentage, Dynamic (ATR), or User-Defined
4 different methods for Box size can be used in this tool.
User Defined: The box size is set by user. A larger box size will result in more filtered price movements and fewer reversals. A smaller box size will result in less filtered price movements and more reversals.
ATR: Box size is dynamically calculated by using ATR, default period is 20.
Percentage: uses box sizes that are a fixed percentage of the stock's price. If percentage is 1 and stock’s price is $100 then box size will be $1
Traditional: uses a predefined table of price ranges to determine what the box size should be.
Price Range Box Size
Under 0.25 0.0625
0.25 to 1.00 0.125
1.00 to 5.00 0.25
5.00 to 20.00 0.50
20.00 to 100 1.0
100 to 200 2.0
200 to 500 4.0
500 to 1000 5.0
1000 to 25000 50.0
25000 and up 500.0
Default value is “ATR”, you may use one of these scaling method that suits your trading strategy.
If ATR or Percentage is chosen then there is rounding algorithm according to mintick value of the security. For example if mintick value is 0.001 and box size (ATR/Percentage) is 0.00124 then box size becomes 0.001.
And also while using dynamic box size (ATR or Percentage), box size changes only when closing price changed.
Reversal : It is the number of boxes required to change from a column of Xs to a column of Os or from a column of Os to a column of Xs. Default value is 3 (most used). For example if you choose reversal = 2 then you get the chart similar to Renko chart.
Source: Closing price or High-Low prices can be chosen as data source for P&F charting.
P&F MACD Part
Fast Length: Fast Length for P&F MACD , default value is 12
Slow Length: Fast Length for P&F MACD , default value is 26
Signal Smoothing: Signal Length, default value is 9
Source: Moving averages on P&F charts are based on the average price of each column. Bar chart moving averages are based on each close price. Average price means “(ClosePrice + OpenPrice) / 2”. You can choose Close Price or Average Price as source. Default is Average Price.
There are 2 Alerts:
If PNF MACD line crossover the signal line
If PNF MACD line crossunder the signal line
While adding alert “Once Per Bar Close” option should be chosen.

MacD (Future Known or Unknown) StrategyThis indicator/strategy is to be used as a way to baseline the top potential any strategy could have with other strategies and indicators.
What I have created literally shows the BEST moves possible you could have made in my opinion for SHORTING or LONGING using only the MacD values of the 4 hour while on the 30 minute chart.
To use this, try checking out XBTUSD on the 30 minute chart . It will work under different time frames but works best on the 30 minute chart in my opinion. It WILL NOT WORK Above 2 hours time frame.
DO NOT TRADE WITH THIS indicator . I can't emphasize this enough. These results only work because of the lookahead_on parameter. A lot of scam indicators and strategies use this to trick people on tradingView into buying their scripts.
This code is OPEN SOURCE and as such there is nothing to hide and no scam!
I like to use this as a comparison tool for how good I 'could' have traded and at what points those were. By knowing where the perfect trading positions are, you can create real indicators and scripts that try to find patterns in those positions.
This also shows that IF you could know the direction the MacD was going what amazing results you could get ^_~.
This is meant purely for entertainment purposes and for comparing against your own scripts.
I've included the options in the settings to allow ONLY LONG or ONLY SHORTS. By default it attempts both buy attempts. You can also change your starting ($) amount and commission percentage that is taken per trade as well.
Also included in the options is the ability to set the back testing time frame to see how it performs during just certain time periods.
Finally a color explanation
Red - MacD 4 hour going down
Green - MacD 4 hour going up
Purple - MacD 4 hour going down (from an up position)
Yellow - MacD 4 hour going up (from a down position)
Notice the program will always buy right before it turns into a yellow color since it knows the future.
In the options you can turn off 'use the future' to see the horrible results if you trade the moment you know which direction the MacD 4 hour is actually going. I will revise this script in the future with attempts to work without knowing the future as play options to get better results.
If you have any questions or comments, please do not hesitate to ask!

New RenaissancePrelim version of MACD long entry and exit with custom time frame selector.
To do:
Add Stoch and Stoch RSI criteria.

Commodity Channel Index MACD I've not seen any reprensentation of this type based on CCI chanel....
This indicator is an hybrid between CCI and MACD.
The CCI MACD line is calculated using a moving average between 2 CCI period a (FastCCI - SlowCCI) aplied on the (Fast + Slow) periods
The CCI signal line is a moving average of (CCI MACD line, on the signal line smoothing length.
The histogram is only the difference between the CCI MACD and CCI Signal line
//--------CODER--------//
R.V

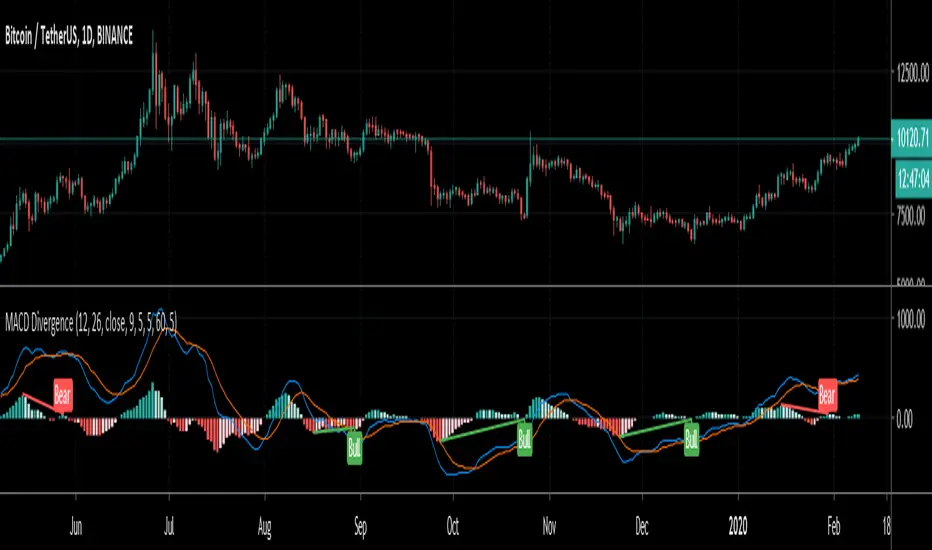
unRekt - KISS MacdieMacdie is the MACD 'Moving Average Convergence Divergence' indicator and is part of the 'keeping it simple' series that have a similar color scheme. MACD is based on the difference between two moving averages calculated for different periods, typically 12 and 26. The MACD can show trend and strength of an asset while also showing Divergences.


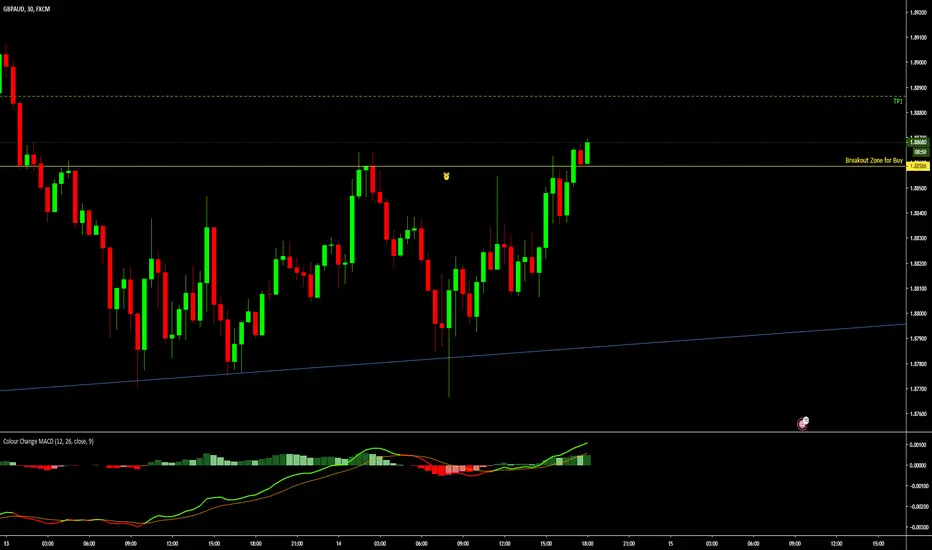
Colour Change MACDTradition MACD but the MACD Line changes colour when it crosses the Signal line
Green indicates a buyers market
Red indicates a seller's market
The ideal time to BUY is when the MACD line is GREEN heading upwards and above or crossing the Histogram
The Ideal time to sell is when the MACD line is RED heading down and Below or crossing from top to bottom of the Histogram
VMACDIntended to be used in exactly the same way as the built-in MACD, but uses volume-weighted moving averages instead. This gives it a tiny edge for spotting high volume breakouts.

Minkowski Distance Factor Adaptive Period MACDHi, this script comes from the idea that Ricardo Santos' Minkovski Distance Function is transferred to the period as a factor.
Minkowski distance is used as a percentage factor with the help of Relative Strength Index function.
Minkowski Distance Function Script :
And thus an adaptive MACD was created.
This script can give much better results in more optimized larger periods.
I leave the decision to determine the periods and weights.
I used the weights of 9,12,26 and periods created with multiplied by factor.
Regards.

W5T Roller CoasterOur new Roller Coaster indicator is perfect for trading Stocks, Futures, Forex, Commodities, & Cryptocurrencies.
The Roller Coaster is a Stochastic/MACD Cross with Special EMA Points of Control for both Long and Short trades.
Our algorithm works everything out behind the scenes, keeping your chart clean.
With the purchase of our indicator, you will have access to:
Entry Price
Stop Loss Price
Trade Management
Trailing Stop Positions
Get in early on a Trend, or Trade Long & Short as an instrument moves with a range
Check out our signature to learn more!

[fikira] MACD & RSI+Stoch + DivergencesThis is a new version of my "Divergences"
Compared to my "Divergences (Pivots)", this is calculated totally different
There are 3 options:
- MACD
- RSI
- Stoch RSI
Since this script is very heavy in calculation it is limited in time (= inspired from a script of "Che_Trader")
Also it uses "max_bars_back" (=1000)
For MACD and Stoch RSI there is a "custom Divergences Period", which compares more then 7 Pivot Points,
the higher the number, the less reliable, it is not necessary to use this, but it is there,
also you can change the "leftbars" and "rightbars", again, it is not necessary to change, but you can...
Linewidth and style of the Divergences lines can be changed
Thank you!

MACD AND SMA COMBINATION [MV]Hello everyone, This indicator based Multi-Indicator For Example MACD AND SMA.
how will come to buy signal?
When macd line crossingup signal line and sma above open bar
when will come Buy signal
or
When sma above open bar and macd line crossingup signal line
when will come Buy signal
how will come to Sell signal?
When macd line crossingdown signal line and sma below open bar
when will come sell signal
or
When sma below open bar and macd line crossingdown signal line
when will come Buy signal
if you have issues about this indicator comment there.
Thank you so much
MACD 4H StrategyThis strategy is a basic example of using MACD AND the instrument must be found an appropriate timeframe (4H recommended) before being tested with.

ANN BTC MTF Golden Cross Period MACDHi, this is the MACD version of the ANN BTC Multi Timeframe Script.
The MACD Periods were approximated to the Golden Cross values.
MACD Lengths :
Signal Length = 25
Fast Length = 50
Slow Length = 200
Regards.

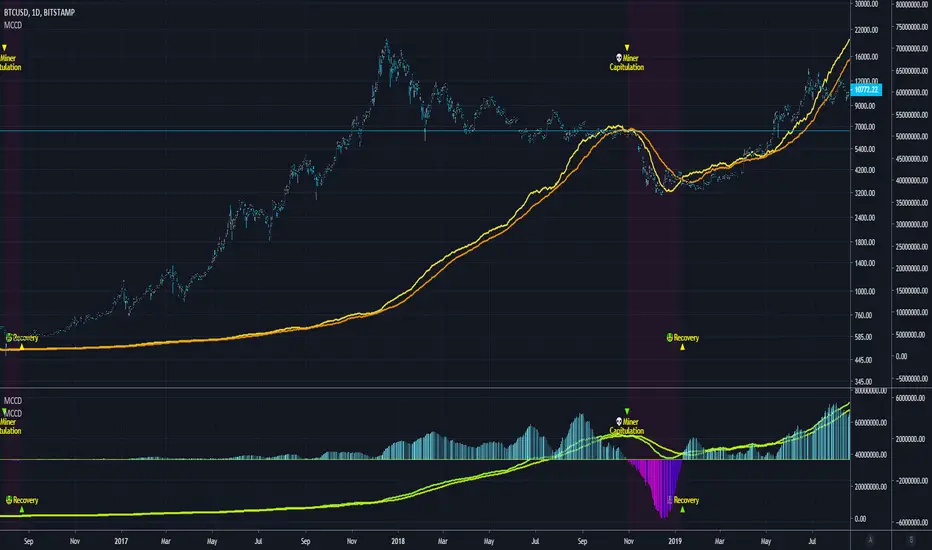
Blockchain Fundamentals - MCCD - Miner Capitulation Conv/Div🔗Blockchain Fundamentals - MCCD - Miner Capitulation & Convergence Divergence
(a.k.a. Hash Ribbons)
Intro
Miner Capitulation has been talked about alot recently in the news and on twitter. I wanted to join the in fun and add my own spin on things.
Description
This shows the 30 (yellow) and 60 (orange) day moving average of the hash rate of bitcoin. I added an option to show the convergence/divergence of the two moving averages in a visual manner similar to the MACD.
I also added the ability to select both the length and type of MA used in the calculation of the capitulation so you can experiment.
Other additions include bar coloration by trade state, and background highlighting of capitulation periods.
Editable Capitulation/Recovery plots will show clearly when the crosses happen.
The way to replicate my display is to add the indicator twice below the chart and combine in the same pane. First indicator displays the averages by default. The second one you enable convergence/divergence display option and uncheck the rest.
Last I add the indicator one more time and dragged it on chart. Do not combine the scales into one, of else it will ruin the scale (you want them separate scales). Its just showing you possibilities, use whatever works for you!
👍 We hope you enjoyed this indicator and find it useful! We post free crypto analysis, strategies and indicators regularly. This is our 73rd script on Tradingview!
💬Check my Signature for other information
Bollinger Bands on MacdOnly longs when Macd line is above Bollinger Band and shorts when Macd line is above Bollinger Band, this will avoid many problems.
thumbs up!!!

Mirror TSI-MACD by Trader JayI was playing around with the TSI-MACD and surprisingly it works quite well as a mirror.
There are 2 ways this can be used
1. Enter long when Blue line crosses up the Red
2. Exit long when Green line crosses the blue
or
1. Enter long when Blue line crosses up the Red
2. Exit long when Blue line crosses back down below the Red

Ori Visual MACDMACD is about a relationship between two Moving Averages. Visual Macd draws these two moving averages and shows MACD with color on them. It is helpful for understanding MACD.

McGinley Dynamic Convergence/Divergence [ChuckBanger]This is a MACD version with MaGinley Dynamic indicator invented by John R. McGinley. MaGinley Dynamic can be used as a moving average and is a highly reliable indicator. Here i use it instead of EMA witch normally is used to calculate MACD.
For more information of MaGinley Dynamic
www.investopedia.com
Schaff Trend Cycle w/ MACD HistogramWhat Is Schaff Trend Cycle? (Reference from Investopedia)
The Schaff Trend Cycle (STC) is a charting indicator that is commonly used to identify market trends and provide buy and sell signals to traders. Developed in 1999 by noted currency trader Doug Schaff, STC is a type of oscillator and is based on the assumption that, regardless of time frame, currency trends accelerate and decelerate in cyclical patterns.
How STC Works
Many traders are familiar with moving average convergence/divergence (MACD) charting tool, which is an indicator that is used to forecast price action and is notorious for lagging due to its slow responsive signal line . By contrast, STC’s signal line enables it to detect trends sooner. In fact, it typically identifies up and downtrends long before MACD indicator.
While STC is computed using the same exponential moving averages as MACD, it adds a novel cycle component to improve accuracy and reliability. While MACD is simply computed using a series of moving average, the cycle aspect of STC is based on time (e.g. number of days).
It should also be noted that, although STC was developed primarily for fast currency markets, it may be effectively employed across all markets, just like MACD. It can be applied to intraday charts, such as five minutes or one hour charts, as well as daily, weekly, or monthly time frames.
What's included the indicator?
Zero MACD lag algorithm (can be enabled/disabled)
MACD Histogram (has a different calculation to show the trend clearly. Can revert to original algo but will not truly reflect the current trend.)
Histogram peaks
STC pivots
How to use this indicator?
Use the STC overbought/oversold to determine trend strength.
Use the MACD zeroline crossover to determine the trend if bull/bear
For risky trades:
Long or cover when STC shows a bullish pivot. Exit or short on STC bear pivots
For conservative trades:
Long when MACD histogram crosses above midline. Exit or short on STC bear pivots
Settings:
Default is Fast - 5, Slow - 20. You can turn it up to Fast - 10, Slow - 30.
You can enable or disable certain features if you dont like to see them.
