Bulltrapp.com - KEY LEVELSBulltrapp.com - KEY LEVELS
A comprehensive all-in-one key levels indicator designed for serious traders who want to see the most important price levels at a glance.
📊 Features:
Daily Levels
Previous Day High/Low (PDH/PDL)
Daily Open (DO)
Weekly Levels
Current & Previous Week High/Low
Weekly Open (WO)
Monday Range
Monday High/Low - essential for weekly range analysis
Monthly Levels
Current & Previous Month High/Low
Monthly Open (MO)
Quarterly & Yearly Levels
Quarterly Open (QO)
Yearly High/Low/Open with Previous Year levels
Session Levels
Asian, London & New York session High/Low
Customizable session times (UTC based)
Opening Range
NY Opening Range (first 15 min)
London Opening Range (first 15 min)
Automatic Support/Resistance Detection
Pivot-based S/R detection with customizable lookback
Shows levels with the most touches (strongest zones)
Automatic merging of nearby levels to reduce clutter
Configurable sensitivity and history length
⚙️ Customization:
Fully customizable colors for each level type
Adjustable line width and style (Solid/Dashed/Dotted)
Label size options
Toggle each level group on/off independently
Works correctly with Heikin Ashi charts (uses real OHLC data)
📱 Built by Bulltrapp.com
This indicator is brought to you by Bulltrapp.com - your ultimate crypto portfolio tracker!
🚀 Track your entire portfolio across multiple exchanges and wallets in one place
📈 Real-time P&L tracking with detailed analytics
💰 Tax reporting made easy
🔔 Smart alerts for price movements and portfolio changes
Visit bulltrapp.com to take your trading to the next level!
If you find this indicator useful, please give it a ⭐ and leave a comment!
KEY

Support & Resistance Automated📌 Support and Resistance Automated (Pivot-Based)
Support and Resistance Automated is a lightweight and fully automated indicator that plots key support and resistance levels using pivot highs and pivot lows. It helps traders quickly identify important price reaction zones without manual drawing.
This indicator is especially useful for price-action traders, swing traders, and intraday traders who rely on clean charts and objective levels.
🔍 How It Works
Pivot Highs → Resistance Levels
Pivot Lows → Support Levels
Each detected pivot creates a horizontal dotted line that extends forward, allowing you to observe how price reacts over time.
Once a level is formed, it is kept permanently on the chart — no repainting, no disappearing levels.
⚙️ Customizable Settings
You can easily adjust:
Left & Right Pivot Bars – control how strong a pivot must be
Line Extension Length
Line Width
Support & Resistance Colors
Show / Hide Pivot Highs and Pivot Lows independently
This flexibility allows the indicator to adapt to intraday, swing, or higher-timeframe analysis.
✅ Key Features
✔ Fully automatic support & resistance detection
✔ Based on proven pivot-point logic
✔ No repainting
✔ Clean, minimal chart appearance
✔ Unlimited support & resistance levels
✔ Works on all timeframes & instruments
📈 Best Use Cases
Identifying key demand and supply zones
Planning entries, targets, and stop-losses
Confluence with price action, RSI, moving averages
Breakout and rejection-based strategies


Contrarian 100 MAPairs nicely with Enhanced-Stock-Ticker-with-50MA-vs-200MA located here:
Description
The Contrarian 100 MA is a sophisticated Pine Script v6 indicator designed for traders seeking to identify key market structure shifts and trend reversals using a combination of a 100-period Simple Moving Average (SMA) envelope and Inner Circle Trader (ICT) Break of Structure (BoS) and Market Structure Shift (MSS) logic. By overlaying a semi-transparent SMA-based shadow on the price chart and plotting bullish and bearish structure signals, this indicator helps traders visualize critical price levels and potential trend changes. It leverages higher timeframe (HTF) pivot points and dynamic logic to adapt to various chart timeframes, making it ideal for swing and contrarian trading strategies. Customizable colors, timeframes, and alert conditions enhance its versatility for manual and automated trading setups.
Key Features
SMA Envelope: Plots a 100-period SMA for high and low prices, creating a semi-transparent (50% opacity) purple shadow to highlight the price range and provide context for price movements.
ICT BoS/MSS Logic: Identifies Break of Structure (BoS) and Market Structure Shift (MSS) signals for both bullish and bearish conditions, based on HTF pivot points.
Dynamic Timeframe Support: Adjusts pivot detection based on user-selected HTF (default: 1D) and chart timeframe (1M, 5M, 15M, 30M, 1H, 4H, 1D), ensuring adaptability across markets.
Visual Signals: Draws dotted lines for BoS (bullish/bearish) and MSS (bullish/bearish) signals at pivot levels, with customizable colors for easy identification.
Contrarian Approach: Signals potential reversals by combining SMA context with ICT structure breaks, ideal for traders looking to capitalize on trend shifts.
Alert Conditions: Supports alerts for bullish/bearish BoS and MSS signals, enabling integration with TradingView’s alert system for automated trading.
Performance Optimization: Uses efficient pivot detection and line management to minimize resource usage while maintaining accuracy.
Technical Details
SMA Calculation:
Computes 100-period SMAs for high (smaHigh) and low (smaLow) prices.
Plots invisible SMAs (fully transparent) and fills the area between them with 50% transparent purple for visual context.
Pivot Detection:
Uses ta.pivothigh and ta.pivotlow to identify HTF swing points, with dynamic lookback periods (rlBars: 5 for daily, 2 for intraday).
Tracks pivot highs (pH, nPh) and lows (pL, nPl) using a custom piv type for price and time.
BoS/MSS Logic:
Bullish BoS: Triggered when price breaks above a pivot high in a bullish trend, drawing a line at the pivot level.
Bearish BoS: Triggered when price breaks below a pivot low in a bearish trend.
Bullish MSS: Occurs when price breaks a pivot high in a bearish trend, signaling a potential trend reversal.
Bearish MSS: Occurs when price breaks a pivot low in a bullish trend.
Lines are drawn using line.new with xloc.bar_time for precise alignment, styled as dotted with customizable colors.
HTF Integration: Fetches HTF close prices and pivot data using request.security with lookahead_on for accurate signal timing.
Line Management: Maintains an array of lines (lin), removing outdated lines when new MSS signals occur to keep the chart clean.
Pivot Reset: Clears broken pivots (e.g., when price exceeds a pivot high or falls below a pivot low) to ensure fresh signal generation.
How to Use
Add to Chart:
Copy the script into TradingView’s Pine Editor and apply it to your chart.
Configure Settings:
SMA Length: Adjust the SMA period (default: 100 bars) to suit your trading style.
Structure Timeframe: Set the HTF for pivot detection (default: 1D).
Chart Timeframe: Select the chart timeframe (1M, 5M, 15M, 30M, 1H, 4H, 1D) to adjust pivot sensitivity.
Colors: Customize bullish/bearish BoS and MSS line colors via input settings.
Interpret Signals:
Bullish BoS: White dotted line (default) at a broken pivot high in a bullish trend, indicating trend continuation.
Bearish BoS: White dotted line at a broken pivot low in a bearish trend.
Bullish MSS: White dotted line at a broken pivot high in a bearish trend, suggesting a reversal to bullish.
Bearish MSS: White dotted line at a broken pivot low in a bullish trend, suggesting a reversal to bearish.
Use the SMA shadow to gauge price position within the recent range.
Set Alerts:
Create alerts for bullish/bearish BoS and MSS signals using TradingView’s alert system.
Customize Visuals:
Adjust line colors or SMA fill transparency via TradingView’s settings for better visibility.
Example Use Cases
Swing Trading: Use MSS signals to enter trades at potential trend reversals, with the SMA envelope confirming price extremes.
Contrarian Trading: Capitalize on BoS and MSS signals to trade against prevailing trends, using the SMA shadow for context.
Automated Trading: Integrate BoS/MSS alerts with trading bots for systematic entries and exits.
Multi-Timeframe Analysis: Combine HTF signals (e.g., 1D) with lower timeframe charts (e.g., 1H) for precise entries.
Notes
Testing: Backtest the indicator on your chosen market and timeframe to validate performance.
Compatibility: Built for Pine Script v6 and tested on TradingView as of June 19, 2025.
Limitations: Signals rely on HTF pivot accuracy, which may lag in fast-moving markets. Adjust rlBars or timeframe for sensitivity.
Optional Enhancements: Consider uncommenting or adding a histogram for SMA divergence (e.g., smaHigh - smaLow) for additional insights.
Acknowledgments
This indicator combines ICT’s market structure concepts with a dynamic SMA envelope to provide a unique contrarian trading tool. Share your feedback or suggestions in the TradingView comments, and happy trading!

Key Levels// How it Works \\
Calculating Previous Days, Weeks and Monthly open, high, low, close and vwaps
Plots these levels on your chart
// Settings \\
You can enable/disable any of the levels you want to see
You can also change the amount of bars back the levels are plotted back to
// Use Case \\
These levels are often used in different methods of Technical analysis for support and resistance.
// Suggestions \\
Happy for anyone to make any suggestions on changes which could improve the script,
// Terms \\
Feel free to use the script, If you do use the script could you please just tag me as I am interested to see how people are using it. Good Luck!

Key Levels (Time Frames - Weekly,Monthly,Quarterly,Yearly)This indicator plots the 4h, Daily, Weekly, Monthly, Quarterly, Yearly Open High, Low and Mids.
You can watch how these institutional trading levels work as support and resistance.
Most Important you can add alerts to these levels with a few clicks.
Just add/remove unnecessary levels for scaling problems.
For any error/suggestion/improvement just let me know.

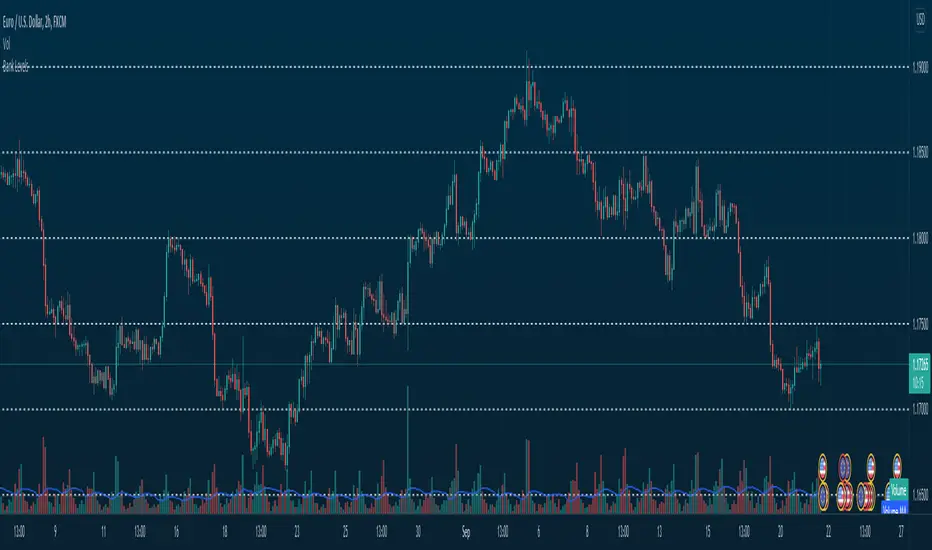
Bank Levels - Psychological Levels - Bitcoin, Indices, ForexThis got removed so I'm publishing it again.
What it is:
- This script draws in levels refereed to as bank levels. They are basically psychological/even numbers(40000, 45000, 150, 1850..)
Why doesn't it work on some charts?
- Each pair has a different tick value. You will have to edit the code to make it work on certain pairs. It's pretty simple, take a look.
Key price levelsFunction: labelling recent highs and lows automatically. Easy and clean.
In this example, we can see the previous low of the ticker is around 105.5, the previous high is around 120.
We can set up our entries and exits by referring to the last lows and highs.
Users can adjust the searching bar range by themselves.

Fractals | Swing Points | Highs & Lows | Custom PeriodsSimple script which marks out key swing highs & lows.
One of the only indicators I have on the chart most days
- perfect for naked charting
- quickly helps you to visually identify key areas of interest
An extension of Bill Williams fractals
- aka short term swing points
Allows you to filter for only the most prominent swing points
- you can even overlay multiple swingpoint filters in different colours (as per example chart)
The number ( Fractal Periods) is simply:
- the number of less prominent points either side of your swing high/low
- example shown on the chart
Otherwise make a fist
- look at your 5 knuckles
- swing high is your middle knuckle
- 2 lower points either side
Bill Williams Original Fractal:
Fractal Periods = 2
Your Fractal Period for Filtering:
3, 4, 5, 30, 365, etc
Allows you to find swing points down to:
Fractal Periods = 1
Simple, easy, shared to enjoy =)

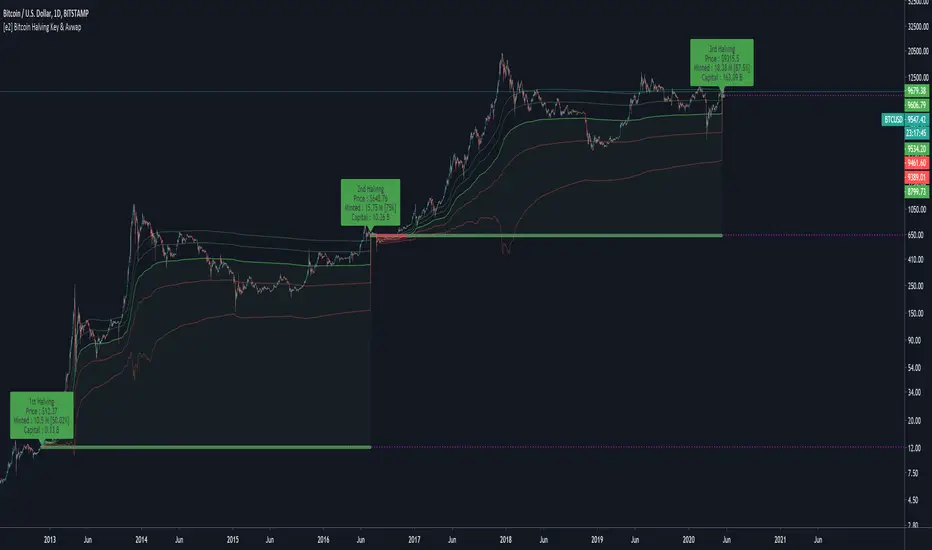
[e2] Bitcoin Halving Key & AvwapThis indicator shows a Key Level Support & Resistance level and VWAP that reset on your choice of the Bitcoin's halving date.
Optional Key Calculation Mode:
- Start with first (2012) or second (2016) halving date.
- Start with first and reset on the second (Halving to halving mode)
- Start with every next halving simultaneously (Halving + halving mode)
Labels show the Market Capitalization, total minted Bitcoins and Bitcoin's close price on the halving's date.
A maximum of 5 bands calculated using a factor of the anchored VWAP's standard deviation can be displayed.
Note
- The script is designed for Bitcoin markets only.
- Estimated 3rd halving, script will be updated when next halving occurs.
[e2] EDS Key & AvwapThis indicator shows a Key Level Support & Resistance level and VWAP that resets on your choice of the stock's Earnings , Dividends or Splits release date.
A maximum of 8 bands calculated using a factor of the anchored VWAP's standard deviation can be displayed.
Note
The script is designed for stock-trading only.
Credits
Inspired by timwest , LazyBear 's Earnings S/R Levels and MichelT 's Earnings, Splits, Dividends scripts.

Key Reversal Up Backtest
A key reversal is a one-day trading pattern that may signal the reversal of a trend.
Other frequently-used names for key reversal include "one-day reversal" and "reversal day."
How Does a Key Reversal Work?
Depending on which way the stock is trending, a key reversal day occurs when:
In an uptrend -- prices hit a new high and then close near the previous day's lows.
In a downtrend -- prices hit a new low, but close near the previous day's highs
WARNING:
- For purpose educate only
- This script to change bars colors.

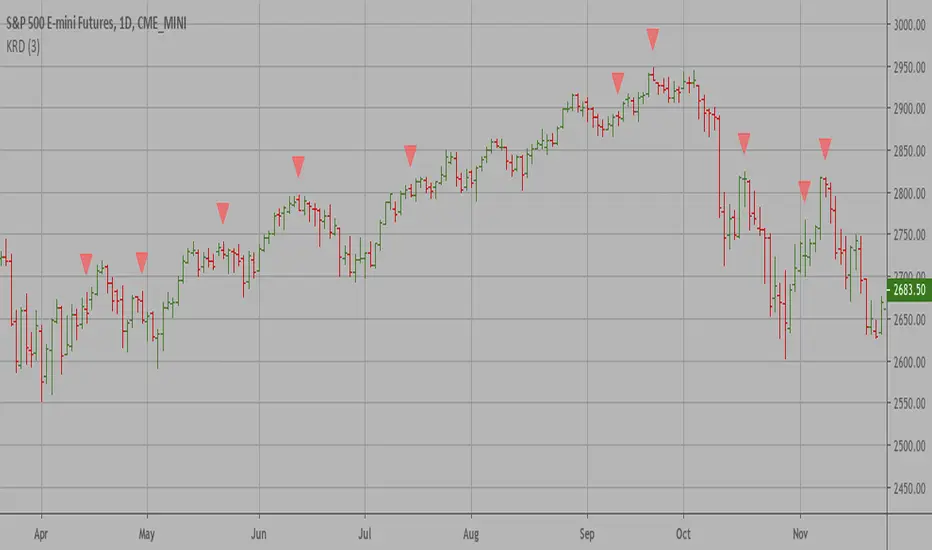
Key Reversal Down Backtest A key reversal is a one-day trading pattern that may signal the reversal of a trend.
Other frequently-used names for key reversal include "one-day reversal" and "reversal day."
How Does a Key Reversal Work?
Depending on which way the stock is trending, a key reversal day occurs when:
In an uptrend -- prices hit a new high and then close near the previous day's lows.
In a downtrend -- prices hit a new low, but close near the previous day's highs
WARNING:
- For purpose educate only
- This script to change bars colors.

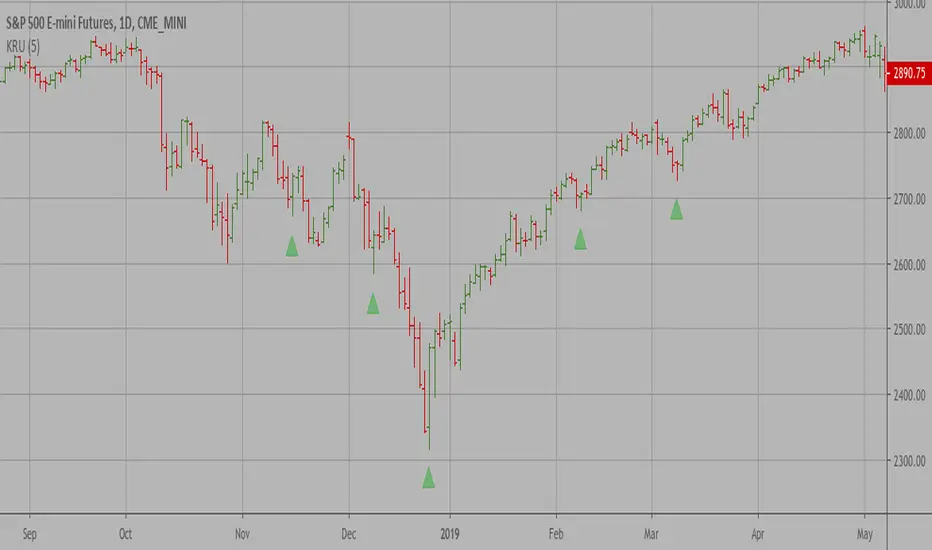
Key Reversal Up A key reversal is a one-day trading pattern that may signal the reversal of a trend.
Other frequently-used names for key reversal include "one-day reversal" and "reversal day."
How Does a Key Reversal Work?
Depending on which way the stock is trending, a key reversal day occurs when:
In an uptrend -- prices hit a new high and then close near the previous day's lows.
In a downtrend -- prices hit a new low, but close near the previous day's highs
Key Reversal Down A key reversal is a one-day trading pattern that may signal the reversal of a trend.
Other frequently-used names for key reversal include "one-day reversal" and "reversal day."
How Does a Key Reversal Work?
Depending on which way the stock is trending, a key reversal day occurs when:
In an uptrend -- prices hit a new high and then close near the previous day's lows.
In a downtrend -- prices hit a new low, but close near the previous day's highs