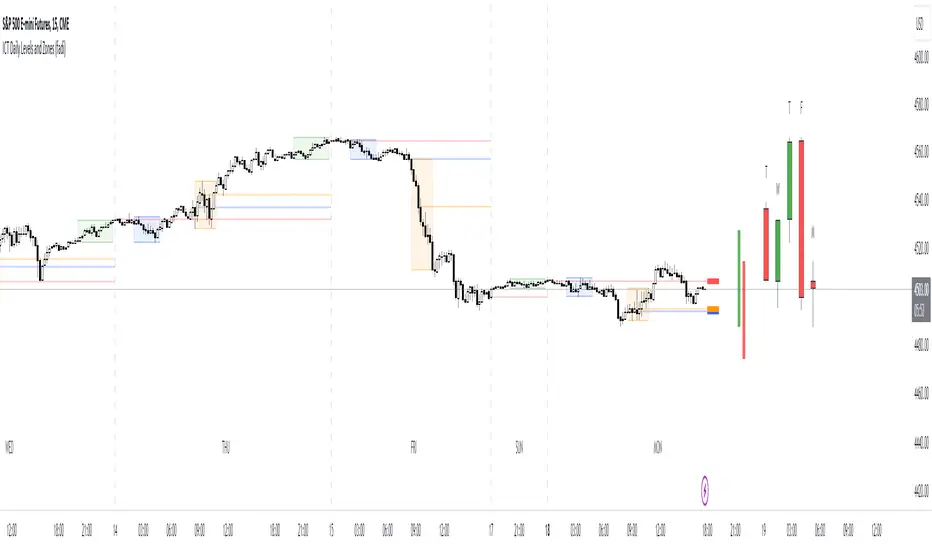
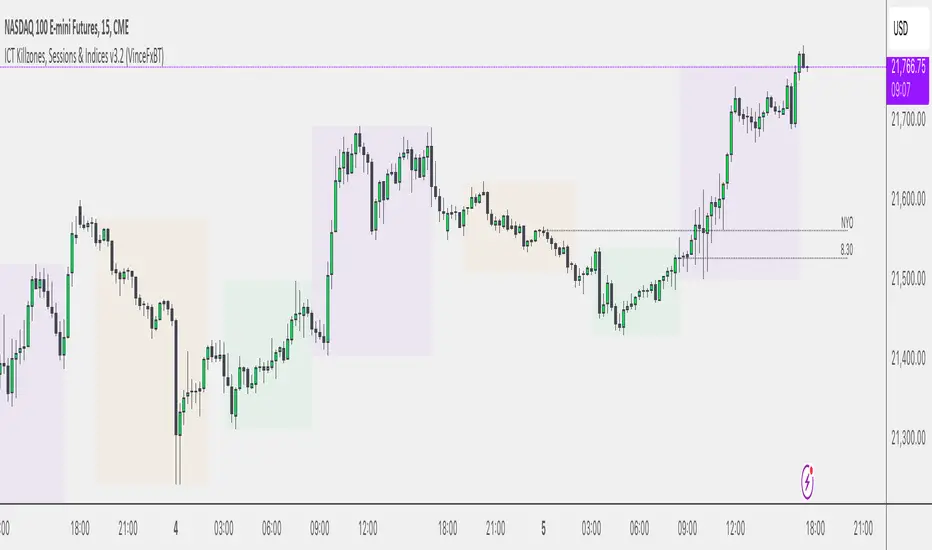
ICT Daily Levels and Zones (fadi)ICT Daily Levels and Zones indicator provides some of the relevant zones and levels for ICT type analysis. The purpose of this indicator is to provide consolidated way of automatically highlighting and identifying relevant levels for ICT type traders.
Daily Separator and Day of Week
Display a separator based on NY Midnight and day of week.
Killzones
Highlight ICT Asia, London, and NY killzones. Please note that the default times are based on Index Futures. Update the times of day if you plan on using it for other instruments such as Forex.
Open Range
The 9:30am to 10:00am open range
(Shown with Extend setting on)
Open Range Gap
The open range Gap is the difference between the 4:15pm close and the 9:30am open.
(Shown with Extend setting on)
Time of Day Levels
The Midnight, 8:30am, and 9:30am open levels.
Daily Midnight Candle
ICT style Daily candle formation based on Midnight open
Killzones
ICT Killzones + Pivots [TFO]Designed with the help of TTrades and with inspiration from the ICT Everything indicator by coldbrewrosh, the purpose of this script is to identify ICT Killzones while also storing their highs and lows for future reference, until traded through.
There are 5 Killzones / sessions whose times and labels can all be changed to one's liking. Some prefer slight alterations to traditional ICT Killzones, or use different time windows altogether. Either way, the sessions are fully customizable. The sessions will auto fit to keep track of the highs and lows made during their respective times, and these pivots will be extended until they are invalidated.
There are also 4 optional Open Price lines and 4 vertical Timestamps, where the user can change the time and style of each one as well.
To help maintain a clean chart, we can implement a Cutoff Time where all drawings will stop extending past a certain point. The indicator will apply this logic by default, as it can get messy with multiple drawings starting and stopping throughout the day at different times.
Given the amount of interest I've received about this indicator, I intend to leave it open to suggestions for further improvements. Let me know what you think & what you want to see added!

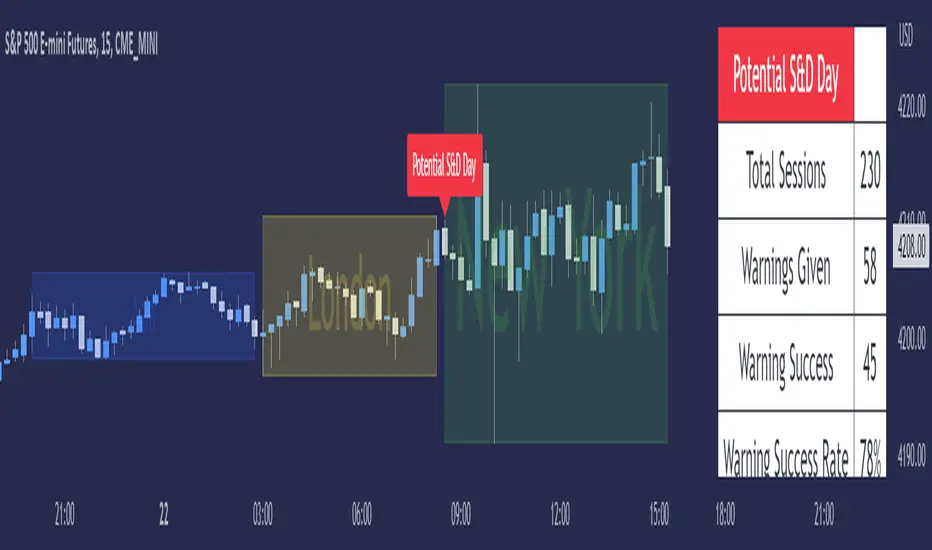
ICT Seek & Destroy Profile [TFO]The goal of this indicator is to anticipate potentially "choppy" New York trading sessions, based on what price does during the Asia and London trading sessions. Based on some user-defined success criteria, we can also track how successful these warnings are.
Many Inner Circle Trader (ICT) students have noted that choppy New York sessions are often preceded by erratic London sessions which take both the high and low of the Asian range.
When this criteria is true and warnings are enabled, a table will automatically populate with a custom warning message for the duration of the NY session, indicating to the user that it could be a choppy trading day.
We can measure and track the success rate of these warnings via the following success criteria:
- NY stays within London range
- NY exceeds London high and low
- NY closes within London range
- NY range is too small
The first three criteria should be self explanatory - the NY range either stays within the London high & low, exceeds them both, or closes within them.
The last criteria is a measure of the New York range compared to a user defined standard deviation of all historical ranges (for the number of sessions that the current chart can load). The default value of 1.5 would imply that a "successful" S&D day could be if the NY range (from high to low) was less than or equal to 1.5 standard deviations of all past ranges.
All these options can be toggled on/off as well, for those that only want to consider certain success criteria and not others. When any of the selected success criteria are true, that essentially indicates that the current session's warning was successful.
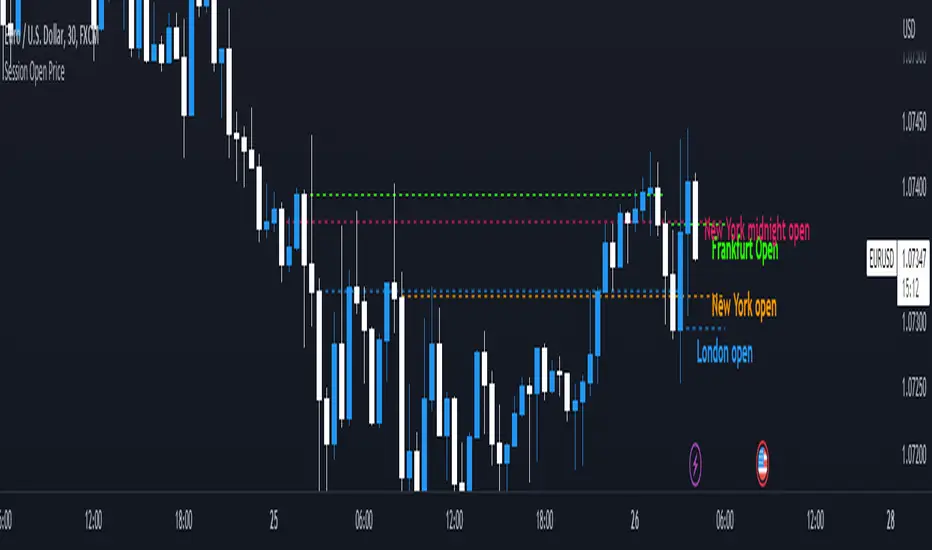
Session Open PriceThis Indicator displays the ICT kill zones' open price
You will be able to see the following open prices (ALL TIMES ARE IN NEW YORK TIME)
All times and appearances are customisable to your own liking.
The default time setting is recommended
- 00:00 AM Midnight New York Open Price (RED DASH LINE)
- 2:00 AM Frankfurt Open Price (GREEN DASH LINE)
- 3:00 AM London Open Price (BLUE DASH LINE)
- 8:30 AM New York Open Price (ORANGE DASH LINE)
HOW TO USE SESSION OPEN PRICE IN YOUR TRADING
If the price is above the opening price you only look for sells whereas if the price is under the opening price you only look for buys
BUY EXAMPLE
Wait for Midnight New York and Frankfurt open price to display
The price must be under both prices
Look for a Market maker buy model or your own entry model
Stoploss will be at the swing low and Take profit can be a fixed RR or how you calculate your take profit level
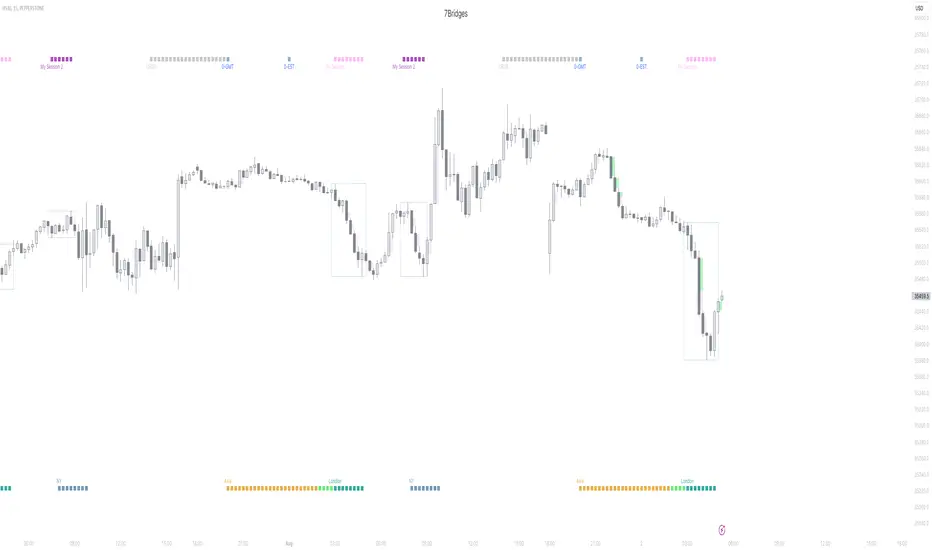
Session KillZones [7Bridges]Session Killzones by 7Bridges indicator display the killzones of asian, LND and NY sessions. There is also a custom session of your choice.
The times of each killzone are GMT time and you can adjust it in the settings.
You have also the beginning of the day, GMT and EST timezones.
By default the killzones are set like that on the GMT/UTC timezone :
-> Asia : 00:00 - 06:00
-> Pre London : 06:00 - 07:00
-> London : 07:00 - 10:00
-> New York : 12:00 - 15:00
-> Custom session : choose your own time
What makes the indicator very different is that the session is not overlapping the price but you have bars below and above the price.
Settings:
-> you can chose to display the Killzones (Asia, pre LND, LND and NY)
-> you can manages the time of the sessions
-> you can chose to display the start of the day (GMT/UTC and EST )
The indicator is displayed by default only for all the timeframes below 60min.
Market Profile @joshuuuTime is fractal. Every candle has an open, low, high and closing price.
Depending on what timeframe you are on, some opening prices could be more interesting than others.
This indicator tracks, which timeframe you are currently on and displays different things accordingly, so that the chart is never messy.
Below the hourly timeframe, the indicator highlights ICT Killzones, times of the day where most volume occurs and price moves the "cleanest". There are different versions to display those sessions in the settings.
From the hourly timeframe up to the daily timeframe, the indicator shows the "Weekly Profile". It plots the weekly opening line, can highlight daily highs and lows and daily opens and shows the name of the days on the chart.
On the daily timeframe, the indicator switches to a monthly profile. It shows the monthly open, weekly highs/lows AND it shows another concept taught by ICT, the IPDA Lookback.
ICT teaches that especially the last 20, 40 and 60 days PD Arrays and Highs/Lows are important and this indicator highlights those lookback windows accordingly.
The indicator has a lot of settings to make it allow maximum individuality.

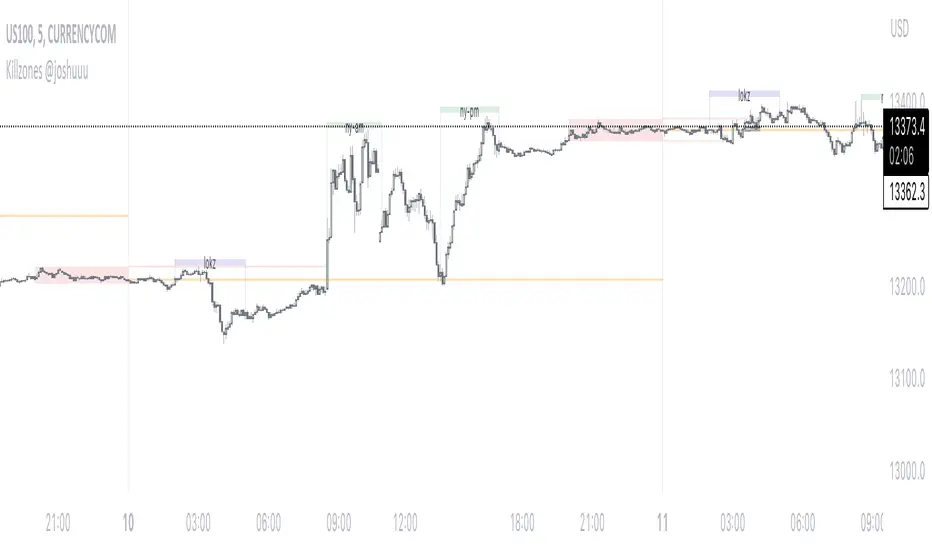
Killzones @joshuuuThis Indicator is based on "ICT Killzones" - sessions in which price moves the "cleanest" and usually has the most volume.
The script is able to either display Killzones as a Label above current bars, or in form of lines on top or bottom of the charts.
Also, the user is able to choose between Forex Killzones and Indices Killzones.
times for killzones:
Forex
-London 0200-0500
-NY 0700-1000
Indices
-London 0200-0500
-NY AM 0830-1100
-NY PM 1330-1600
⚠️ Open Source ⚠️
Coders and TV users are authorized to copy this code base, but a paid distribution is prohibited. A mention to the original author is expected, and appreciated.
⚠️ Terms and Conditions ⚠️
This financial tool is for educational purposes only and not financial advice. Users assume responsibility for decisions made based on the tool's information. Past performance doesn't guarantee future results. By using this tool, users agree to these terms.
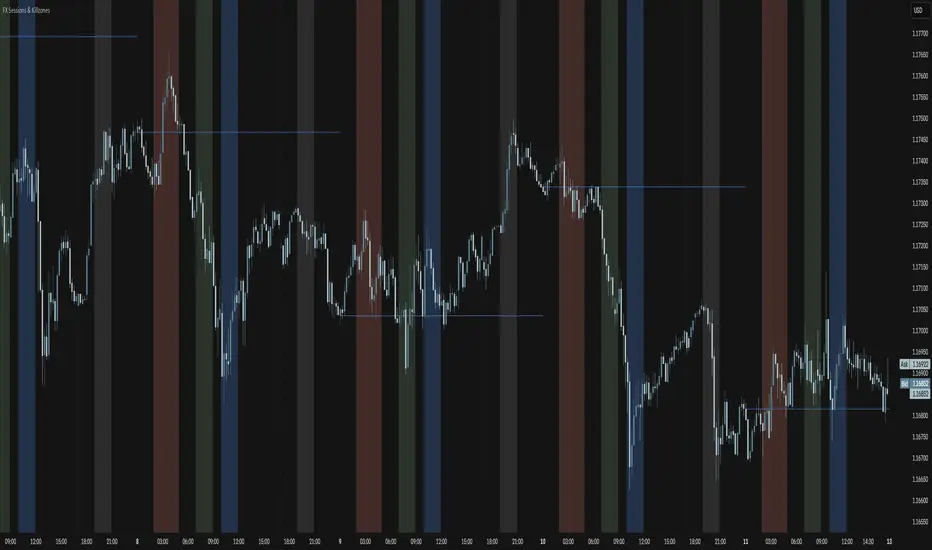
FX Sessions & Killzones ETJust another sessions indicator. Among all the many existing ones, I didn't find anything simple that would cover my needs and that would actually be correct.
New York time is forced here for plotting the stripes so you don't need to worry about the time zone currently set on your chart. The indicator will be accurate during Daylight Saving Time (which, in 2023 for example, started on Sunday, 12 March , 02:00:00 and will be in effect until Sunday, 5 November, 02:00:00).
Diddly - Liquidity ZonesDiddly Liquidity Zones is an indicator to highlight where the liquidity exists in a market place.
What is Liquidity
Liquidity refers to the ability of an asset to be turned into cash. Cash is the more liquid form of any asset, whereas selling a house would take a little longer to liquidate and convert to cash.
Liquidity in financial markets is in essence based on the same principle and refers to how easily an asset can be bought and sold.
Liquidity in simple terms is the volume of participants who are willing to be involved in the market at any given time. Markets are based on auction theory, the more participants who want to buy at a certain price than sell, will dictate that the price goes up. As a result it is important to understand the role that volume has in financial markets, as volume will directly correlate to liquidity and supply and demand.
What does it mean?
Areas of abnormal liquidity and volume can lead to a price range where there is high supply and demand, which in turn can become a zone that forms a support and resistance level in the future. As we all know what happens in the past does not mean it will happen in the future, but what liquidity zones will tell us is that in the past a higher number of people were interested in doing business at those prices, which is critical information when making trading decisions.
Although markets are based on auction theory, sadly we don't have the advantage of a traditional auction, where we are all sitting in a room putting our hands in the air when we are interested in paying x price for a particular item. In this environment it is very clear to see how popular the item for sale is and whether it is possible to pick up a bargain.
Being able to identify liquidity areas on a chart, provides an insight into market sentiment at a given price range. Also we have to consider that typically most retail traders participate in very liquid markets, where you can get in and out of a position with relative ease.
There are obviously exceptions, extremely low float stocks, but on the whole with liquid assets it takes some big orders to move price, especially with currencies and high float stocks. Understanding these principles helps us as retail traders identify where the big money is seeing a bargain, if buying or overpriced if selling.
However you identify liquidity, I hope you agree that it is an extremely important element to be considering before taking a trade. The last thing any trader wants to be doing if they can help it, is selling where the market perceives price to be a bargain and buying when overpriced.
Just as a side note, high and low "Float Stocks" refers to the number of shares in general circulation for buying and selling.
What is Diddly Liquidity Zones
This liquidity zones indicator in simple terms will plot zones on the chart and make an assessment of whether this is predominately buying or selling liquidity. Price will frequently come back to test areas of liquidity before making any further continuation in a specific direction. This is why liquidity zones are often described as areas of support and resistance.
How does it Work
To identify these zones the indicator is looking at a number of pieces of information predominantly based on volume.
Volume
Rate of Change
Relative Strength
From these calculations the algorithm is then looking for the standard deviation away from the normal, to identify exceptions that then become the liquidity zones. These can be classified up to 4 levels, the first being the weakest exception to four being the strongest. By default 3 levels are displayed.
What is the Indicator Showing me?
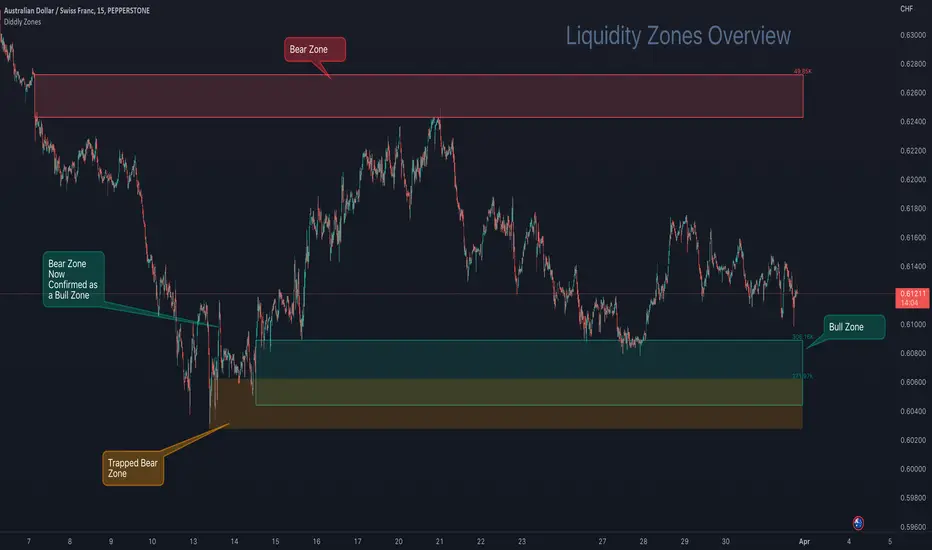
The Liquidity Zones indicator comprises two basic elements: Bull Zones and Bear Zones.
Zones that are not broken in the past are projected forward and can act as strong support and resistance levels that can also be used for targets or ignoring a trade due to lack of room above or below.
Here on AUDCHF 15 minute chart, during March 2023, it provides an example of the three indicator zone types. Details have been annotated on the chart.
The third type of zone is a “Trap Zone” which can be extremely powerful for identifying potential reversals. A Trap Zone can be either Trapped Buyers or Trapper Sellers. In essence it is a Zone that is identified, but price can never trade above or below in the direction of the zone.
As an example if a bear zone is identified and price fails to trade below the lower edge and bounces immediately out of the top. The trap is set and the indicator changes the zone from the default green (bull) or red (bear) zone to a different colour, which is orange by default.
As price moves higher away from the zone, those in their short positions start to feel the pain. The higher the move away before a retracement the higher the pain. When the retracement finally comes and price returns to the zone, you will often see price bounce off the zone for the move back to retest the highs, following the same principles of support and resistance.
In this example above a resistance level is broken, which has been identified by a volume exception identified by the indicator, when price returns to that area it now becomes support as those traders in short positions look to cover at breakeven.
Here on EURUSD 15 minute chart, during the last week in March 2023, it provides a great example of a "trap zone" setup. Details have been annotated on the chart.
Usage
This indicator will compliment any existing strategy or could be traded as part of a support and resistance trading strategy. One of the great advantages of support and resistance is that levels and zones are identified ahead of time, so trades can be planned and considered well in advance.
There is also the advantage of where to stop out, once a support or resistance level is broken then we no longer want to be in that trade. We have to accept the facts that the market sentiment has changed and no longer sees price here as good value for bull zones or overpriced at bear zones.
You will sometimes see spikes of price through a zone, where the market has grabbed the liquidity in the form of stops on the other-side, which can be extremely frustrating as a trader, but important to understand that it does happen and why it is happening.
You will find liquidity zones on all charts, from the daily to the 1 second chart. The higher the timeframe, the wider the zones are. As a result we would not recommend planning an entry purely on a daily zone, but it is extremely useful information when drilling into the lower time frame charts. So using multiple timeframe analysis is a really useful technique when looking to understand a market.
There are a number of elements to consider before taking entries around support and resistance levels. The most important thing to remember is these levels have to break at some point, otherwise price would never go anywhere. Understanding that these levels can fail is important and is the reason we should always have clearly defined stops and manage risk.
You may also want to consider higher timeframe trend analysis to try and ensure you are trading with the trend. First and second retests work better as these zones will weaken over multiple retests as traders give up on that area, as it no longer is giving the reactions of price that it used to.
The easiest entry method when working with support and resistance levels, is to place limit orders in the market. This is not a recommended approach, although it can be useful for traders who can't sit in front of charts all day. By taking this approach you would want to ensure that you are trading with the predominant trend on a higher timeframe and are in effect using these levels on a lower timeframe as pullback entries. You would also want to ensure that you have a wide enough stop to ensure that any spikes through don't stop out the trade, so using an Average True Range multiplier can be very helpful. The key point is don't oversize and manage risk.
A better approach to identifying entries would be to look at price action on a lower time frame chart, once price has arrived at the level.
A more conservative approach would be to wait for price to close outside the zone in the direction you want to trade on the signal chart and look for an entry on the retest of the top of the zone for buys or the bottom of the zone for the sells, with the stop the other-side of the zone.
For the purpose of examples we will focus on the last two methods, although there are many sources of information on how to trade support and resistance levels, so please don't take the above as the only way to plan or take entries.
Multiple Timeframe Alignment
Here on a stock asset MSFT (Microsoft), we have a zoomed out 15 minute chart. The top left is August 2022 and the bottom right is November 2022, which is quite a sell-off and there were many opportunities to the short side, although many traders would have been looking to see when this stock was at a bargain price.
Here on the 7th November 2022, there were the first signs of a potential change in market sentiment, as the indicator identified a Bull Zone on the 15 minute chart. At this stage the stock has been beaten up for a long time and there is a Bear Zone, above price - so not much distance to get a decent risk reward trade as yet.
Then on the Thursday of the same week, price came back to test the high of this previously created Bull Zone, after being rejected from the Bear Zone above.
So drilling into the 1 minute chart to find good risk : reward entries, price at the opening bell explodes through Bear Zones in the above chart and prints a big 1 minute Bull Zone. This on its own would be hard to trade, is it a fake out? price must surely retrace before a move higher, also there is a trapped buyers zone above price, so there will be a lot of liquidity and sell orders at that level.
Here again on the 1 minute chart, we see the breakout of the orange zone with a new Bull Zone (which is coloured blue, being a 2nd level zone) . Now we just want to see this zone being confirmed by breaking the top and then we would look for entries on the retest.
Price action is now ready for taking a buy entry for a short-term swing trade as illustrated on the next chart.
About a month later the price hit the target, as shown on the 4 hour chart.
The target was set on the 15 min chart, being the next substantial level of a bear zone. Also on the 1 hour chart above, a big green bull zone of liquidity was identified, so there's a fair chance that price will come back to retest liquidity before a greater move away. The trade planner has been removed from this chart, so it is easier to see the printed zones, but the entry was at the 238.00
You will see since January 2023 there have been many opportunities on this stock using the 15 minute chart to find zones to trades and manage risk. The one thing that is clear in this chart is where the market sentiment was on this stock as it made the run-up to current price.
Alerting
Utilising the power of TradingView Alerts enables you to monitor many pairs, when you are away from your charts. You can set up alert for the indicator, by right-clicking on a zone that you see on a chart and choose the first option that appears on the menu "Add Alert to Diddly Zones". You can also perform the same operation from the indicator tile that appears in the top left corner of the chart.
Within setting you can choose to be alerted under the following conditions:
When New Bull Zone has been Identified
When New Bear Zone has been Identified
When Price approaches a Bear Zone from below. Notifying traders that we are approaching a resistance level
When Price approaches a Bull Zone from above. Notifying traders that we are approaching a support level
When Price is Trading inside a Zone at a certain configurable time.
On the last point above: This is useful on a slightly higher timeframe, where large zones exist and you may want to be notified if this asset is trading in a zone at say the London open. You would have already been sent an alert telling you price was arriving at the zone, but that could have been a couple of days ago.
Key Settings
Within the indicator settings there are a number of options that are available to users. From changing the colours and their transparency of different zone types, to the number of exception levels that you want to see on the chart.
The most important ones that are in need of explanation are outline below:
To simplify the settings, the indicator is configured by using a similar analogy to driving style. The reason this is needed is because different assets and asset classes have different levels of liquidity, as a result the indicator requires some basic information to provide the best results. The principle being the faster you drive the more zones you will encounter.
To continue with the analogy, it is important not to drive too fast on a particular asset otherwise all you will see is zones and nowhere for price to go. If this is the case, slow the setting down or go to a higher time frame for a broader perspective.
Settings
"Determine Algo Driving Style" : Available options = "Slow", "Steady", "Sports", "Racing", "Rocket" (Default Setting = Sports)
So this is setting the speed of the indicator
"Turn on Turbo Mode" : True or False (Default Settings = True)
This setting will give the indicator a boost
"What type of asset is the Algo looking at" : Available Options = "Small Caps", "Large Caps", "Futures", "Currencies" (Default Setting = Currencies)
The only difference in these settings currently is a magnification element that is applied to the calculations, which is particularly relevant for highly liquid assets like currencies, futures and large cap stock. The only option that by default does not use the magnification element is Small Cap low float stocks, where liquidity is lower this setting is not required. This magnification can be change later in the settings under "Zone Identification Calculation Models"
Finally
We greatly appreciate the support and feedback from the Trading View community, and we are dedicated to continuing to improve our indicators with your support.
We want to help you manage risk, and that's why we emphasise that trading is risky and any technology used to support our trading decisions is based on information from the past. We encourage traders to take responsibility for their trading businesses and always prioritise risk management.
Diddly - Charts (Asian, London & New York Session + Weekdays)Overview:
Diddly Charts is for providing intraday context to where we are in the market. It does this through a series of ranges displayed throughout the day, typically broken down into the Asian, London, and New York sessions.
This indicator also highlights key market structures like monthly, weekly, and previous day's highs and lows. Lines are provided for weekday and weekend separators, with the days of the week at the bottom of the chart, making it extremely useful for traders when identifying weekly cycles.
Usage:
All aspects of this indicator are changeable within the settings, allowing you to utilise the elements that are most important to your trading strategy.
The default layout is extremely useful for currency pairs, where traders use the London and New York boxes as windows of when to engage with the market. The times of these trading sessions can be changed to suit the trading periods that you want to trade.
Adhering to trading windows can help improve discipline to ensure that you are only taking entries within the time periods that match your trading strategy.
Some traders prefer a cleaner interface and don't want any indicator to detract from the price action they are reading, this can be achieved through changing the colour and their transparency in settings. In this example, you will see different labels used to annotate key structures, these can be changed to something that is relevant to your strategy in the settings.
It can also be used for trading Stocks where sessions are broken down into pre-market, market hours and post-market. This can be helpful to see those stocks that breakout of pre-market session highs and lows and also provide trading windows to keep traders out of trades that do not comply with their trading strategy.
Using higher time frames like a 4 hour chart or even the 1 hour chart, the intraday sessions are hidden away so traders can get a broader perspective without the clutter when zooming out. Although there are options to turn it on if you would prefer.
Here on a zoomed out 1 hour chart we have the option to only display the weekly line separator, which can help get an overview of weekly cycles.
Helpful Information
The main setting that you may want to change is at the top of the indicator settings, which is asking "what asset type" is the symbol being looked at. The indicator needs to know how to display the session range information. For example for currencies, the range size will be displayed in pips. For stocks or Futures it would display the financial amount. Beyond the visual display of information, this setting has no other impact on the indicator behaviour. The default setting is "Currencies".
We often get asked what the labels that appear on the chart mean. These can all be changed to your requirements, but by default what you will see when you apply the indicator to the chart is:
Under the Asian Range appears a couple of labels.
A = x : This is the range size of the session in pips for forex or amount for other assets, from the lowest to the highest price traded during that window.
ADR = y : This is the Average Daily Range over the last 21 days for this ticker
Under the London and New York session you will see a L = x or NY = y . This is the range size of each session in pips for forex or amount for other assets.
Structure Labels
YH = Yesterday's High
YL = Yesterday's Low
WH = Current Week's High
WL = Current Week's Low
MH = Current Month's High
ML = Current Month's Low
We greatly appreciate the support and feedback from the Trading View community, and we are dedicated to continuing to improve our indicators with your support.
We want to help you manage risk, and that's why we emphasise that trading is risky and any technology used to support our trading decisions is based on information from the past. We encourage traders to take responsibility for their trading businesses and always prioritise risk management.

ICT Macros by CryptoforICT Macros by Cryptofor
Time periods in which the price is most volatile. At this time, the algorithm is programmed to attack liquidity or fill a significant FVG from which the OF can continue.
Plots of macros:
1. London Macros:
02:33 - 03:00
04:03 - 04:30
2. New York AM Macros:
08:50 - 09:10
09:50 - 10:10
10:50 - 11:10
3. New York Lunch + PM Macros:
11:50 - 12:10
13:10 - 13:40
15:15 - 15:45
Features:
Flexible line settings
Flexible text settings
Display data for all time or for the last 24 hours
Switch for each type of macro
Macro background color settings

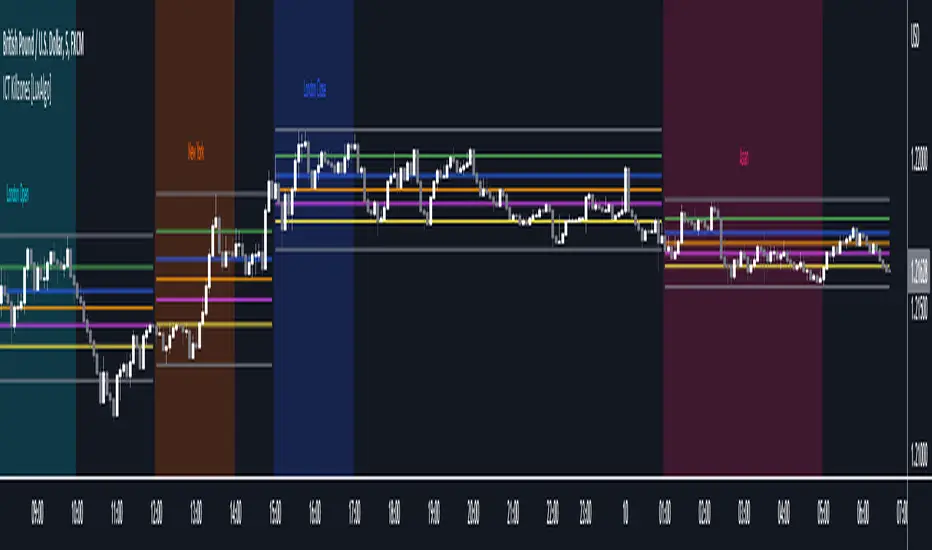
ICT Killzones [LuxAlgo]This script highlights ICT Killzones on the chart along with Fibonacci retracements constructed from each Killzone's price range, allowing traders to find more optimal entries.
Settings
Killzone Retracements
Show Retracements: Determines whether Fibonacci retracements are displayed on the chart.
Extend: Determines if the retracements are extended outside the Killzone.
Reverse: Switches the maximum and minimum levels for the calculation of the retracements.
Other settings allow disabling as well as changing the retracement value and color.
Usage
Killzones are introduced by forex trader ICT and represent different time intervals that aims at offering optimal trade entries. Killzones include:
New York Killzone (7:9 ET)
London Open Killzone (2:5 ET)
London Close Killzone (10:12 ET)
Asian Killzone (20:00 ET)
Note that using timeframes superior to 1h can highlight incorrect intervals
Fibonacci retracements on an active Killzone are subject to changes, if no Killzones are active then the associated Fibonacci retracements will stay at their current level.
Disabling specific Killzones while having extended retracements will allow them to extend further. In the image above the New York and Asian Killzones are disabled.
ICT Killzone by JeawThis is an indicator script for TradingView called "ICT Killzone". It is a useful tool for identifying the London and New York open and close sessions, as well as the Asian range on the chart. The appearance of the "killzones" can be customized by selecting colors and transparencies for each session. Boxes can also be displayed around each session and labels with additional information can be added. This script is compatible with intraday charts and time multipliers up to 60 minutes. It was created by Jeaw and is based on the ideas of the ICT (Institutional Cash Trades) methodology. This script can help traders avoid entering the market during high impact news events and periods of low liquidity. By identifying these potentially volatile times, traders can better manage their risk and improve their overall trading strategy.

dmn's ICT ToolkitThis is my quality of life indicator for forex trading using the methods and concepts of ICT.
The idea is to automate marking up important price levels and times of the day instead of doing it manually every day.
Killzones
Marks the most volatile times of the day on the chart, during which the intraday high/low usually takes place.
Particularly impactful when there's news released during these times.
London Open (02:00-05:00 EST)
New York Open (08:30-11:00 EST)
London Close (10:00-11:30 EST)
True Day delineation
Vertical line at the start of the "true day" (00:00 EST), start of the algorithmic trading day and aids in visualizing the intraday direction.
New York midnight price level
Noteworthy price level at the start of the "true day".
This price level is referenced by the interbank trading algorithms during the day. Buy below it on bullish days, sell above it on bearish days.
Daily open price level
Reference level for optimal trade entries. Buy below it on bullish days, sell above it on bearish days.
Central Banks Dealers Range (CBDR) (14:00-20:00 EST) &
Central Banks Dealers Flout (CBDF) (15:00-24:00 EST) &
Asian Range (AR) (20:00-24:00 EST)
The standard deviation lines available are used to make predictions for short-term future highs/lows when the CBDR and AR are smaller than 40 pips.
Trade them by looking for 5/15min key levels that converge with the projection levels.
X days Average Daily Range (ADR)
Default to 5 days back, gives an idea of how much movement to expect intraday when the ADR high/low is converging with CBDR/CBDF/AR standard deviations.
Current Daily Range (CDR)
Used for comparison against the ADR to help determine if there's enough intraday range left to enter a trade.
Dynamically changes color based on percentage of the ADR. Green below 50% of ADR, orange between 50 and 100%, red when CDR exceeds ADR.
All of the above are used in conjunction with each other and higher timeframe levels of importance to find entries and target.
Note: Preferably use New York's time zone for your charts.

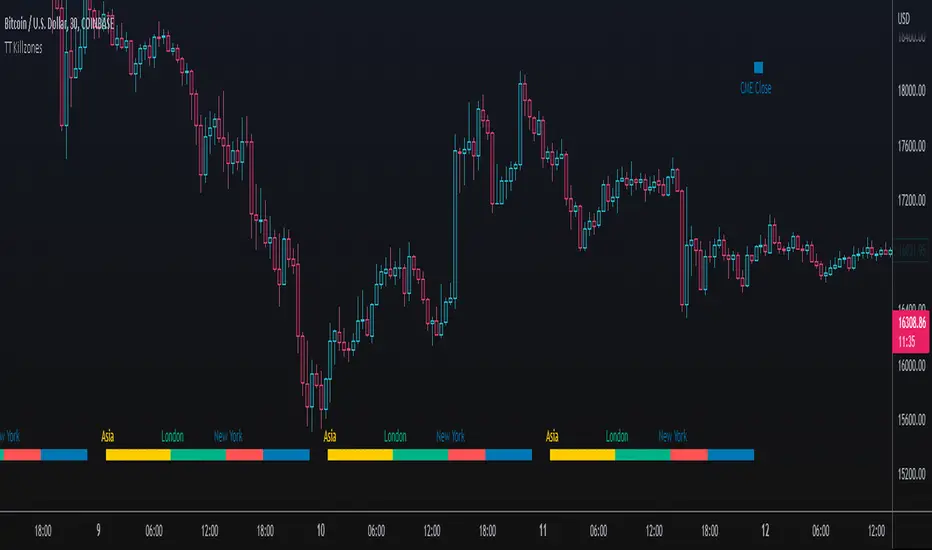
TT KillzonesThis indicator plots the 3 main trading zones : Asia, London, New York
Its is also possible to use a different color for the "High Trading Volume" timezone. It can be adjusted. Default is the overlapping time of London and New York Killzone
It also plots the CME open / close
This indocator can be used as example / copy for your own project!
Have fun!
Killzone MTA ConceptsThis indicator indicates the Pre-Forex Market Killzones studied by our mentors at MTA Concepts. High volatility areas where you can take advantage of a great advantage when trading intraday.
Killzone: A killzone is an area, a time interval where there is high volatility and coincides with market pre-openings.
We have divided the Killzones into 3:
-London Killzone
-New York Killzone
-Asia Killzone
- Closing of operations: Time interval to take into account for the closing of intraday operations.
This indicator is prepared for intraday traders
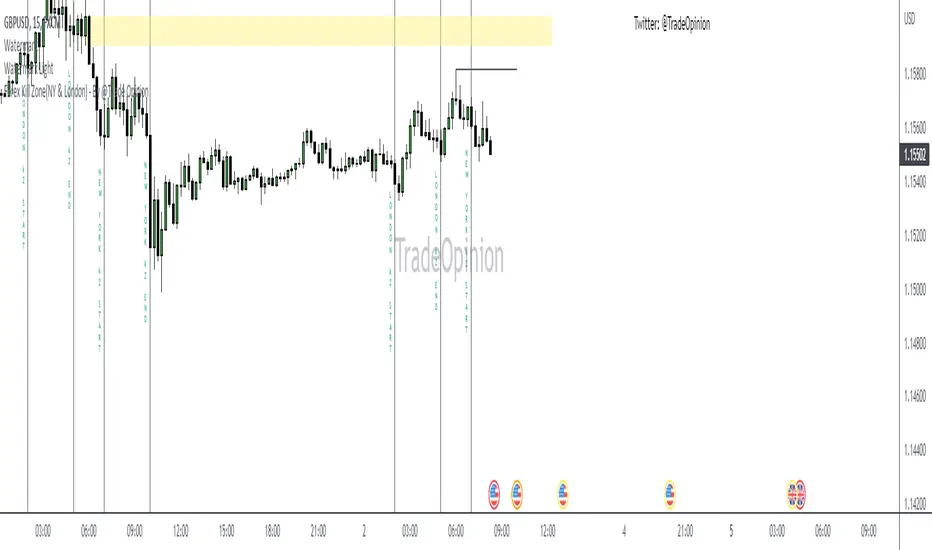
Forex Kill Zone(NY & London) - By @Trade OpinionThis indicator draws the New York & London kill zones for Forex Trading.
ICT Sessions (Kill Zones)Inspired by the work of ICT (Inner Circle Trader - @ICT_MHuddleston)
What are ICT KillZones:
All ICT students know that certain moments of the day are more indicated to search for good frameworks. These moments are indicated like "Kill Zones".
The best kill zones to search for profittable tradings are during the London session and during the New York session.
How This Indicator Can Help You:
With this indicator you'll see plotted in the charts the London Kill Zone and the New York Kill Zone, you'll see exactly when they start and finish, so you'll be able to understand better the price action and recognize if there are ICT framework to trade. You'll also will see when the New York lunch hour happen (this moment is not favorable for searching frameworks) and you'll see also 2 very important moments of the day, the 8.30 New York Time and the 9.30 New York Time, infact in these 2 particular moments it is most likely that some very profittable framework will appear as there are alway important economic news released in these 2 hours.
Also you'll see the New York Midnight Open, that always forms a very important level for the day trading, you could see the New York Midnight open as a real opening for markets.
Why This Indicator:
I looked for indicators working with these concepts and I could not find one that offered the kill zones sections in the way are showed in my indicator, also they just had the kill zones without showing the 8.30 and 9.30 hours and without the Ney York midnight opening, and these are very important time frames for who works with ICT concepts.
About The Indicator:
In this indicator you'll have displayed:
The regular trading sessions displayed, that is: Asian Session, London Session, New York Session.
The London Kill Zone
The New York Kill Zone
The New York Midnight Open
The New York Lunch Hour
The 8:30 News Release Hour
The 9:30 News Release Hour
All these level can be adjusted and changed as you prefer.

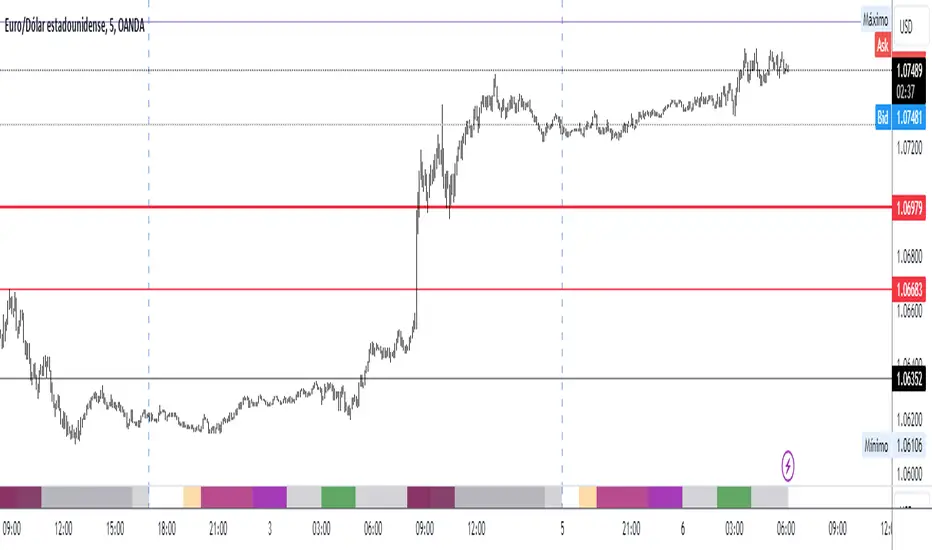
Sessions & ICT Killzones (0xCryptoVince)Sessions and ICT Killzones
All in one session and killzone script for FX or Crypto markets. It includes London, New York and Asia Sessions and Killzones.
Features
Uses UTC timezone so no timezone correction needed
Includes London, New York and Asia sessions
Includes ICT killzones
Optionally include weekends for session or killzone separately
Customize line style, width and color
Customize colors for sessions and killzones
Session highs/lows displayed on chart as a line or a box
Killzones displayed on top or bottom
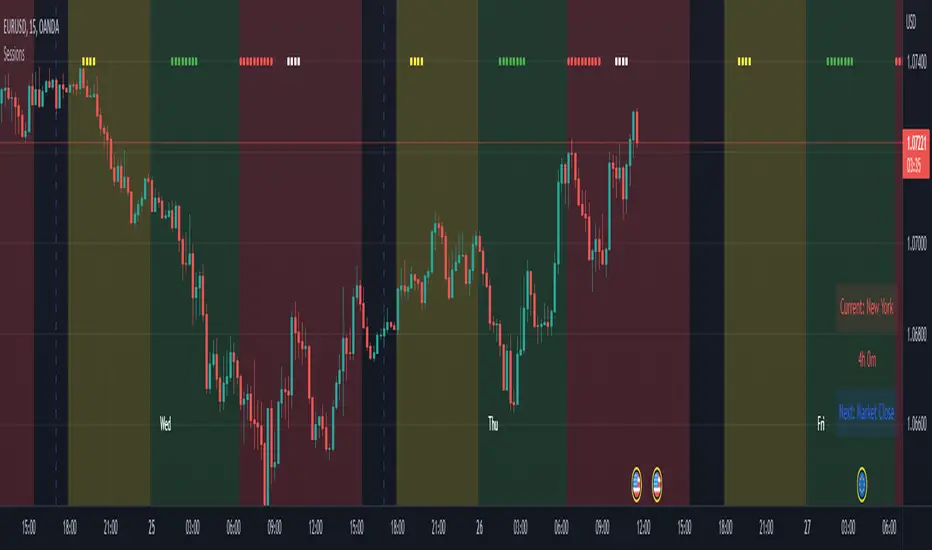
Advanced Time SessionsIntroducing Advanced Time Sessions , this tool uses a 24 hour look ahead plot - this is to help inform the trader about not just the current session but the next one coming up. Now traders, at a quick glance can see what session they trading in, how much time till the sessions close, what is the next session, and when the daily market close is! Main features of the tool include daily dividers, day labels and kill zone highlighters.
This tool is a day traders dream to have this subtle and stylish data at a glance letting you focus on more strategically placing your trades based around time and price!
EURUSD - 15m
EURUSD - 5m
Smart Money Concepts used with Advanced Time Sessions

Advanced Time SessionsIntroducing a new improved Sessions indicator, still using that 24 hour look ahead plotting, this time with a twist of eye pleasing data. Now traders at a quick glance can see what session they trading in, time till its done, and what is the next session. Including daily dividers, day labels and kill zone highlighters. This tool is a day traders dream to have this subtle and stylish data at a glance letting you focus on more strategically placing your trades based around time and price!
ICT Session Killzone Boxes & DeviationsICT Killzone Sessions Boxes & Deviations is a convenience indicator that marks out past and future ICT killzones for Asia, London, and New York, London Close and CBDR.
The boxes highlights the highest and lowest candle opens of that session/killzone, which is what the deviations are based on. Two lines mark out the highest high and lowest low of that session.
This indicator also includes New York midnight opening price and a vertical divider showing you that time.
Future killzones are also marked out.
All times are set to GMT-4 so these boxes should work across most exchanges. Times and code can be changed if a few don't match up.
Included are week of day labels for your convenience.
For those who are unfamiliar, ICT Killzones are optimal times to look for trades during or before a session, often providing entry for trades with orderblock tests, FVG fills or stophunts.
Please note: This indicator only works well on 1HR timeframe and below. The default max timeframe setting is set to 15min, which can be changed in the menu.
There may be some bugs so please highlight anything you find in the comments below :)
Shout out to @Ryazn for all the ideas!
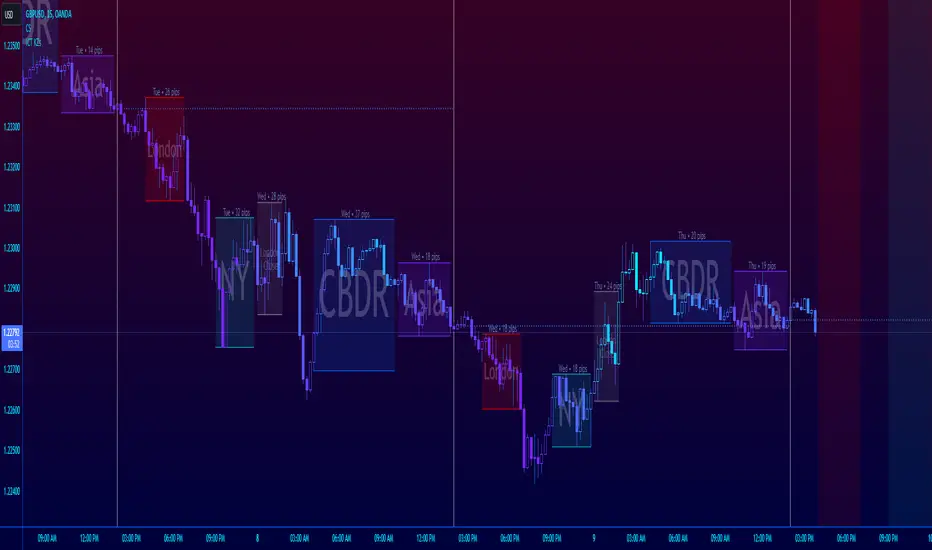
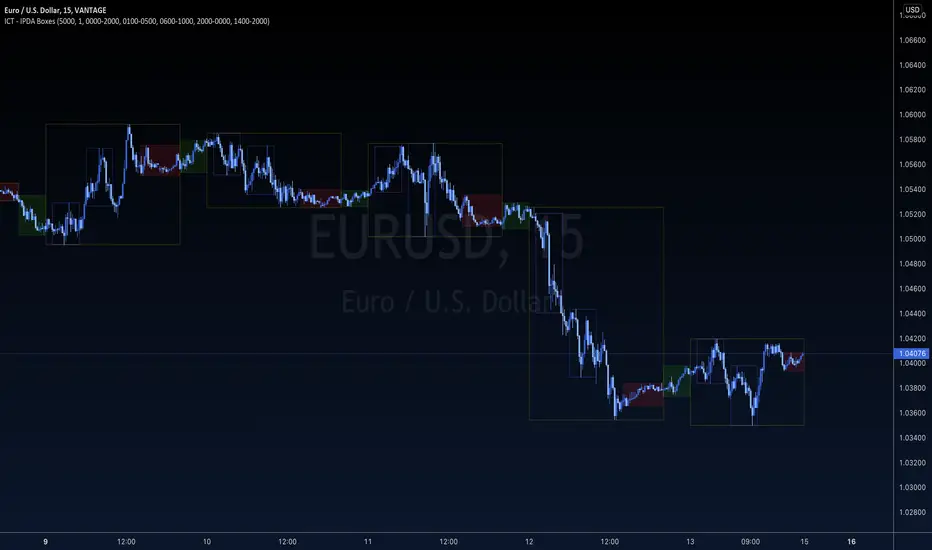
ICT - IPDA BoxesICT - IPDA Boxes indicator encapsulate important (TRUE DAY) time zones based on ICT concepts.
Standard settings will plot True Day, CBDR, Asian Range, London and NY Open Kill-Zones. It is designed to keep a minimalistic and clean look for your charts using TradingView's Dark theme, but you can adjust any specific line or background color transparency of your choice. If you want to add other session (like NY close for example), just paste again the indicator to your chart and set the correct session duration and colors of your preference. You can log, study, backtest and use it for your analysis if you are familiar with ICT concepts.
Check indicator time lines and adjust session times for your own TradingView's personal settings it before using.
ANY fault, bug or mismatch in this script is only mine and I will be glad to correct it if you let me know.
The ownership of all this concepts belongs to ICT - Michael Huddleston and it is published with his permission.