BOSS Zero-Lag Dynamic MACDTHE BEST FOREX, BINARY OPTIONS, AND CRYPTO INDICATORS FOR TRADINGVIEW.COM
Our MACD is a Zero-Lag (well near zero-lag) We make this claim because MACD utilizes Moving Averages and as you know moving averages are lagging indicators.
For our MACD we utilize The McGinley Dynamic which looks like a moving average line yet it is a smoothing mechanism for prices that turns out to track far better than any moving average.
The McGinley Dynamic minimizes price separation, price whipsaws and hugs prices much more closely.
The McGinley Dynamic does this automatically as this is a factor of the formula.
Because of the calculation, the Dynamic Line speeds up in down markets as it follows prices yet moves more slowly in up markets.
As traders we want to be quick to sell in a down market, yet ride an up market as long as possible.
Source: Investopedia.com
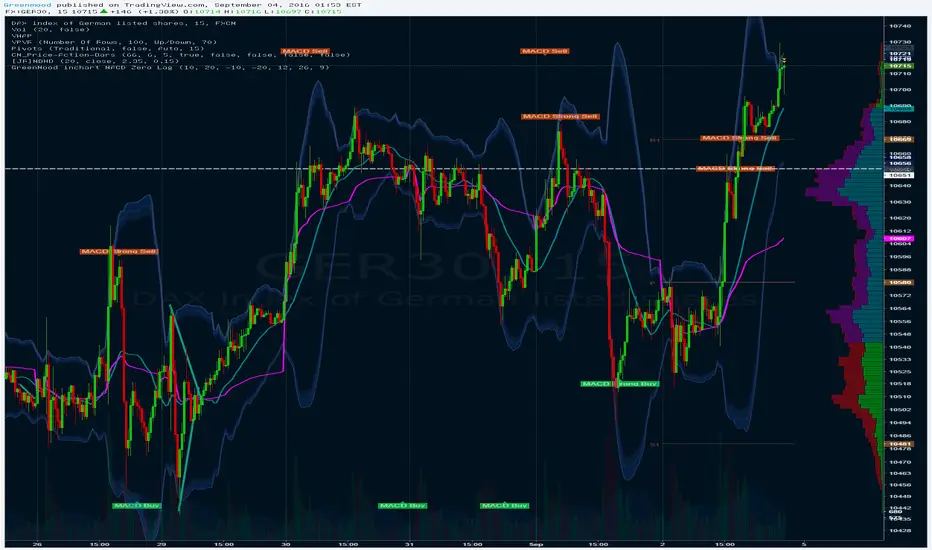
Chart Image shows conventional MACD on Bottom and BOSS Zero-Lag Dynamic MACD on top
Available at: bosscripts.com
Lag

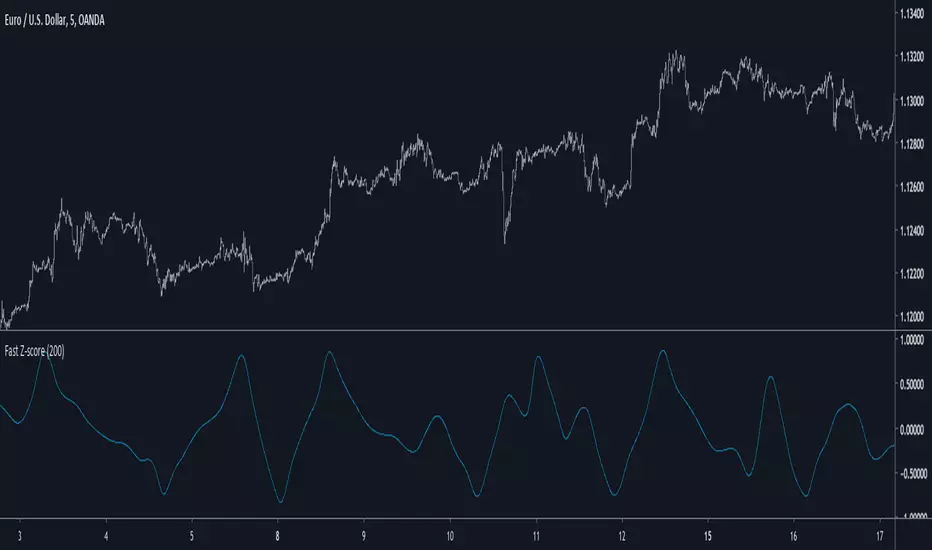
Fast Z-ScoreIntroduction
The ability of the least squares moving average to provide a great low lag filter is something i always liked, however the least squares moving average can have other uses, one of them is using it with the z-score to provide a fast smoothing oscillator.
The Indicator
The indicator aim to provide fast and smooth results. length control the smoothness.
The calculation is inspired from my sample correlation coefficient estimation described here
Instead of using the difference between a moving average of period length/2 and a moving average of period length , we use the difference between a lsma of period length/2 and a lsma of period length , this difference is then divided by the standard deviation. All those calculations use the price smoothed by a moving average as source.
The yellow version don't divide the difference by a standard deviation, you can that it is less reactive. Both version have length = 200
Conclusion
I presented a smooth and responsive version of a z-score, the result could be used to estimate an even faster lsma by using the line rescaling technique and our indicator as correlation coefficient.
Hope you like it, feel free to modify it and share your results ! :)
Notes
I have been requested a lot of indicators lately, from mt4 translations to more complex time series analysis methods, this accumulation of work made that it is impossible for me to publish those within a short period of time, also some are really complex. I apologize in advance for the inconvenience, i will try to do my best !
Zero Phase Filtering [Repaint] - ExperimentalImportant !
The indicator is for experimental purpose only, it must not be used as a decisional tool but only as a visual one (like Zig-Zag, Fractal etc). The information this indicator display is uncertain and subject to drastic changes over time. If you have further question feel free to pm me.
Introduction
Most of the filters you will find are causal, this mean that they depend on present and past input values, this explain the lag they produce. Non causal filters however will use future input values. A well know way to get a zero-phase filter is by using the forward backward method, but this is not possible in pinescript as i recall. So we have to use some kind of function that will display future values, this is possible using the security function in version 2 or the one in version 3 using barmerge.lookahead_on .
The Use Of A Repainting Indicator
Its always better to filter data in order to have a clearer view of what is happening, this can be useful when doing some forecasting or doing less formal kind of analysis. However since it repaint you cant use it as a signal provider or use signals of other indicators using this filter as source.
For example if you want to forecast a smooth indicator, the forecast of this indicator under normal circumstances could still have lag associated with it, so you would have to react before your forecast, this wont happen if you apply this filter as your indicator source.
The Filter
We smooth with a simple moving average the price provided by the security function twice, length control the smoothing level. Since security depend on the time frame you are in you must select your time frame in the indicator parameter selection window.
Filtering using 45 minutes time frame close price in a 5 minutes chart, we fix this by selecting our time frame.
Consider the fact that the input of the indicator is just periodic price, so sometimes the lag can sometimes be less or more than 0 and the estimation not centered.
The indicator can work on time frames up to 1h, after that the filter have some lag, i tried fixing this and i ended up having data errors.
Applying our filter as source for the rsi oscillator.
Conclusion
It is possible to have a kind of zero-phase filters, but it would be better if pinescript could support backward indexing thus making us able to do forward backward filtering.
Since noise can affect our analysis, applying smoothing without having to use offset in plot can be considered useful.

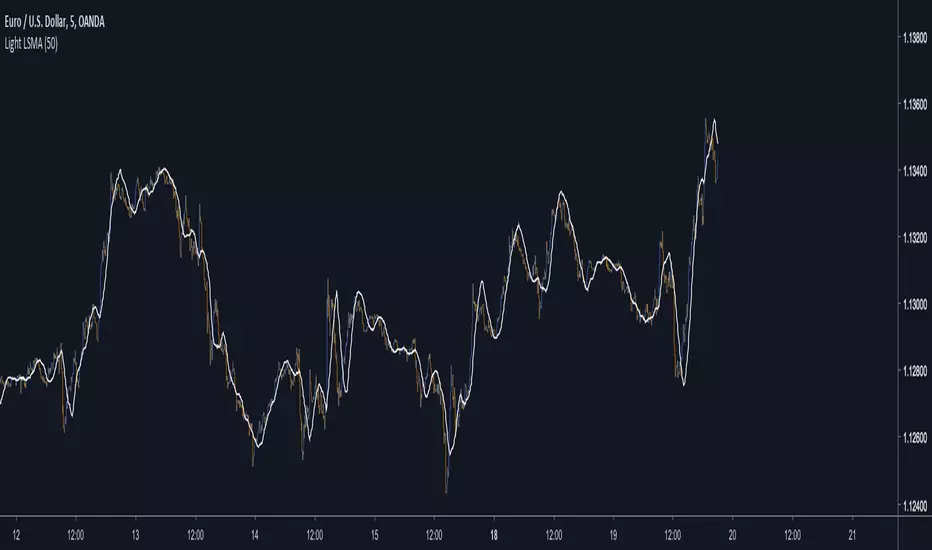
Light LSMAEstimating the LSMA Without Classics Parameters
I already mentioned various methods in order to estimate the LSMA in the idea i published. The parameter who still appeared on both the previous estimation and the classic LSMA was the sample correlation coefficient. This indicator will use an estimate of the correlation coefficient using the standard score thus providing a totally different approach in the estimation of the LSMA. My motivation for such indicator was to provide a different way to estimate a LSMA.
Standardization
The standard score is a statistical tool used to measure at how many standard deviations o a data point is bellow or above its mean. It can also be used to rescale variables, this conversion process is called standardizing or normalizing and it will be the basis of our estimation.
Calculation : (x - x̄)/o where x̄ is the moving average of x and o the standard deviation.
Estimating the Correlation Coefficient
We will use standardization to estimate the correlation coefficient r . 1 > r > -1 so in (y - x̄)/o we want to find y such that y is always above or below 1 standard deviation of x̄ , i had for first idea to pass the price through a band-stop filter but i found it was better to just use a moving average of period/2 .
Estimating the LSMA
We finally rescale a line through the price like mentioned in my previous idea, for that we standardize a line and we multiply the result by our correlation estimation, next we multiply the previous calculation by the price standard deviation, then we sum this calculation to the price moving average.
Comparison of our estimate in white with a LSMA in red with both period 50 :
Working With Different Independents Variables
Here the independent variable is a line n (which represent the number of data point and thus create a straight line) but a classic LSMA can work with other independent variables, for exemple if a LSMA use the volume as independent variable we need to change our correlation estimate with (ȳ - x̄)/ô where ȳ is the moving average of period length/2 of y, y is equal to : change(close,length)*change(volume,length) , x̄ is the moving average of y of period length , and ô is the standard deviation of y. This is quite rudimentary and if our goal is to provide a easier way to calculate correlation then the product-moment correlation coefficient would be more adapted (but less reactive than the sample correlation) .
Conclusion
I showed a way to estimate the correlation coefficient, of course some tweaking could provide a better estimate but i find the result still quite close to the LSMA.
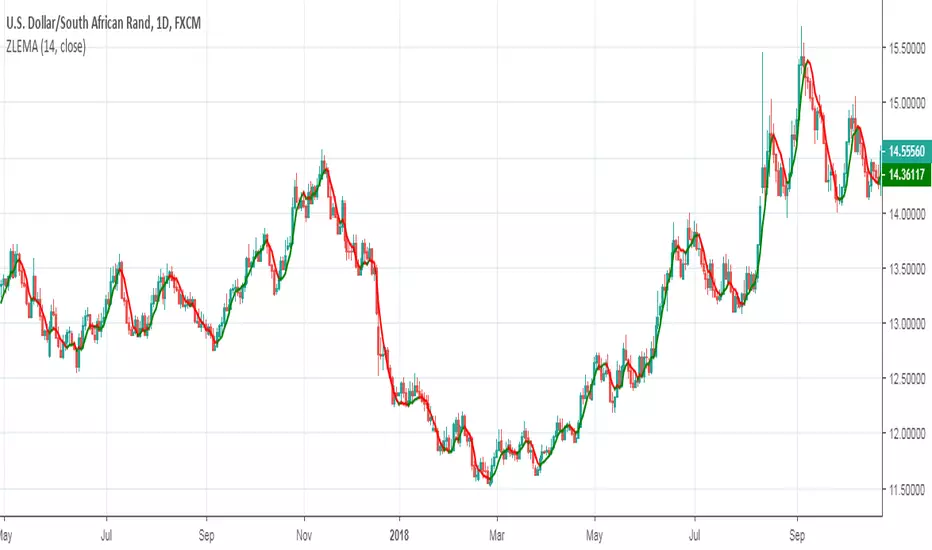
Zero Lag Exponential Moving AverageZero Lag Exponential Moving Average indicator script based on the original version by John Ehlers and Ric Way
Zero-Lag 4-Exponential Moving Average TrendingThe idea is using a 4 exponential moving average to get scalping positions. The indicator will allow you to change between EMA, Zero Lag EMA and Zero Lag Aggressive EMA.
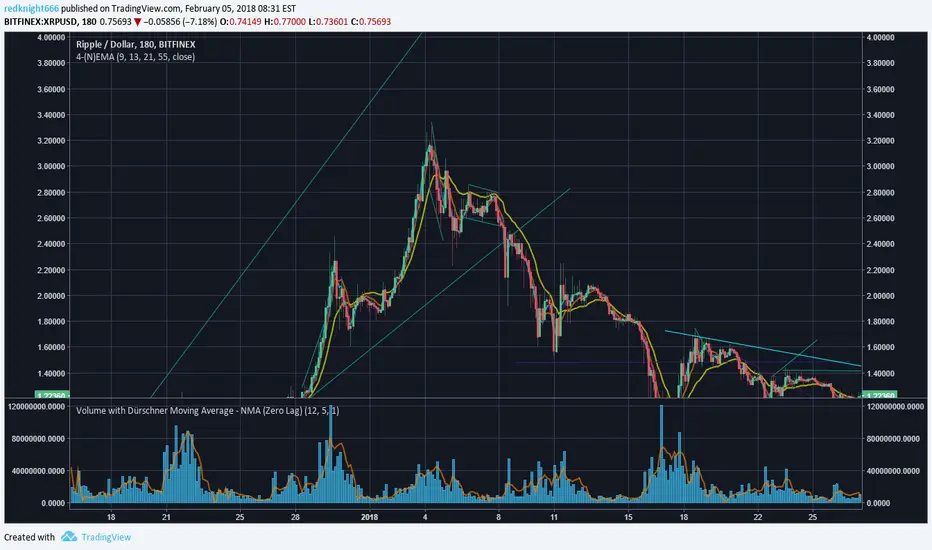
Dürschner Moving Average - NMA (Zero Lag)The Dürschner Moving Average was published at the IFTA 2012 (International Federation of Technical Analysts) Journal, page 27.
This moving average follows the Nyquist Sampling Criterion making showing even better behavior on high volatility environments than the Ehlers & Ric's "Zero Lag Moving Average".
From the paper abstract: "The well-known Moving Averages (MA), namely the Simple Moving Average (SMA), the Exponential Moving Average (EMA) and the Weighted Moving Average (WMA), are modified in this paper with the help of the Nyquist Criterion. These modified Moving Averages 3.0 show good smoothing characteristics, illustrate relevant trends and trend reversals in price series without a time lag as far as calculated. With regard to smoothing, trend patterns and time lag bring about a significant improvement on conventional SMA (Moving Averages 1.0: SMA, EMA and WMA). In addition to this, the efficiency of the Moving Averages 3.0 is demonstrated by applying several tests and a
simple trading system."

Triangular Moving AverageThe TRIMA is simply the SMA of the SMA -- a double-smoothed simple moving average . The end effect of the double smoothing is that greater weight is placed on values near the middle of the lookback period. It therefore reacts relatively slowly to price changes compared to most moving averages .
But why would I want more lag?
One potential use of this moving average that I've found is that it can allow price to run for a bit after crossing the TRIMA before catching up and creating an opposing signal. It therefore creates the chance for the price to "run its course" so to speak, which can make whipsaw signals less common.

GreenMood inchart MACD Zero LagMACD Zero lag Visual inchart view.
Threshold / Settings can be changed in Format view.
Threshold to be adapted depending on timeframe.