Reactive Curvature Smoother Moving Average IndicatorSummary in one paragraph
RCS MA is a reactive curvature smoother for any liquid instrument on intraday through swing timeframes. It helps you act only when context strengthens by adapting its window length with a normalized path energy score and by smoothing with robust residual weights over a quadratic fit, then optionally blending a capped one step forecast. Add it to a clean chart and watch the single colored line. Shapes can shift while a bar forms and settle on close. For conservative use, judge on bar close.
Scope and intent
• Markets: major FX pairs, index futures, large cap equities, liquid crypto
• Timeframes: one minute to daily
• Purpose: reduce lag in trends while resisting chop and outliers
• Limits: indicator only, no orders
Originality and usefulness
• Novelty: adaptive window selection by minimizing normalized path energy with directionality bias, plus Huber weighted residuals and curvature aware penalty, finished with a mintick capped forecast blend
• Failure modes addressed: whipsaws from fixed length MAs and outlier spikes that pull means
• Testable: Inputs expose all components and optional diagnostics show chosen length, directionality, and energy
• Portable yardstick: forecast cap uses mintick to stay symbol aware
Method overview in plain language
Base measures
• Range span of the tested window and a path energy defined as the sum of squared price increments, normalized by span
Components
Adaptive window chooser: scans L between Min and Max using an energy over trend score and picks the lowest score
Robust smoother: fits a quadratic to the last L bars, computes residuals, applies Huber weights and an exponential residual penalty scaled down when curvature is high
Forecast blend: projects one step ahead from the quadratic, caps displacement by a multiple of mintick, blends by user weight
Fusion rule
• Final line equals robust mean plus optional capped forecast blend
Signal rule
• Visual bias only: color turns lime when close is above the line, red otherwise
What you will see on the chart
• One colored line that tightens in trends and relaxes in chop
• Optional debug overlays for core value, chosen L, directionality, and energy
• Optional last bar label with L, directionality, and energy
• Reminder: drawings can move intrabar and settle on close
Inputs with guidance
Setup
• Source: price series to smooth
Logic
• Min window l_min. Typical 5 to 21. Higher increases stability, adds lag
• Max window l_max. Typical 40 to 128. Higher reduces noise, adds lag ceiling
• Length step grid_step. Typical 1 to 8. Smaller is finer and heavier
• Trend bias trend_bias. Typical 0.50 to 0.80. Higher favors trend persistence
• Residual penalty lambda_base. Typical 0.8 to 2.0. Higher downweights large residuals more
• Huber threshold huber_k. Typical 1.5 to 3.0. Higher admits more outliers
• Curvature guard curv_guard. Typical 0.3 to 1.0. Higher reduces influence when curve is tight
• Forecast blend lead_blend. 0 disables. Typical 0.10 to 0.40
• Forecast cap lead_limit. Typical 1 to 5 minticks
• Show chosen L and metrics show_debug. Diagnostics toggle
Optional: enable diagnostics to see length, direction, and energy
Realism and responsible publication
• No performance claims. Past results never guarantee future outcomes
• Shapes can move while bars are open and settle on close
• Use on standard candles for analysis and combine with your own risk process
Honest limitations and failure modes
• Very quiet regimes can reduce energy contrast, length selection may hover near the bounds
• Gap heavy symbols can disrupt quadratic fit on the window edges
• Excessive forecast blend may look anticipatory; use low values and the cap
Leadingindicators

Fair Value Lead-Lag Model [BackQuant]Fair Value Lead-Lag Model
A cross-asset model that estimates where price "should" be relative to a chosen reference series, then tracks the deviation as a normalized oscillator. It helps you answer two questions: 1) is the asset rich or cheap vs its driver, and 2) is the driver leading or lagging price over the next N bars.
Concept in one paragraph
Many assets co-move with a macro or sector driver. Think BTC vs DXY, gold vs real yields, a stock vs its sector ETF. This tool builds a rolling fair value of the charted asset from a reference series and shows how far price is above or below that fair value in standard deviation units. You can shift the reference forward or backward to test who leads whom, then use the deviation and its bands to structure mean-reversion or trend-following ideas.
What the model does
Reference mapping : Pulls a reference symbol at a chosen timeframe, with an optional lead or lag in bars to test causality.
Fair value engine : Converts the reference into a synthetic fair value of the chart using one of four methods:
Ratio : price/ref with a rolling average ratio. Good when the relationship is proportional.
Spread : price minus ref with a rolling average spread. Good when the relationship is additive.
Z-Score : normalizes both series, aligns on standardized units, then re-projects to price space. Good when scale drifts.
Beta-Adjusted : rolling regression style. Uses covariance and variance to compute beta, then builds a fair value = mean(price) + beta * (ref − mean(ref)).
Deviation and bands : Computes a z-scored deviation of price vs fair value and plots sigma bands (±1, ±2, ±3) around the fair value line on the chart.
Correlation context : Shows rolling correlation so you can judge if deviations are meaningful or just noise when co-movement is weak.
Visuals :
Fair value line on price chart with sigma envelopes.
Deviation as a column oscillator and optional line.
Threshold shading beyond user-set upper and lower levels.
Summary table with reference, deviation, status, correlation, and method.
Why this is useful
Mean reversion framework : When correlation is healthy and deviation stretches beyond your sigma threshold, probability favors reversion toward fair value. This is classic pairs logic adapted to a driver and a target.
Trend confirmation : If price rides the fair value line and deviation stays modest while correlation is positive, it supports trend persistence. Pullbacks to negative deviation in an uptrend can be buyable.
Lead-lag discovery : Shift the reference forward by +N bars. If correlation improves, the reference tends to lead. Shift backward for the reverse. Use the best setting for planning early entries or hedges.
Regime detection : Large persistent deviations with falling correlation hint at regime change. The relationship you relied on may be breaking down, so reduce confidence or switch methods.
How to use it step by step
Pick a sensible reference : Choose a macro, index, currency, or sector driver that logically explains the asset’s moves. Example: gold with DXY, a semiconductor stock with SOXX.
Test lead-lag : Nudge Lead/Lag Periods to small positive values like +1 to +5 to see if the reference leads. If correlation improves, keep that offset. If correlation worsens, try a small negative value or zero.
Select a method :
Start with Beta-Adjusted when the relationship is approximately linear with drift.
Use Ratio if the assets usually move in proportional terms.
Use Spread when they trade around a level difference.
Use Z-Score when scales wander or volatility regimes shift.
Tune windows :
Rolling Window controls how quickly fair value adapts. Shorter equals faster but noisier.
Normalization Period controls how deviations are standardized. Longer equals stabler sigma sizing.
Correlation Length controls how co-movement is measured. Keep it near the fair value window.
Trade the edges :
Mean reversion idea : Wait for deviation beyond your Upper or Lower Threshold with positive correlation. Fade back toward fair value. Exit at the fair value line or the next inner sigma band.
Trend idea : In an uptrend, buy pullbacks when deviation dips negative but correlation remains healthy. In a downtrend, sell bounces when deviation spikes positive.
Read the table : Deviation shows how many sigmas you are from fair value. Status tells you overvalued or undervalued. Correlation color hints confidence. Method tells you the projection style used.
Reading the display
Fair value line on price chart: the model’s estimate of where price should trade given the reference, updated each bar.
Sigma bands around fair value: a quick sense of residual volatility. Reversions often target inner bands first.
Deviation oscillator : above zero means rich vs fair value, below zero means cheap. Color bins intensify with distance.
Correlation line (optional): scale is folded to match thresholds. Higher values increase trust in deviations.
Parameter tips
Start with Rolling Window 20 to 30, Normalization Period 100, Correlation Length 50.
Upper and Lower Threshold at ±2.0 are classic. Tighten to ±1.5 for more signals or widen to ±2.5 to focus on outliers.
When correlation drifts below about 0.3, treat deviations with caution. Consider switching method or reference.
If the fair value line whipsaws, increase Rolling Window or move to Beta-Adjusted which tends to be smoother.
Playbook examples
Pairs-style reversion : Asset is +2.3 sigma rich vs reference, correlation 0.65, trend flat. Short the deviation back toward fair value. Cover near the fair value line or +1 sigma.
Pro-trend pullback : Uptrend with correlation 0.7. Deviation dips to −1.2 sigma while price sits near the −1 sigma band. Buy the dip, target the fair value line, trail if the line is rising.
Lead-lag timing : Reference leads by +3 bars with improved correlation. Use reference swings as early cues to anticipate deviation turns on the target.
Caveats
The model assumes a stable relationship over the chosen windows. Structural breaks, policy shocks, and index rebalances can invalidate recent history.
Correlation is descriptive, not causal. A strong correlation does not guarantee future convergence.
Do not force trades when the reference has low liquidity or mismatched hours. Use a reference timeframe that captures real overlap.
Bottom line
This tool turns a loose cross-asset intuition into a quantified, visual fair value map. It gives you a consistent way to find rich or cheap conditions, time mean-reversion toward a statistically grounded target, and confirm or fade trends when the driver agrees.

Nifty Smart Zones & Breakout Bars(5min TF only) by Chaitu50cNifty Smart Zones & Breakout Bars is a purpose-built intraday trading tool, tested extensively on Nifty50 and recommended for Nifty50 use only.
All default settings are optimised specifically for Nifty50 on the 5-minute timeframe for maximum accuracy and clarity.
Why Last Bar of the Session Matters
The last candle of a trading session often represents the final battle between buyers and sellers for that day.
It encapsulates closing sentiment, influenced by end-of-day positioning, profit booking, and institutional activity.
The high and low of this bar frequently act as strong intraday support/resistance in the following sessions.
Price often reacts around these levels, especially when combined with volume surges.
Core Features
Session Last-Candle Zones
Plots a horizontal box at the high and low of the last candle in each session.
Boxes extend to the right to track carry-over levels into new sessions.
Uses a stateless approach — past zones reappear if relevant.
Smart Suppression System
When more than your Base Sessions (No Suppression) are shown, newer zones overlapping or within a proximity distance (in points) of older zones are hidden.
Older zones take priority, reducing chart clutter while keeping critical levels.
Breakout Bar Coloring
Highlights breakout bars in four categories:
Up Break (1-bar)
Down Break (1-bar)
Up Break (2-bar)
Down Break (2-bar)
Breakouts use a break buffer (in ticks) to filter noise.
Toggle coloring on/off instantly.
Volume Context (User Tip)
For best use, pair with volume analysis.
High-volume breakouts from last-session zones have greater conviction and can signal sustained momentum.
Usage Recommendations
Instrument: Nifty50 only (tested & optimised).
Timeframe: 5-minute chart for best results.
Approach:
Watch for price interaction with the plotted last-session zones.
Combine zone breaks with bar color signals and volume spikes for higher-probability trades.
Use suppression to focus on key, non-redundant levels.
Why This Tool is Different
Unlike standard support/resistance plotting, this indicator focuses on session-closing levels, which are more reliable than arbitrary highs/lows because they capture the final market consensus for the session.
The proximity-based suppression ensures your chart stays clean, while breakout paints give instant visual cues for momentum shifts.

Momentum Concepts [AlgoAlpha]🚀 Introducing the Momentum Concepts™ , a robust multi-layered momentum analysis tool developed by AlgoAlpha . This All-in-One indicator offers a comprehensive approach to understanding market momentum, empowering traders with hyper customizable features to tailor their analysis to their specific trading strategies.
Designed with efficiency and compactness in mind, the script shows momentum regimes on three time horizons: The short-term ( Fast Oscillator ), medium-term ( Scalper's Momentum ) and long-term ( Momentum Impulse Oscillator and Hidden Liquidity Flow ). Additionally, the script also includes reversal signals for traders who prefer to trade contrarian/mean-reversion strategies. By utilizing a blend of advanced algorithms and customizable parameters, Momentum Concepts™ provides traders with a vast array of trading strategies ranging from high frequency scalping to timing better entries on long-term swing and investing positions.
Let's delve into the key features and functionalities of this versatile indicator:
🎯Key Features (summary):
Customizable Fast Oscillator: Tailor the fast oscillator to your preferences with adjustable settings for type, source, trend identification(signal processing) method, length, and more.
Divergence Detection: Identify potential trend reversals with ease using built-in divergence detection for both bullish and bearish signals.
Momentum Impulse Oscillator: Gain deeper insights into trending/ranging markets and underlying market bias with a dedicated oscillator, featuring adjustable trend impulse thresholds.
Scalper's Momentum: Utilize a specialized momentum indicator designed for scalping strategies, featuring agility in signal detection with noise reduction and customizable smoothing parameters.
Hidden Liquidity Flow Analysis: Assess hidden liquidity flows within the market, highlighting excess liquidity and potential squeeze situations.
Trend Confluence Indicator: Evaluate the overall momentum direction with dynamically colored zones, aggregating signals from Momentum Concepts™ components for a holistic view.
User-Friendly Interface: The indicator is presented in a clear and intuitive manner, making it accessible for traders of all experience levels.
All-Rounded Alerts: The indicator comes with a comprehensive alerts extension in a separate script, allowing you to stay informed of important market movements even when away from your trading platform.
🎯Key Features (in-depth):
The Fast Oscillator within Momentum Concepts™ comprises four components designed to provide insights into short-term momentum dynamics:
🔱Price Volume Swings :
This confirmation component uses our proprietary Price Volume Algorithm to analyze price action and volume to identify buying and selling pressure, aiding traders in spotting short-term swings for potential trading opportunities.
⚜️Price Volume Waves :
This leading component also uses our proprietary Price Volume Algorithm but differs from the Price Volume Swings by capturing dominant wave patterns instead. This indicator breaks down price and volume data into a wave-like plot which enables leading insights into market momentum due to the relatively predicable nature of sine-like waves. Leading components such as this and the Alpha Wave are best used with other confirmation components within the Momentum Concepts™ .
🌊Alpha Wave :
The Alpha Wave is a leading non-volume alternative to the Price Volume Waves . It reflects market momentum by analyzing price action only instead of using volume data, resulting in a normalized wave-like plot similar to that of the Price Volume Waves , offering a leading perspective on potential market momentum shifts. Leading components such as this and the Price Volume Waves are best used with other confirmation components within the Momentum Concepts™ .
🐲Dragon RSI :
The Dragon RSI is a confirmation component that determines market momentum by analyzing the directional movement of the Relative Strength Index (RSI). By doing so, users are able to visually identify the current short term trend of the market as well as identify overbought and oversold conditions.
Reversal Signals :
All the Fast Oscillator components come with reversal signals that are based on the respective components being either oversold or overbought.
Divergences :
All the Fast Oscillator components come with bullish and bearish divergences. Divergences within the Fast Oscillator components of Momentum Concepts ™ offer crucial signals for trend shifts. 🔱 Price Volume Swings and ⚜️ Price Volume Waves detect weakening buying or selling pressure, signalling potential reversals or continuations. 🌊 Alpha Wave and 🐲 Dragon RSI identify divergences between momentum and price, aiding traders in anticipating market movements. Leveraging these divergences enhances analysis, aiding traders in formulating meaningful analysis.
Customizable Signal Processing Methods :
All the Fast Oscillator components come with customizable signal processing methods to identify trends on the Fast Oscillator , they include (but not limited to) methods such as Heiken Ashi, and a vast selection of Moving Averages.
Diminishing Momentum Warning :
All the Fast Oscillator components come with a diminishing momentum warning that represents a reducing momentum on the Fast Oscillator . This can act as a take profit signal or as a precautionary warning that the price is about to change direction soon even though the Fast Oscillator has not detected it yet.
Dynamically Colored Reversal Zones :
Last but not least, the dynamic coloring of the reversal zones for Fast Oscillator can be customised based on either the reversal probability of the Fast Oscillator or based on the overall trend confluence of all the components within the Momentum Concepts™ indicator.
The Momentum Impulse Oscillator in Momentum Concepts™ offers crucial insights into long-term momentum trends, aiding traders in identifying the underlying momentum regime and differentiating between trending and consolidating markets.
Underlying Momentum Bias
By default, the Momentum Impulse Oscillator is set to show the longer term trend of price action, this can be used to set the directional bias for the markets and prevent users from trading against the trend.
Trending/Ranging Detection
The Momentum Impulse Oscillator comes with the option to enable trending thresholds, when the Momentum Impulse Oscillator is beyond these thresholds, it indicates a trending market, when Momentum Impulse Oscillator is within the thresholds, it indicates a consolidating/ranging market.
The Scalper's Momentum within Momentum Concepts™ furnishes traders with nuanced signals ideal for short to medium-term trading strategies. It efficiently displays both the medium-term momentum and any emerging divergences towards the opposing direction.
Medium-Term Momentum
The Scalper's Momentum is designed to fill the analysis gap between the Fast Oscillator and the Momentum Impulse Oscillator . Showing momentum insights over the medium-term.
Momentum Convergence-Divergence
The Scalper's Momentum is also capable of showing momentum convergences and divergences, which can be used as take-profit and/or confirmation signals to other components within Momentum Concepts™ .
The Hidden Liquidity Flow component of Momentum Concepts™ is designed to uncover underlying liquidity dynamics. This feature enables traders to anticipate potential price movements based on changes in liquidity flow, enhancing their ability to make informed trading decisions.
Underlying Liquidity Dynamics
The Hidden Liquidity Flow shows the underlying liquidity flow of the market, a positive liquidity flow indicates that liquidity is entering the market and increasing the probability of bullish price action, the opposite is true for negative liquidity flows.
Excess Liquidity Flow
The Hidden Liquidity Flow also indicates when there is an abnormal amount of liquidity flowing through the market, this can indicate the potential for volatility and explosive price action.
🎯Usage Examples:
Now that we have gone through the components and features of Momentum Concepts™ in detail, we'll walk you through the usage examples and strategies that you can utilise to navigate the markets.
Scalping
Using the Scalper's Momentum and the Fast Oscillator as an example, users can first use the Scalper's Momentum as a directional bias and the Fast Oscillator as a means of timing a more precise entry. Take profits can be based on either the Diminishing Momentum Warnings or the Fast Oscillator flipping signals or the Scalper's Momentum flipping signals.
Buying the Dip/Shorting the Pump
Using the Momentum Impulse Oscillator and the Fast Oscillator as an example, users will need to first determine the underlying trend with the Momentum Impulse Oscillator , after which they can use the Fast Oscillator for entry signals into the trend. Take profits can be based on either the Diminishing Momentum Warnings or the Fast Oscillator flipping signals
Reversal Trading
Using the Momentum Impulse Oscillator on a timeframe roughly 3-4 times greater than the chart's timeframe and the Fast Oscillator as an example, users will need to first ensure that the Momentum Impulse Oscillator signals a ranging market on a higher timeframe, divergence signals from the Fast Oscillator can then be used as entries. Take profits can be based on either the Diminishing Momentum Warnings or the Fast Oscillator flipping signals or the Fast Oscillator reaching the zero line.
(These are just examples for reference, the Momentum Concepts™ offers significantly more possibilities for customisation and fine tuning of your trading strategy.)
🎯Conclusion:
In conclusion, Momentum Concepts™ stands as a versatile and powerful tool for traders seeking to decode the intricacies of market momentum across multiple time horizons. With its comprehensive suite of customizable features, including the Fast Oscillator , Scalper's Momentum , Momentum Impulse Oscillator , and Hidden Liquidity Flow , traders can gain deep insights into market dynamics and make well-informed trading decisions. Whether executing high-frequency scalping strategies or timing entries for longer-term positions, Momentum Concepts™ equips traders with the tools they need to navigate diverse market conditions with confidence. By harnessing the power of momentum analysis, this indicator empowers traders to stay ahead of the curve and capitalize on emerging opportunities in the ever-evolving financial markets.
付費腳本

Leading T3Hello Fellas,
Here, I applied a special technique of John F. Ehlers to make lagging indicators leading. The T3 itself is usually not realling the classic lagging indicator, so it is not really needed, but I still publish this indicator to demonstrate this technique of Ehlers applied on a simple indicator.
The indicator does not repaint.
In the following picture you can see a comparison of normal T3 (purple) compared to a 2-bar "leading" T3 (gradient):
The range of the gradient is:
Bottom Value: the lowest slope of the last 100 bars -> green
Top Value: the highest slope of the last 100 bars -> purple
Ehlers Special Technique
John Ehlers did develop methods to make lagging indicators leading or predictive. One of these methods is the Predictive Moving Average, which he introduced in his book “Rocket Science for Traders”. The concept is to take a difference of a lagging line from the original function to produce a leading function.
The idea is to extend this concept to moving averages. If you take a 7-bar Weighted Moving Average (WMA) of prices, that average lags the prices by 2 bars. If you take a 7-bar WMA of the first average, this second average is delayed another 2 bars. If you take the difference between the two averages and add that difference to the first average, the result should be a smoothed line of the original price function with no lag.
T3
To compute the T3 moving average, it involves a triple smoothing process using exponential moving averages. Here's how it works:
Calculate the first exponential moving average (EMA1) of the price data over a specific period 'n.'
Calculate the second exponential moving average (EMA2) of EMA1 using the same period 'n.'
Calculate the third exponential moving average (EMA3) of EMA2 using the same period 'n.'
The formula for the T3 moving average is as follows:
T3 = 3 * (EMA1) - 3 * (EMA2) + (EMA3)
By applying this triple smoothing process, the T3 moving average is intended to offer reduced noise and improved responsiveness to price trends. It achieves this by incorporating multiple time frames of the exponential moving averages, resulting in a more accurate representation of the underlying price action.
Thanks for checking this out and give a boost, if you enjoyed the content.
Best regards,
simwai
---
Credits to @loxx

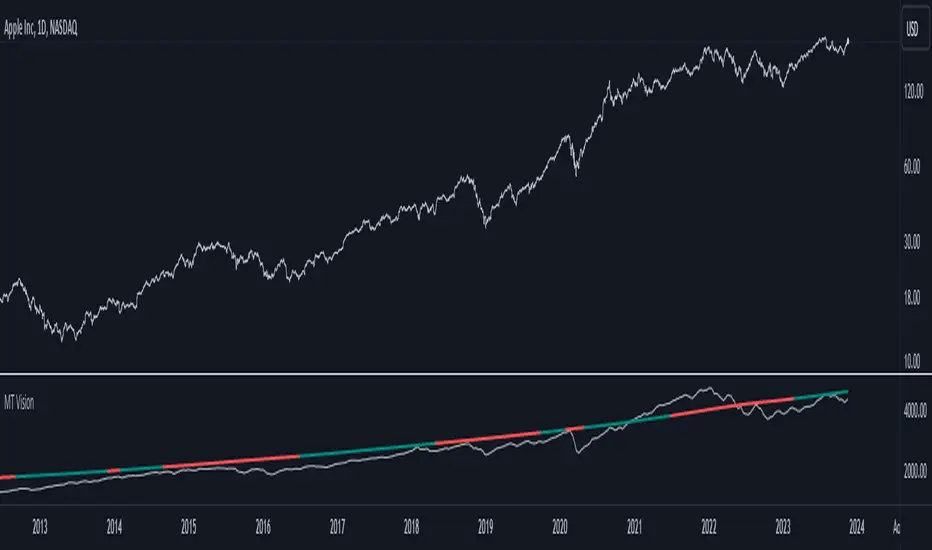
MacroTrend VisionThe "MacroTrend Vision" indicator is crafted with a singular goal – to provide traders with a quick and insightful snapshot of a country's global index. Seamlessly combining macroeconomic and technical perspectives, this tool is designed for those seeking a straightforward yet comprehensive overview. Let's explore the key features that make the "MacroTrend Vision" a valuable asset for traders looking to grasp both the big-picture economic context and technical nuances.
1. Long-Term Vision with Weekly Periods:
Gain a genuine long-term perspective with the ability to process 2500 weekly periods. This feature ensures a holistic understanding of global indices from both macroeconomic and technical viewpoints.
2. Composite Leading Indicator (CLI) Conditions:
Integrate both macroeconomic trends and technical signals through Composite Leading Indicator (CLI) conditions derived from the Relative Strength Index (RSI), offering a comprehensive outlook for informed decision-making.
3. Deviation Bands for Volatility Analysis:
Refine market analysis with strategically integrated deviation bands (0.2 and 0.4) based on smoothed linear regression. Anticipate volatility and potential trend shifts, aligning macro and technical insights.
4. Logarithmic Scale Transformation:
Enhance precision in understanding price movements with a logarithmic scale transformation, especially beneficial for assets with exponential growth patterns.
5. Separated Window for Easy Navigation:
Streamline your analysis with a user-friendly design – a separated window allowing easy navigation through different symbols without altering indicator settings.
6. Alert System for CLI Conditions:
Stay informed about critical shifts with an alert system for both long and close conditions based on the RSI of the CLI. Even during periods of limited chart monitoring, this feature keeps you connected to macroeconomic and technical changes.
In essence, the "MacroTrend Vision" is your go-to tool for a balanced view, simplifying the complexities of global indices with a blend of macroeconomic insights and technical clarity.
Leading Economic Indicator (LEI)The Leading Economic Indicator (LEI) is a groundbreaking technical indicator designed to serve as a comprehensive measure of the prevailing direction of economic trends in the United States. This unique index combines two key economic indicators: the Composite Leading Indicator (CLI) from the Organization for Economic Co-operation and Development (OECD) and the Purchasing Managers' Index (PMI) from the Institute for Supply Management (ISM).
The OECD Composite Leading Indicator (CLI) is a globally recognized indicator that assesses the future direction of economic trends by analyzing various leading economic factors. The ISM PMI, on the other hand, provides insights into the business activities of both the manufacturing and services sectors. LEI merges these critical indicators into a single, holistic indicator that empowers traders and investors to grasp the broader economic outlook and the performance of essential economic sectors simultaneously.
By taking into account the CLI and PMI, LEI offers a distinctive perspective, enabling a more accurate assessment of the potential direction of US financial markets.
Usage:
To utilize LEI effectively, it is recommended to apply it on a monthly timeframe (TF Monthly). This extended timeframe is particularly beneficial for investors with a medium to long-term horizon. By focusing on longer-term trends and market stability, LEI becomes an invaluable tool in your investment strategy.
One of the primary applications of LEI is to gauge the risk of market corrections in US financial markets, including the S&P 500, Nasdaq, and Dow Jones indices. Analysts often observe the crossing of the 5-period Simple Moving Average (SMA) with the 10-period SMA. When the 5-period SMA falls below the 10-period SMA, it serves as a potential warning signal for an impending market correction. This feature provides traders with an opportunity to exercise caution and make well-informed investment decisions.
LEI, with its unique blend of the OECD CLI and ISM PMI, provides a reliable tool for assessing the US economic climate, identifying trends, and making informed decisions in the financial markets. It stands as a reference indicator, capturing the essence of economic trends and providing valuable insights to traders and investors.
Sources:
- OECD Composite Leading Indicator (CLI): www.data.oecd.org
- Purchasing Managers' Index: ISM Report on Business (PMI) www.ismworld.org

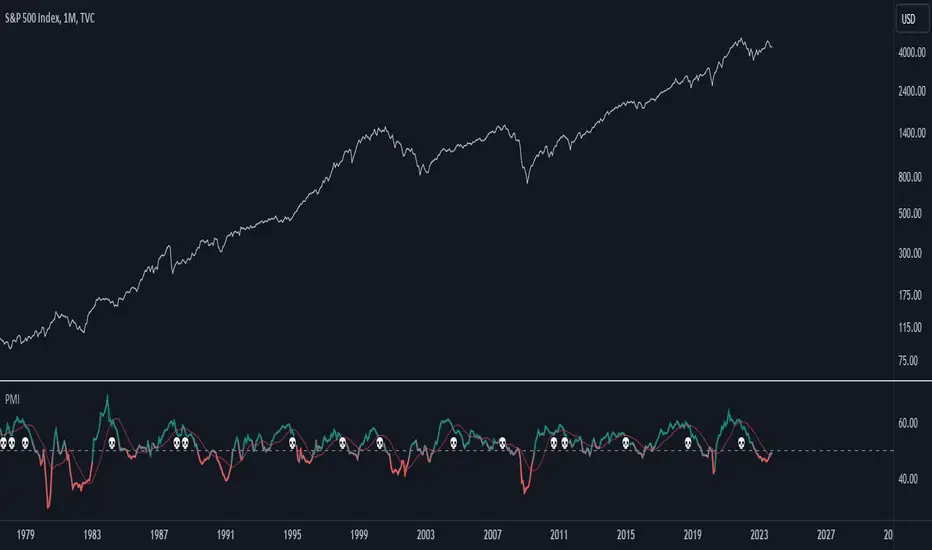
Purchasing Managers Index (PMI)The Purchasing Managers Index (PMI) is a widely recognized economic indicator that provides crucial insights into the health and performance of an economy's manufacturing and services sectors. This index is a vital tool for anticipating economic developments and trends, offering an early warning system for changes in these sectors.
The PMI is calculated based on surveys conducted among purchasing managers in various businesses and organizations. These managers are asked about their perceptions of current business conditions and their expectations for future economic activity within their sectors. The responses are then compiled and used to calculate the PMI value.
A PMI value above 50 typically indicates that the manufacturing or services sector is expanding, suggesting a positive economic outlook. Conversely, a PMI value below 50 suggests contraction, which may be an early indication of economic challenges or a potential recession.
In summary, the Purchasing Managers Index (PMI) is an essential economic indicator that assesses the health of manufacturing and services sectors by surveying purchasing managers' opinions. It serves as an early warning system for changes in economic activity and is a valuable tool for forecasting economic trends and potential crises.
This code combines the Purchasing Managers Index (PMI) data with two Simple Moving Averages (SMA) and some visual elements.
Let's break down how this indicator works:
1. Loading PMI Data:
The indicator loads data for the "USBCOI" symbol, which represents the PMI data. It fetches the monthly closing prices of this symbol.
2. Calculating Moving Averages:
Two Simple Moving Averages (SMAs) are calculated based on the PMI data. The first SMA, sma_usbcoi, has a length defined by the input parameter (default: 2). The second SMA, sma2_usbcoi, has a different length defined by the second input parameter (default: 14).
3. Color Coding and Thresholds:
The line color of the PMI plot is determined based on the value of the PMI. If the PMI is above 52, the color is teal; if it's below 48, the color is red; otherwise, it's gray. These threshold values are often used to identify specific conditions in the PMI data.
4. Crossing Indicator:
A key feature of this indicator is to determine if the PMI crosses the first SMA (sma_usbcoi) from top to bottom while also being above the value of 52. This is indicated by the crossedUp variable. This condition suggests a specific situation where the PMI crosses a short-term moving average while indicating strength (above 52).
5. Visual Elements:
A "💀" skull emoji is defined as skullEmoji.
The PMI is plotted on the chart with color coding based on its value, as described earlier.
The two SMAs are also plotted on the chart.
When the crossedUp condition is met (PMI crosses the first SMA from top to bottom while above 52), a skull emoji (indicating potential danger) is plotted at the top of the indicator window.
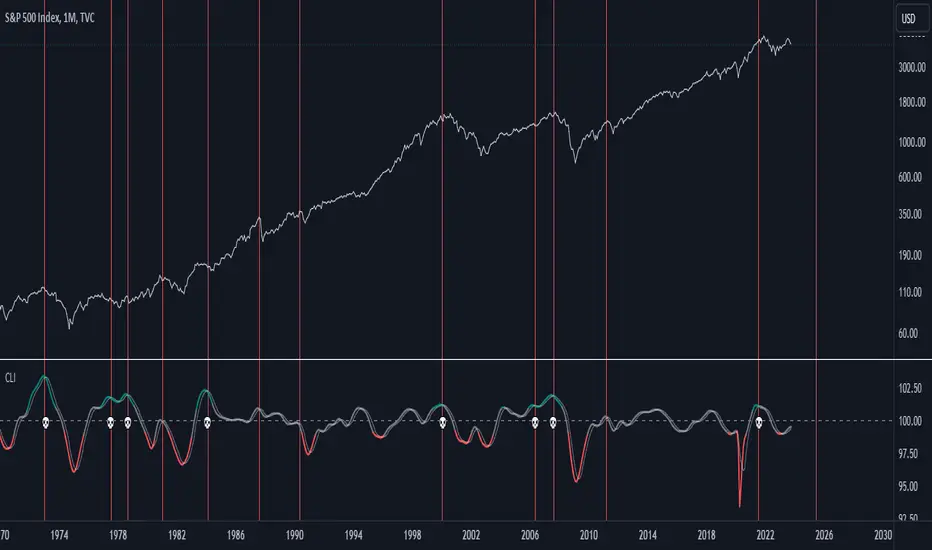
US Composite Leading Indicator (CLI)The US Composite Leading Indicator (CLI), normalized for the United States, closely mirrors the Conference Board "Leading Economic Index" (LEI). It offers unique insights into economic and financial dynamics.
The Composite Leading Indicator (CLI) is an economic tool designed to anticipate economic developments. It is created by aggregating and normalizing a wide range of economic and financial data from various sources.
The normalized data is then aggregated, and a composite indicator is calculated by taking a weighted average of individual indicators.
The CLI is used to provide early insights into the state of the economy and to anticipate future economic trends. It is particularly valuable for predicting economic downturns, including recessions.
The CLI is an essential tool for economists, governments, businesses, and investors seeking to understand economic trends and make informed decisions.
Key Features:
1. Early Warning: Just like its counterpart, the CLI indicator excels at offering early warnings about significant economic events, particularly economic crises. This makes it an indispensable asset for analysts and investors.
2. Recession Indicators: The moving average serves as an early warning system for potential economic recessions. When it crosses the indicator line from the bottom to the top while surpassing a predefined threshold (e.g., 101), it signals a potential crisis.
3. Market Impact: The CLI indicator provides valuable insights into the performance of financial markets, offering cues about indices such as the S&P 500, Nasdaq, Dow Jones, and more.
Why It Matters:
Understanding the US Composite Leading Indicator (CLI) indicator, normalized for the United States, is crucial for anticipating economic shifts and preparing for changes in financial markets. By analyzing a diverse array of economic factors, it provides a holistic view of economic well-being. Whether you're an investor or economist, this indicator can be an invaluable resource for staying informed about market trends and major economic developments.
Source:
www.data.oecd.org
SFC Macroeconomics 2Macroeconomics is the most important part of the financial markets. If the trader/investor could predict the economic cycles, the chance of making money is much greater.
This is the second macroeconomic indicator, which gives us a more detailed picture of yields and some leading indicators. Trying to predict a recession is the main goal.
The indicator is showing:
- Yield curve
- 2-10Y Yield spred
- All Yields spread
- Yield Comparison between two countries
- Recessionary leading indicators
How to use:
-Load the indicator and see observe the yield curves and how the market moves.
-Use leading indicators to predict recession
By combining the indicator with the first version, investors/traders could get a complete picture of the economy situation and what the current phase of the business cycle is.
Note:
Yellow colour - leading indicators
Orange colour - legging indicators
Before using this indicator, traders/investors need a basic understanding of macroeconomics. A good knowledge is required to take advantage of the indicator and create economic analysis.

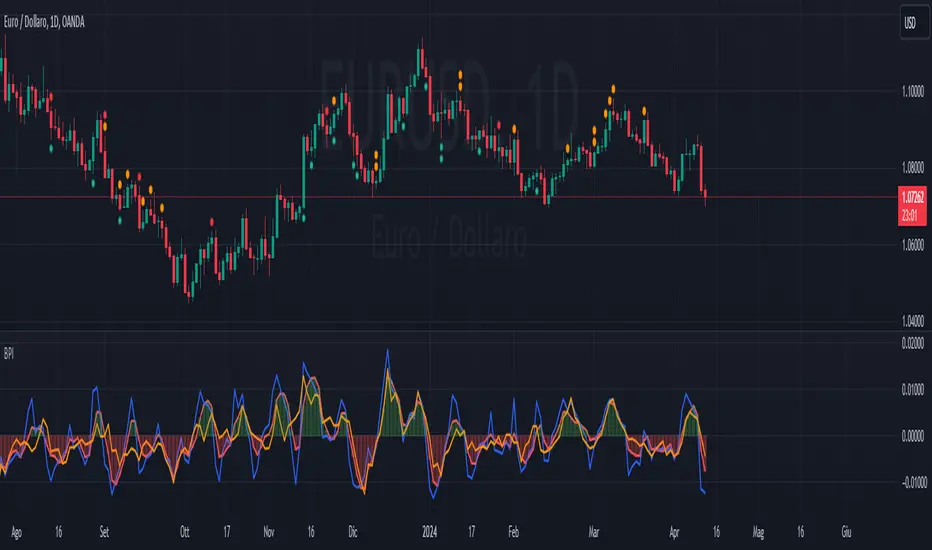
Bayesian predictive leading indicator--------- ENGLISH ---------
This is a predictive indicator ( leading indicator ) that uses Bayes' formula to calculate the conditional probability of price increases given the angular coefficient. The indicator calculates the angular coefficient and its regression and uses it to predict prices.
Bayes' theorem is a fundamental result of probability theory and is used to calculate the probability of a cause causing the verified event. In other words, for our indicator, Bayes' theorem is used to calculate the conditional probability of one event (price event in this case) with respect to another event by calculating the probabilities of the two events (past price) and the conditional probability of the second event (future price) with respect to the first event.
The red line represents the angular coefficient. The blue line represents the normalized expected price. Finally, the yellow line represents the conditional probability that the price will increase or decrease.
How to use it. In addition to the convenient histogram, which follows the angular coefficient, another practical operational application might be to go long when the blue line is above the red and yellow lines. Conversely short when the blue is below the red and yellow.
When the yellow line passes above all others, a reversal in the long direction is imminent and vice versa.
The extent of the reversal depends on how far the yellow line will be away in price from the other 2 lines.
This indicator is in its embryonic state and updates will follow to make it more graphically readable, add alerts, etc.
Stay tuned! Leave a boost and comment or write to me if you wish.
--------- ITALIANO ---------
Questo è un indicatore predittivo ( leading indicator ) che utilizza la formula di Bayes per calcolare la probabilità condizionata che il prezzo aumenti dato il coefficiente angolare. L’indicatore calcola il coefficiente angolare e la sua regressione e lo utilizza per prevedere i prezzi.
Il teorema di Bayes è un risultato fondamentale della teoria della probabilità e viene impiegato per calcolare la probabilità di una causa che ha provocato l’evento verificato. In altre parole, per il nostro indicatore, il teorema di Bayes serve per calcolare la probabilità condizionata di un evento (di prezzo in questo caso) rispetto a un altro evento, calcolando le probabilità dei due eventi (prezzo passato) e la probabilità condizionata del secondo evento (prezzo futuro) rispetto al primo.
La linea rossa rappresenta il coefficiente angolare. La linea blu rappresenta il prezzo previsto normalizzato. Infine la linea gialla rappresenta la probabilità condizionata che il prezzo aumenti o diminuisca.
Come si usa? Oltre al comodo istogramma, che segue il coefficiente angolare, un'altra applicazione operativa pratica potrebbe essere di andare long quando la linea blu è sopra la linea rossa e gialla. Viceversa short quando la blu è sotto la rossa e la gialla.
Quando la linea gialla passa sopra tutte le altre è imminente un'inversione in direzione long e viceversa.
L'entità dell'inversione dipende da quanto la linea gialla sarà distante di prezzo dalle altre 2 linee.
Questo indicatore è al suo stato embrionale e seguiranno aggiornamenti per renderlo graficamente più leggibile, aggiungere alert, ecc.
Stay tuned! Lascia un boost e commenta o scrivimi se desideri.
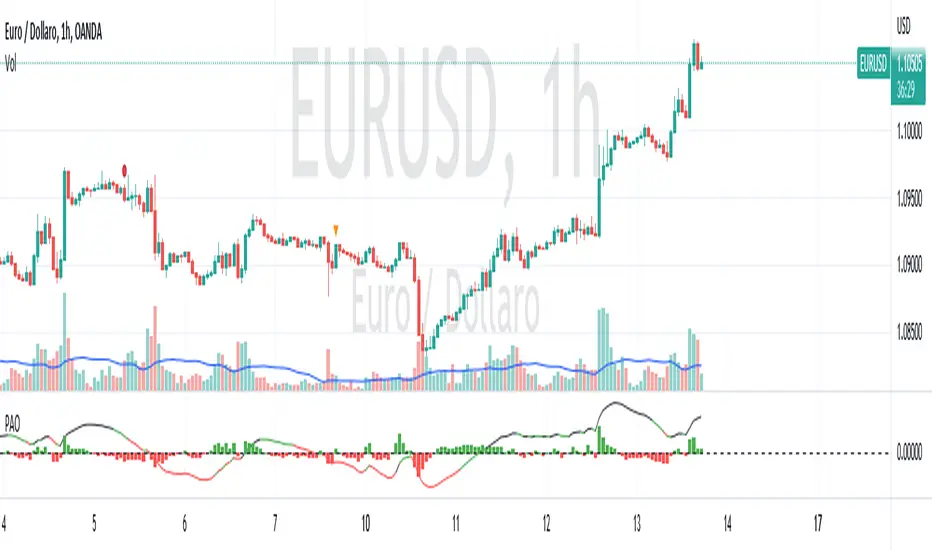
Price Action Oscillator with RSI--------- ENGLISH ---------
This oscillator combines the Price Action and the Relative Strength Index (RSI) to help identify potential buy and sell signals in a market. The Price Action Oscillator measures the difference between the closing price and a 20-period moving average, and then normalizes this value by dividing it by the standard deviation of the closing price from the same moving average. The result is an oscillator that oscillates around zero, with positive values indicating that the closing price is above the moving average and negative values indicating the opposite. The oscillator is then normalized again to smooth out the curve.
The RSI is also calculated using a 14-period setting. The color of the oscillator line is determined by its normalized value and the RSI level. A green color is used for averaging values, black for values when the RSI is above 70, and red for values when the RSI is below 30. A dashed line is also plotted at the zero level to help identify potential buy and sell signals.
Traders can use this script to identify potential buy and sell signals based on the cross of the oscillator line with the zero line, as well as the color of the oscillator line. A buy signal may be identified when the oscillator line crosses above the zero line and is colored black, while a sell signal may be identified when the oscillator line crosses below the zero line and is colored red.
---------- ITALIAN -------------
Questo oscillatore combina l'oscillatore Price Action e l'Indice di Forza Relativa (RSI) per aiutare a identificare potenziali segnali di acquisto e vendita in un mercato. L'oscillatore Price Action misura la differenza tra il prezzo di chiusura e una media mobile a 20 periodi, e poi normalizza questo valore dividendo la differenza per la deviazione standard della chiusura dalla stessa media mobile. Il risultato è un oscillatore che oscilla intorno allo zero, con valori positivi che indicano che il prezzo di chiusura è sopra la media mobile e valori negativi che indicano il contrario. L'oscillatore viene poi nuovamente normalizzato per levigare la curva.
L'RSI viene anche calcolato utilizzando una configurazione a 14 periodi. Il colore della linea dell'oscillatore è determinato dal suo valore normalizzato e dal livello RSI. Viene utilizzato il colore verde per i valori medi, nero per i valori quando l'RSI è superiore al 70 e rosso per i valori quando l'RSI è inferiore al 30. Viene anche disegnata una linea tratteggiata a livello dello zero per aiutare a identificare potenziali segnali di acquisto e vendita.
I trader possono utilizzare questo script per identificare potenziali segnali di acquisto e vendita in base all'incrocio della linea dell'oscillatore con la linea dello zero, nonché al colore della linea dell'oscillatore. Un segnale di acquisto può essere identificato quando la linea dell'oscillatore incrocia sopra la linea dello zero e viene colorata di nero, mentre un segnale di vendita può essere identificato quando la linea dell'oscillatore incrocia sotto la linea dello zero e viene colorata di rosso.
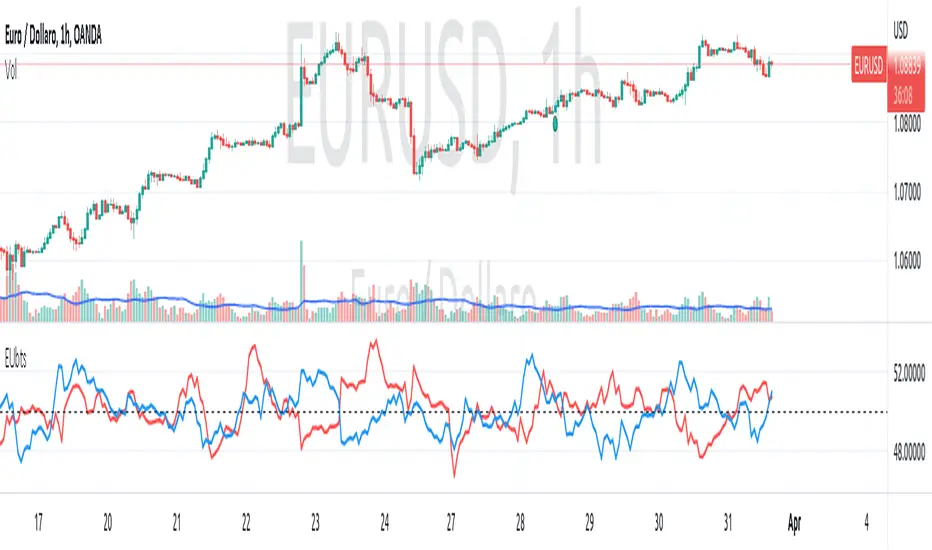
EURUSD balancing trading system--- CONCEPT - HOW IT WORKS ---
This script is based on the percentage difference of the price action movements of EUR and USD
--- WHAT IS IT FOR? ---
It's a trend following script with leading capabilities. It works on every TF, best over H1 on EURUSD pair.
--- HOW TO USE IT? ---
Simply you have buy or sell signal looking at crossing lines. You should regard the "50" level as strengthening the trend if higher and weakening if lower. It is possible to change the currency reference period and smoothing period according to your needs and trading style.
--- WHERE SHOULD I USE IT? ---
On forex market on EURUSD pair. Backtest it by yourself before using it.
---- DISCLAIMER ----
The use and provision of this indicator is not intended to solicit the user for investment. It was created purely for educational purposes and for testing.
The author assumes no responsibility regarding the use of this indicator and any losses it may generate.
By using it, the user assumes any risks that may occur.
Munich GuppyWELCOME to the Munich Guppy!
This is a simple moving average indicator that will help you determine the trend of your chart using historical moving averages.
The indicator consists of 3 EMA's and one ALMA moving average. Using these 4 moving averages I have programmed the relationship between the moving averages to color the background of your chart.
If your background is red, this means that the alma moving average has fallen below the EMA's (EMA1 and EMA 2) as well as (EMA 1 and EMA 2) are postured in a down trending/up trending fashion
For example, the 21EMA is greater than the 55EMA, this signals that the chart has been outperforming its intermediate averages. Now if the ALMA is below both the 21ema and 55ema, in this instance, your chart background will become green.
The ALMA has color options '+CoC' and '-Coc', this simply means if the candle closes below the alma, it will turn red, if closure above it will turn green.
EMA 3 which is default set to 200, has no affect on the color of the background.
Now I hope I have thoroughly explained the simplicity of this indicator, if you have any questions leave them below or private message me for any other requests,
Good Trading!
-CheatCode1

On Balance Volume DeviationThe objective of this indicator is to be a leading indicator that can detect a large price change before it happens. It is based on the On Balance Volume (OBV) indicator, which is a leading indicator based on the premise that a large change in volume often precedes a large price change. This indicator charts the N-Period deviation of the OBV data and displays it as a histogram. This is overlayed on an area chart of the M-Period SMA of the histogram data. This combination helps to visually enhance the pattern that signifies that a jump in price is about to happen.
Useage:
When the histogram bars are above the area plot, then a jump in price is about to happen
As with all leading indicators, there are a lot of false signals. Confirm with price action or another indicator
The further the histogram bars are above the area plot, the larger the predicted jump in price
It seems to work better on shorter intraday timeframes than on the longer timeframes
At the close of a market session, it is a good indicator of how much the price will jump on the opening of the next market session.

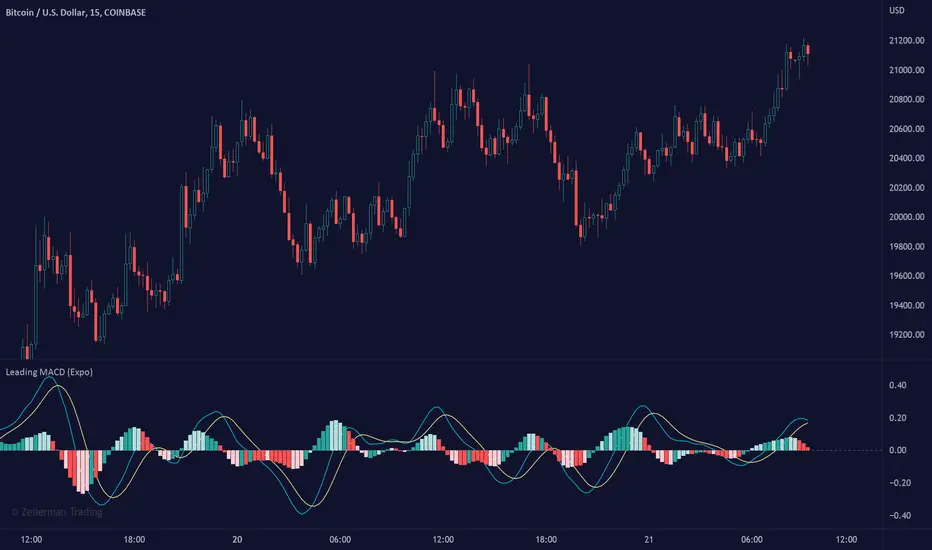
Leading MACD (Expo)Leading MACD (Expo) is designed to anticipate future price action, enabling traders to predict market movements ahead of time. The idea of a leading indicator is that traders can get in before the price move happens and ride the entire trend.
█ Moving average convergence divergence (MACD) is considered one of the most effective momentum and trend-following oscillators. However, the MACD is based on historical price action, making it a lagging indicator. A lagging indicator usually provides signals or insight once the price movement has passed or is in progress. That is why lagging indicators often are used to confirm a price trend or a move. On the other hand, the MACD histogram is more of a leading feature that can act as a sign of future trend changes.
█ The Leading MACD indicator takes all advantages of the traditional MACD and converts it into a fast-moving and leading oscillator that provides real-time insights about potential future price moves. As a result, it gives traders time to analyze a possible upcoming price move before it happens and be prepared for what's coming. However, the leading MACD should be combined with other forms of technical analysis to confirm potential entries and exits.
█ Leading vs. Lagging MACD
The leading MACD looks ahead and helps traders prepare for potential price moves. The traditional (lagging) MACD confirms price action that already has happened. A leading indicator reacts quicker to price changes, while a lagging indicator reacts slower. The different types of MACD have their own advantages and drawbacks, so make sure you understand the leading MACD and see if it fits in with your trading strategy.
█ HOW TO USE
Use the Leading MACD to get insights about potential price changes ahead of time. Get insights about whether a bullish or bearish move is strengthening or weakening. Other common ways are looking for divergences, finding trends, and measuring current momentum.
-----------------
Disclaimer
Copyright by Zeiierman.
The information contained in my Scripts/Indicators/Ideas/Algos/Systems does not constitute financial advice or a solicitation to buy or sell any securities of any type. I will not accept liability for any loss or damage, including without limitation any loss of profit, which may arise directly or indirectly from the use of or reliance on such information.
All investments involve risk, and the past performance of a security, industry, sector, market, financial product, trading strategy, backtest, or individual's trading does not guarantee future results or returns. Investors are fully responsible for any investment decisions they make. Such decisions should be based solely on an evaluation of their financial circumstances, investment objectives, risk tolerance, and liquidity needs.
My Scripts/Indicators/Ideas/Algos/Systems are only for educational purposes!
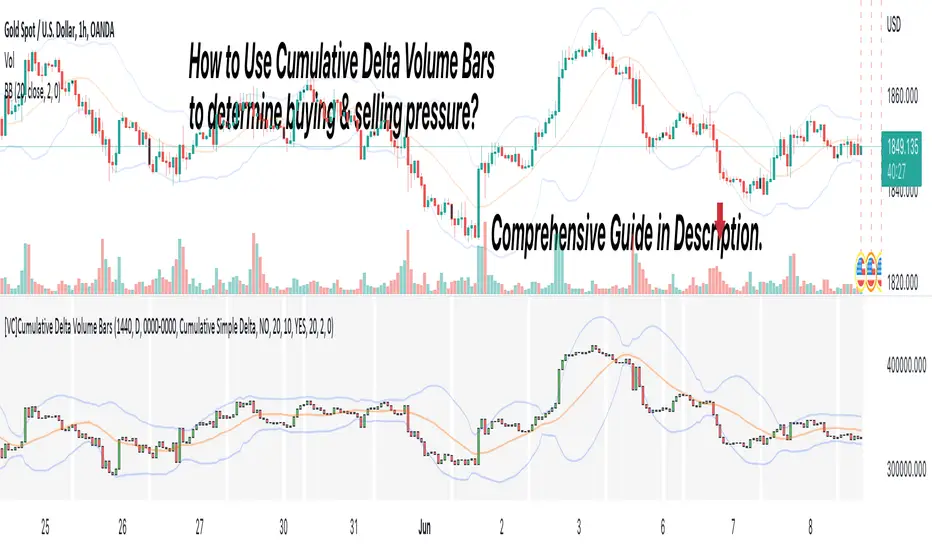
[VC] Cumulative Delta Volume BarsLet's first learn what is Delta & How to Use Cumulative Delta Volume Bars?
Cumulative Delta Volume Bars is one of the leading indicators that you can use when trading order flow. It gives you an instant snapshot of the buying and selling pressure in a market.
After reading the detailed description of "Cumulative Delta Volume Bars," you will understand how volume delta provides a critical edge by allowing you to spot significant potential reversals in the market. You will also learn to use this Cumulative Delta indicator in depth. (including rest session usability features)
What is Delta Volume?
Delta Volume is the difference between Buying and Selling Power. Delta Volume is calculated by taking the difference between the volume traded at the offer price and the volume traded at the bid price. (in simple words, the difference between buying pressure & selling pressure)
If delta volume is more than zero, you have more buying pressure than selling & vice versa, and if delta volume is less than zero, you have more selling pressure than buying.
In Order-Flow Analysis , traders used Cumulative Delta to measure the relationship between the Buying & Selling pressure Vs Price.
Cumulative delta volume takes the delta values for every bar and successively adds them together to provide a graph, as seen below visually.
Let me demonstrate by giving examples of how cumulative Delta can help measure the buying or selling pressure relative to the price move.
★ Trading Absorption & Exhaustion concepts with Delta
See the chart below & try to analyze the next possible move on the basses on the analysis mentioned on the chart.
➽➽ If you said Short, you were correct. ✅
Till Point A , both price & cumulative were aligned. (means there were no imbalances between Delta & Price).
But on Point B , the Cumulative Delta broke the previous resistance clearly and moved even further away from the resistance level, but the Price couldn't break the last resistance. It interprets that buyers applied a lot of buying pressure but no result. (Aggressive buying pressure absorbed by Passive sellers)
Due to this vast effort or failed attempt, buyers were exhausted and had no more strength to pull the Price up. That's why the Price reversed from Point B . See below image
★ Cumulative Delta Volume Bars is helpful when determining buying or selling pressure at different key price levels, such as swing highs or lows.
Let's recap on swing highs and swing lows.
➽ A swing high (S.H) is formed when the high reaches higher than the price action around it. Once the Price moves above a prior swing high and begins to retrace, a new swing high is formed.
➽ A swing low (S.L) is formed when the low reaches lower than price action around it. Once the Price moves below a prior swing low and begins to retrace, a new swing low is formed.
➽ When the Price makes higher highs and higher lows, a market is considered an uptrend.
➽ When the Price is making lower lows followed by lower highs, a market is considered a downtrend.
When evaluating Delta, it's beneficial to compare delta values at swing lows or swing highs to determine the amount of selling or buying pressure and how the market reacts.
The actual Power of Delta is revealed when we use it to determine the market's reaction to powerful buying or selling. We want to see if the market has reacted as we would expect or not.
In the above Example, you will notice that every time price breaks a swing, Delta does as well.
It makes sense as it takes selling pressure to break a swing low or buying pressure to break a swing high. In simple words, we can say that there is no anomaly between delta direction & price direction.
In simple words (No Absorption or Exhaustion)
But what's occurring when this isn't the case, and we have divergence between Price and Delta? Let's analyze it with real examples.
★ Understanding Delta Divergence.
(Lack of Harmony in Buying/Selling Pressure & Price Move)
Notice how the Price breaks out of the previous resistance level on the above chart, but the Delta didn't yet reach even close to its last resistance level. It's a clear divergence between Price and Delta. Buyers may be slightly exhausted at the previous resistance level, and Price & Delta may retrace slightly. But in a broader view, it reflects a strong bullish signal.
See the above chart & see when and why the Price moved. I hope it will help you understand the underlying relation & story between Price & Delta.
Cumulative Delta & Trade Management
Delta will help you spot significant reversals, but it can also be used to help manage your open trade. You want to see a high correlation between Delta and Price when in a long or short position.
Suppose you're short while the Price is breaking a new low. You want to see Delta breaking low if sellers aren't interested in selling at the recent lows, represented by Delta not breaking lows. The probability of a short term reversal or a significant retrace increases.
When in a position, always be on the lookout for exhaustion and absorption, signalling a reversal potential.
What Includes in V.C Cumulative Delta Volume Bars Indicator
Inputs & Settings
Reset accumulation on new session:
Allows you to rest accumulation at the start of each session (you may choose your customized starting & ending time as well by enabling ''Customize Rest Session Time''
Start/End of Session & During Session:
Allows you to show/hide & choose the background color & separator of each session
''Customize Rest Session Time''
When this setting is enabled, your customized given time will be applied, which can be set from the below box. Note: set your time in minutes. For Example, if you want to reset the session after every hour, you need to put 60. If you're going to reset after every 8 hours, you need to put 480. Additionally, your chart time frame must be lower than your customized rest time.
Reset Each Minutes:
Allows you to put your desired rest time in minutes. For Example, for 1 hour 60, for 8 hours 480. (8x60)
Reset Each:
Allows you to choose rest time from the drop-down menu. Note: To apply this setting, don't enable the ''CUSTOMIZE RESET SESSION TIME''.
Select Session:
Allows you to set customized starting & ending times of the session instead of the exchange's default time. For Example, the exchange reset time is 20:00, but if you want 22:00, first, you need to set your chart time as an exchange from the right bottom of the chart, and then you need to put 22:00 22:00 in both fields. Note: Put the same starting & ending time. In simple words, it should not be greater than or less than 24 hours.
Type:
It allows you to select Delta type. (there are two delta types you can choose from, 1st Simple Delta, 2nd Delta % or Volume Weighted Delta)
Candle Colors:
Allows you to change the color of candles.
Envelope Indicator:
Allows you to apply to Envelop Indicator on the delta candle. (all default settings of the Envelop Indicator can be customized as well)
See the below chart with Envelop applied to Delta Candles & Price Candles. (can be used to measure the Delta & Price movement at the micro-level)
Bollinger Bands Indicator:
Allows you to apply to Bollinger Bands Indicator on the delta candle. (all default settings of the Bollinger Bands Indicator can be customized as well)
See the below chart with Bollinger Bands applied to Delta Candles & Price Candles. (can be used to measure the Delta & Price movement at the micro-level)
Start/End of Session on Chart
Allows you to change the first & last candle of the session.
Style Settings:
Allows you to control all the visual settings of delta candles, Envelop & Bollinger bands.
-------------------------------------------------
➽Conclusion:
Cumulative Volume Delta Bars is one of the leading indicators you can include as an order flow trader in your arsenal. It gives you an inside look at buying and selling pressure and how the market reacts.
But Keep in mind, in trading & technical analysis, nothing is 100% certain. No indicator can give you a 100% success rate. There is no holy grail in the financial market. As a trader, with the help of technical & fundamental indicators, our goal is to find an edge over the market. A simple definition of an edge is: Anything that adds a few points to the winning side of an equation builds an edge that lasts a lifetime. A trading edge defines your technical or strategic advantage in the highly competitive market environment. Traders can establish multiple edges by starting with popular strategies and customizing rules to lower the risk of getting trapped with the emotional crowd.
Disclaimer Note:
V.C Cumulative Delta Volume Bars It is purely Volume, Delta, Demand & Supply imbalance and comparative analysis based tool. Before applying this Indicator to your study, you should know about Volume, Delta & Spread, Demand & Supply, and Aggressive & Passive behaviour of buyers/sellers.
Some basic understanding of Sir Richerd Wyckoff's Theory can also be helpful.
Precise Supply Demand Levels
Concept of Supply and Demand Zones
The concept of supply and demand zones is confusing to some traders. And most tend to believe it's not a concrete concept to be relied upon as they don't exactly know where to draw the lines precisely that best represents the supply and demand zones.
A demand zone is where most traders placing their buy order based on the historical trade analysis; these areas could be found at the lowest low with strong support levels. A demand zone is formed where price is most deviated from it's equilibrium market price in lower direction where most sellers has exhausted their energy along the way and the buyers has regained their energy for a bullish momentum.
A supply zone is where most traders placing their sell orders. These are are often found at the highest high with strong resistance level. A supply zone is formed where price is most deviated from it's equilibrium market price in higher direction where most buyers has exhausted their energy along the way and the sellers has regained their energy for a bearish momentum.
Underlying Algorithm used in the indicator
I am using the of concept of "Frequency Lines" to calculate the areas. Lines with the highest frequency has the most support and resistant strength to cause a reversal on the opposite direction.
Settings and Stylings
Lookback : Default is 50 (The lookback period for calculatibf pivots)
No of Pivots: Default is 3 (The maximum number of pivots to consider, higher will result more boxes)
Aligned: Default is True
Whether to align the supply demand levels or not. If true, it will check the deviation of adjacent supply demand levels, if they are very close it will align themselves vertically to create a single level of support or resistance.
A layout with the levels not aligned
Aligned layout
This levels also will most of the times work as support and resistance levels.
I haven't added any other extra features to make the performance robust. Although I might add in future upon requests.
For now I am keeping it in protected mode, as this is my first indicator script and I am unsure of what to expect from it, but If I get enough of your support and love, I might make the source code public.
Thank you for visiting my page and I hope this helps in your trading journey. If it does truly help, follow me as I will be publishing many more indicators soon.

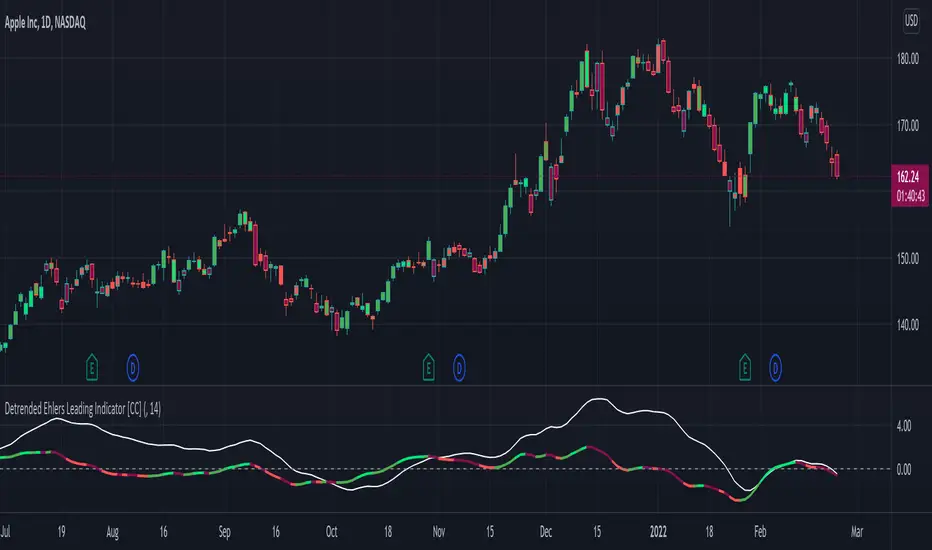
Detrended Ehlers Leading Indicator [CC]The Detrended Ehlers Leading Indicator was created by Bill Mars based off of Ehlers work and this is his attempt to create a leading indicator based on the previous Detrended Synthetic Price . I will be honest that this is a bit of a strange script because it is an indicator based off of the detrended synthetic price which is based off of Ehlers work so I haven't found clear buy and sell signals so I'm open to suggestions. His suggestion for buy and sell signals is to only buy and sell at the indicator crossings but haven't found buy and sell logic that I'm sure about. I have included strong buy and sell signals in addition to normal ones so strong signals are darker in color and normal signals are lighter in color. Buy when the line turns green and sell when it turns red.
Let me know if there are any other indicators or scripts you would like to see me publish!
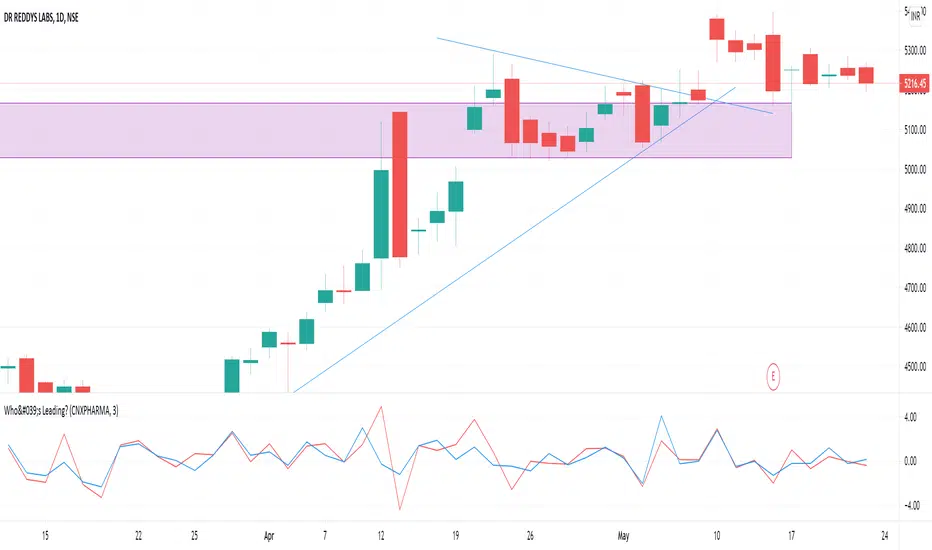
Who's Leading?Indicator plots percent change of close price for current symbol and a comparative symbol.
You can also plot SMA instead of closing price to add smoothness to the trend.
Objective: Analyze if the stock leads the index or is lead by the index.
Hope this is helpful
Best,
Swan
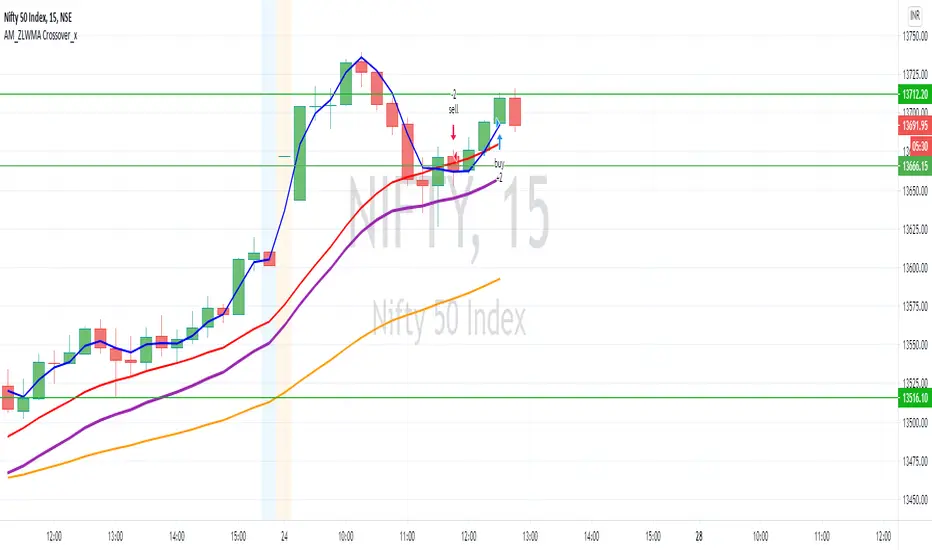
AM_ZLWMA Crossover_xDear All,
Please find updated version of Zero lag WMA crossover. In addition to this added 20/50 EMA to get better results.
Settings:
ZLWMA = 8 identified by Blue line
Fast WMA = 21 identified by Red line
EMA Period 20/50
How to Trade:
Buy: Wait for positive crossover (Blue cross above Red) to happen trade can be taken there but to get better results post crossover once price move above EMA 20 then buy can be initiated.
Sell: Wait for negative crossover (Blue cross below Red) to happen trade can be taken there but to get better results post crossover once price move below EMA 20 then sell can be initiated.
Reason to wait for confirmation of price action above / Below moving average is most of the time it happens that even after crossover happens sometimes it was just a pull back and from there it could be a possibility for reversal. Once price action confirms moving above / below EMA20 then trade will be initiated.
Please comment and ask for any doubt
[blackcat] L2 Ehlers Leading IndicatorLevel: 2
Background
John F. Ehlers introuced Leading Indicator in his "Cybernetic Analysis for Stocks and Futures" chapter 16 on 2004.
Function
The leading characteristic is present in the net filte.As predicted, the lead is one bar at very low frequencies. That is, the trend indication will lead by one bar. However, the net filter has a lag of approximately 2.5 bars for cycle components near 20-bar cycles. Also, higher-frequency lag settles down to be about half a bar. The interpretation of the lag response is that the filter predicts a continuation of a trend by 1 bar, lags abrupt changes by about 0.5 bars, and lags smooth changes that can be fitted by segments of a 20-bar sinewave by as much as 2.5 bars. That’s the law of physics—you cannot get something for nothing. Causal filters can have a predictive capability over some portion of the frequency response, but not at all frequencies. There is no magic predictor.
Key Signal
NetLead ---> Leading Indicator fast line
EMA ---> Leading Indicator slow line
Pros and Cons
100% John F. Ehlers definition translation of original work, even variable names are the same. This help readers who would like to use pine to read his book. If you had read his works, then you will be quite familiar with my code style.
Remarks
The 35th script for Blackcat1402 John F. Ehlers Week publication.
Readme
In real life, I am a prolific inventor. I have successfully applied for more than 60 international and regional patents in the past 12 years. But in the past two years or so, I have tried to transfer my creativity to the development of trading strategies. Tradingview is the ideal platform for me. I am selecting and contributing some of the hundreds of scripts to publish in Tradingview community. Welcome everyone to interact with me to discuss these interesting pine scripts.
The scripts posted are categorized into 5 levels according to my efforts or manhours put into these works.
Level 1 : interesting script snippets or distinctive improvement from classic indicators or strategy. Level 1 scripts can usually appear in more complex indicators as a function module or element.
Level 2 : composite indicator/strategy. By selecting or combining several independent or dependent functions or sub indicators in proper way, the composite script exhibits a resonance phenomenon which can filter out noise or fake trading signal to enhance trading confidence level.
Level 3 : comprehensive indicator/strategy. They are simple trading systems based on my strategies. They are commonly containing several or all of entry signal, close signal, stop loss, take profit, re-entry, risk management, and position sizing techniques. Even some interesting fundamental and mass psychological aspects are incorporated.
Level 4 : script snippets or functions that do not disclose source code. Interesting element that can reveal market laws and work as raw material for indicators and strategies. If you find Level 1~2 scripts are helpful, Level 4 is a private version that took me far more efforts to develop.
Level 5 : indicator/strategy that do not disclose source code. private version of Level 3 script with my accumulated script processing skills or a large number of custom functions. I had a private function library built in past two years. Level 5 scripts use many of them to achieve private trading strategy.

MACD-ASHello All,
This the script for Moving Average Convergence Divergence – MACD of Thomas Aspray, and called as MACD-AS and you may get earlier signals than MACD.
As MACD and MACD-AS are trend following indicators, they do not function well in sideway markets.
An example how it gets earlier signals than MACD
Good luck!
