EMA Trend Dashboard
Trend Indicator using 3 custom EMA lines. Displays a table with 5 rows(position configurable)
-First line shows relative position of EMA lines to each other and outputs Bull, Weak Bull, Flat, Weak Bear, or Bear. EMA line1 should be less than EMA line2 and EMA line 2 should be less than EMA line3. Default is 9,21,50.
-Second through fourth line shows the slant of each EMA line. Up, Down, or Flat. Threshold for what is considered a slant is configurable. Also added a "steep" threshold configuration for steep slants.
-Fifth line shows exhaustion and is a simple, configurable calculation of the distance between EMA line1 and EMA line2.
--Lines one and five change depending on its value but ALL other colors are able to be changed.
--Default is somewhat set to work well with Micro E-mini Futures but this indicator can be changed to work on anything. I created it to help get a quick overview of short-term trend on futures. I used ChatGPT to help but I am still not sure if it actually took longer because of it.
Lines

Multi Horizontal Lines 1000 Bars
This indicator is not my code, I have copied this from another user and extened the lines so they go back 1000 bars for back testing.
I use this indicator to trade Crude Oil and set the horizontal lines to 20 cents increments, 0.2 is 20 cents. You can change the horizontal lines to any price distance to suit your style of trading.
My idea is when price crosses over a horizontal line I will enter a trade long or short looking to secure 20 cents.

Zig Zag Trend Metrics“ Zig Zag Trend Metrics ” is a highly versatile indicator, built on the classic Zig Zag concept and thoughtfully designed for technical traders seeking a deeper, more structured view of market dynamics. This tool identifies significant swing highs and lows, classifies them, and annotates each with key metrics, offering a precise snapshot of each movement. It enhances visual analysis by drawing connecting lines that outline the flow of market structure, making trend progression and reversals instantly recognizable. Beyond visual mapping, it features a compact, real-time statistics table that calculates the average price and time deltas for both bullish and bearish swings, giving traders deep insights into trend momentum and rhythm. With extensive customization options, this indicator adapts seamlessly to vast trading styles or chart setups, empowering traders to spot patterns, evaluate trend strength, and make more confident, data-backed decisions.
❖ FEATURES
✦ Automatic Swing Detection
At its core, this indicator automatically identifies swing highs and lows based on a customizable lookback period (default: 10 bars).
✦ Labeling Swing Points
Each swing is visualized with a label that includes:
Swing Classification : “HH” (Higher High), “LH” (Lower High), “LL” (Lower Low), or “HL” (Higher Low).
Price Difference : Displayed in percentage or absolute value from the previous opposite swing.
Time Difference : The number of bars since the previous swing of the opposite type.
These labels offer traders clear, immediate insight into price movements and structural changes.
✦ Visual Lines
The indicator draws three types of lines:
Bullish Lines: Connect recent swing lows to new swing highs, indicating uptrends.
Bearish Lines: Connect recent swing highs to new swing lows, indicating downtrends.
Range Lines: Connect consecutive highs or lows to outline price channels.
Each line type can be color-coded and customized for visibility.
✦ Statistics Table
An on-screen metrics table provides a live summary of trends. Script uses Relative Averaging to smooth price and time changes. This prevents outliers from distorting the data and provides a more reliable sense of typical swing behavior.
Uptrend Metrics: Shows average price and time differences from recent bullish swings.
Downtrend Metrics: Shows the same for bearish swings.
🛠️ Customization Options
Ability to tailor the indicator to suit their strategy and aesthetic preferences:
Swing Period: Adjust sensitivity to short- or long-term swings.
Color Settings: Customize line and label colors.
Label Display: Choose between absolute or percentage price differences.
Table Settings: Modify size, location, or visibility.
This makes the indicator highly flexible and useful across various timeframes and assets.

RSI with Trend LinesThe RSI with Trend Lines indicator is a tool designed to analyze the behavior of the Relative Strength Index (RSI) combined with dynamic trend lines. This indicator not only provides the standard RSI reading but also identifies pivot points on the RSI and draws bullish and bearish trend lines based on these points. It also includes customizable options for adjusting trend lines, displaying the RSI moving average, and highlighting key levels such as overbought, oversold, and the center line.
This indicator is ideal for finding and identifying clear trends in the RSI and taking advantage of market breakout or consolidation signals. It also includes a table with the POC value, which represents the price level at which the most trading activity has occurred, indicating the highest liquidity and highest trading volume.
Key Features:
1. Basic RSI:
• Calculates the RSI using a configurable period length (default 14).
• Colors the RSI based on its direction (green for rising, red for falling) and its position relative to the center line (50).
2. Key Levels:
• Displays overbought (70 and 80), oversold (20 and 30), and the center line (50) levels for easy visual interpretation.
3. RSI Moving Average:
• Enables and configures an RSI moving average (SMA, EMA, WMA, or ALMA) to smooth out fluctuations and detect clearer trends.
4. Dynamic Trend Lines:
• Identifies pivot points on the RSI and draws bullish and bearish trend lines.
• Trend lines can be extended into the future or limited to the visible range.
• Includes options to display broken lines (trends that are no longer valid) and customize the style (solid or dashed).
5. Pivot Points:
• Displays the high and low pivot points on the chart for a better understanding of trend changes.
6. Advanced Customization:
• Adjust the pivot point period.
• Control the number of pivot points to consider for trend lines.
• Customize the line thickness and style.
How to Use the Indicator:
1. RSI Interpretation:
• Overbought Zone (RSI > 70): Indicates that the asset may be overvalued and could correct downward.
• Oversold Zone (RSI < 30): Suggests that the asset may be undervalued and could rebound.
• Centerline Crossover (50): A cross above 50 indicates bullish strength, while a cross below suggests weakness.
2. Trend Lines:
• Bullish Lines: Drawn when the RSI forms ascending low pivot points. These lines represent dynamic support.
• Bearish Lines: These are drawn when the RSI forms descending high pivot points. These lines represent dynamic resistance.
• Broken Lines: When a trend line becomes invalid (the RSI breaks the line), they are displayed in a dotted style to highlight the breakout.
3. Possible Trading Signals:
• Buy: When the RSI breaks an upward downtrend line.
• Sell: When the RSI breaks a downward uptrend line.
• Trend Confirmation: When the RSI stays within a valid trend line, it suggests that the current trend is strong.
4. A chart with the POC value:
• The point of control is a price level at which the highest trading volume occurs in a given time period. It is a key component of the Volume Profile indicator, which displays volume by price.
• Use of the POC in trading:
• The POC is used to identify areas of high interest and liquidity for trading.
• The POC provides information about the equilibrium point where buyers and sellers are most evenly matched.
• Therefore, it can be considered a zone of interest, meaning it can act as support or resistance.

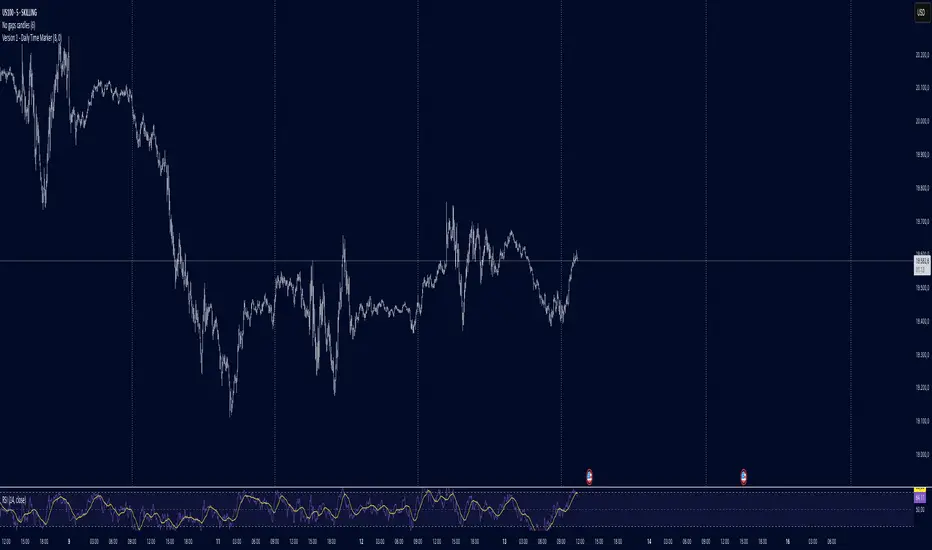
Daily Time MarkerThis TradingView indicator draws thin, white, dashed vertical lines on the chart at a user-defined time each day. The indicator takes into account Daylight Saving Time (DST) adjustments, ensuring the correct time is displayed throughout the year.
Key Features:
✅ Daily Vertical Markers:
Displays vertical dashed lines from Monday to Friday at the selected time.
The lines extend infinitely in both directions.
✅ Historical & Future Projection:
Shows lines 15 days into the past and 5 days into the future for better visualization of key time levels.
✅ DST Adjustment:
Automatically adjusts between summer and winter time , ensuring the correct hour is displayed.
This indicator is useful for traders who rely on specific time-based events, such as market opens or key trading sessions.
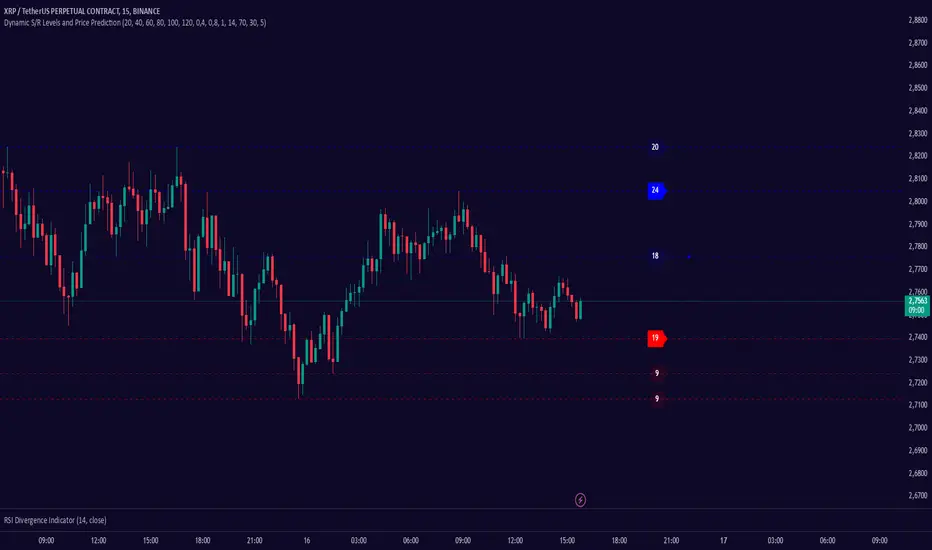
Dynamic S/R Levels: Edge FinderOverview
The Dynamic S/R Levels: Edge Finder indicator is designed to identify dynamic support and resistance levels based on historical price action. It uses a combination of price extremes (highs and lows) over user-defined lookback periods, weighted moving averages (WMAs), and touch-count analysis to provide actionable insights into key market levels.
This tool is ideal for traders who want to:
Identify dynamic support and resistance zones.
Understand the strength of these levels based on price touches.
Make informed decisions using clear, adaptive levels.
How It Works
Dynamic Levels Calculation:
The indicator calculates dynamic support levels using the lowest lows and dynamic resistance levels using the highest highs over user-defined lookback periods (e.g., 20, 40, 60 bars, etc.).
These levels are updated dynamically as new price data becomes available.
Touch Count Analysis:
The indicator counts how many times the price has touched or come close to each support/resistance level within the lookback period.
Levels with more touches are considered stronger and are highlighted accordingly.
Weighted Moving Averages (WMAs):
The indicator uses 50-period and 100-period WMAs to identify the closest support/resistance levels to the current trend.
Levels near these WMAs are given additional weight, as they are more likely to act as significant barriers.
Level Merging:
If two support or resistance levels are too close to each other (based on the minimum distance percentage), the weaker level (with fewer touches) is removed to avoid clutter.
Visualization:
Support levels are displayed as dashed red lines, and resistance levels are displayed as dashed blue lines.
Each level is labeled with its corresponding touch count, allowing traders to quickly assess its strength.
How to Interpret the Indicator
Strong Support/Resistance Levels:
Levels with higher touch counts (e.g., 5, 10, or more) are considered stronger and are more likely to hold in the future.
Use these levels to plan entries, exits, or stop-loss placements.
Proximity to WMAs:
Levels closest to the 50-period or 100-period WMA are more significant, especially in trending markets.
These levels often act as dynamic barriers where price reactions are more likely.
Breakouts and Rejections:
If the price breaks through a strong resistance level, it may indicate a potential bullish trend.
If the price rejects a strong support level, it may indicate a potential bearish trend.
Always confirm breakouts or rejections with additional analysis (e.g., volume, candlestick patterns).
Level Merging:
Merged levels indicate areas of high confluence, where multiple support/resistance zones overlap.
These areas are particularly important for decision-making, as they represent stronger market reactions.
Key Features
Customizable Lookback Periods: Adjust the lookback periods for each dynamic level to suit your trading style.
Touch Count Labels: Quickly identify the strength of each level based on the number of price touches.
Adaptive Levels: The indicator dynamically updates levels based on recent price action.
Clean Visualization: Levels are automatically merged to avoid clutter and provide a clear view of the market structure.
Usage Tips
Trend Identification: Combine the indicator with trend-following tools (e.g., moving averages, trendlines) to confirm the overall market direction.
Risk Management: Use the identified levels to set stop-loss orders or take-profit targets.
Timeframe Flexibility: The indicator works on all timeframes, but it is particularly effective on higher timeframes (e.g., 1H, 4H, Daily) for more reliable levels.
Example Scenarios
Bounce Trade:
If the price approaches a strong support level (high touch count) and shows signs of rejection (e.g., bullish candlestick patterns), consider a long position with a stop-loss below the support level.
Breakout Trade:
If the price breaks above a strong resistance level with high volume, consider a long position with a target at the next resistance level.
Range-Bound Market:
In a sideways market, use the support and resistance levels to identify range boundaries and trade bounces between them.
Disclaimer
Dynamic S/R Levels: Edge Finder is a technical analysis tool designed to identify dynamic support and resistance levels based on historical price action. It is intended for informational and educational purposes only. This indicator does not provide financial, investment, or trading advice. Users are solely responsible for their trading decisions and should conduct their own research and analysis before making any trades. The developer of this tool is not liable for any financial losses or damages resulting from the use of this indicator. Trading in financial markets involves risk, and you should only trade with capital you can afford to lose.
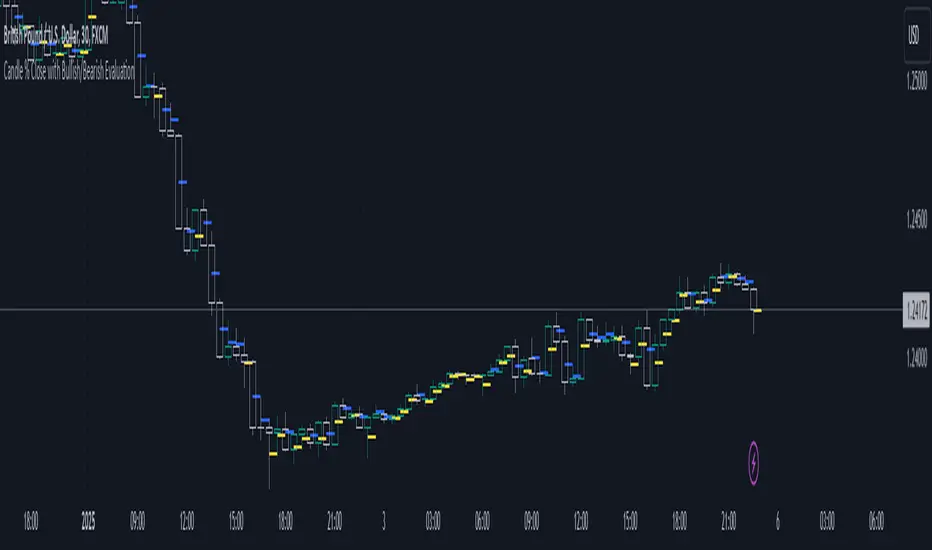
Candle % Close with Bullish/Bearish EvaluationI created the indicator to more quickly define the polarity of candles. For a large number of candles, it is straightforward to determine whether a candle is bullish or bearish. However, candles with long wicks often appear, making it uncertain whether the candle is bullish or bearish from a price action perspective. It is not a rule that a red candle is bearish and a green candle is bullish.
From a more advanced price action standpoint, how these candles close is important. Therefore, I created the 'Percent range' input. By default, it is set to 50% (high-low)/2. This way, the indicator precisely determines 50% of the candle's entire range. This allows us to determine whether a bearish candle truly closed below 50% of its range. If not, such a candle is considered bullish, even if it is a negative candle. The same applies to bullish candles, but conversely. If a positive candle closes below 50% of its range, from a price action perspective, it is considered a bearish candle.
Since in price action it is common for the price to return to 50% of the previous candle and, after filling, to continue in the established trend, I added the line extension option. Whatever high value you enter, the line extension follows the current candle. This option works only when the stop line checkbox is enabled. This way, you can plot 50% of the candle's range that the market has historically not returned to due to a strong trend. Often, this line is plotted on a candle where there is also an FVG, which can help you more easily find a point of interest.
Stop line extension : Ensures the interruption of line plotting when the candle is touched by the body or wick.
BK MA Horizontal Lines
Indicator Description:
I am incredibly proud and excited to share my first indicator with the TradingView community! This tool has been instrumental in helping me optimize my positioning and maximize my trades.
Moving Averages (MAs) are among the top three most crucial indicators for trading, and I believe that the Daily, Weekly, and Monthly MAs are especially critical. The way I’ve designed this indicator allows you to combine MAs from your Daily timeframe with one or two from the Weekly or Monthly timeframes, depending on what is most relevant for the specific product or timeframe you’re analyzing.
For optimal use, I recommend:
Spacing your chart about 11 spaces from the right side.
Setting the Labels at 10 in the indicator configuration.
Keeping the line thickness at size 1, while using size 2 for my other indicator, "BK BB Horizontal Lines", which follows a similar concept but applies to Bollinger Bands.
If you find success with this indicator, I kindly ask that you give back in some way through acts of philanthropy, helping others in the best way you see fit.
Good luck to everyone, and always remember: God gives us everything. May all the glory go to the Almighty!

Time Vertical LinesVLines - Time-Based Vertical Lines with Zones
This PineScript indicator creates vertical time lines with customizable zones between them. Perfect for marking trading sessions, key market times, or any time-based analysis.
Key Features:
- 5 configurable time lines
- 3 customizable zones (between lines 1-2, 2-3, and 4-5)
- Each zone features:
- Background shading
- Horizontal lines at high/low points
- Independent color controls
- Adjustable line styles and widths
- Time zone offset adjustment
- Option to show/hide historical lines
Installation Instructions:
1. Open TradingView's Pine Script Editor
2. Create a new script
3. Copy and paste the entire code
4. Add to Chart
Setup Guide:
1. Time Zone Adjustment:
- Find the "Time Zone Offset (Hours)" setting
- Adjust if lines appear at wrong times
- Example: If lines appear 3 hours early, set offset to 3
2. Basic Time Lines (1-3):
- Each line has settings for:
- Hour (0-23)
- Minute (0-59)
- Color
- Show/Hide toggle
3. Session Lines (4-5):
- Special lines typically used for session marking
- Same settings as basic lines
- Default red color to distinguish from other lines
4. Zone Customization:
Three separate zones are available:
- Zone 1-2 (between first and second lines)
- Zone 2-3 (between second and third lines)
- Zone 4-5 (between fourth and fifth lines)
Each zone can be customized with:
- Background color and transparency
- Horizontal line color
- Line style (Solid/Dashed/Dotted)
- Line width
- Individual show/hide toggles for zone and lines
5. Additional Settings:
- "Show Historical Lines" - toggle to show/hide lines on previous days
- Global line style and width settings for vertical lines
Suggested Uses:
1. Mark pre-market, market, and post-market sessions
2. Highlight specific trading windows
3. Track time-based support/resistance levels
4. Monitor price ranges during specific time periods
Tips:
- Start by setting just one zone to get familiar with the controls
- Use different colors for different sessions/time periods
- Adjust transparency to maintain chart visibility
- Use the show/hide toggles to focus on specific times
- The horizontal lines automatically mark the high/low range between time points

Time-input Lines [MFX]THE LINES
The indicator plots a horizontal price line at a specified hour and minute (default: 9:30 - Equities Open). This line extends for a predefined number of minutes (default: 60 minutes - Opening Range Full Spectrum). Additionally, the indicator can plot two vertical lines: one at the selected start time and another at the end of the horizontal line.
STYLE
Both the horizontal and vertical lines are fully customizable, allowing adjustments to color, style, and width. For a cleaner, minimalist chart, any of these lines can be disabled.
TIMEZONE
By default, the indicator operates in the New York time zone, but this can be modified by unchecking the option and specifying a custom offset relative to UTC/GMT. The default offset is +2, corresponding to CEST (Central European Summer Time, UTC/GMT+2). The offset can be adjusted with up to 15-minute precision, where 0.25 represents a quarter of an hour.

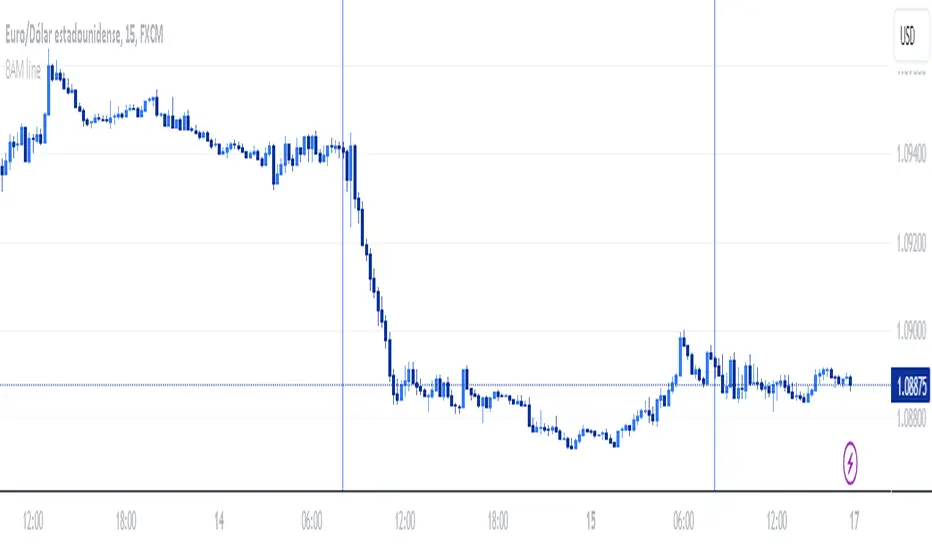
Vertical line at 8 AMThis indicator plots a blue vertical line on the chart when it's 8 AM, providing a clear visual reference of this time point on the TradingView chart.
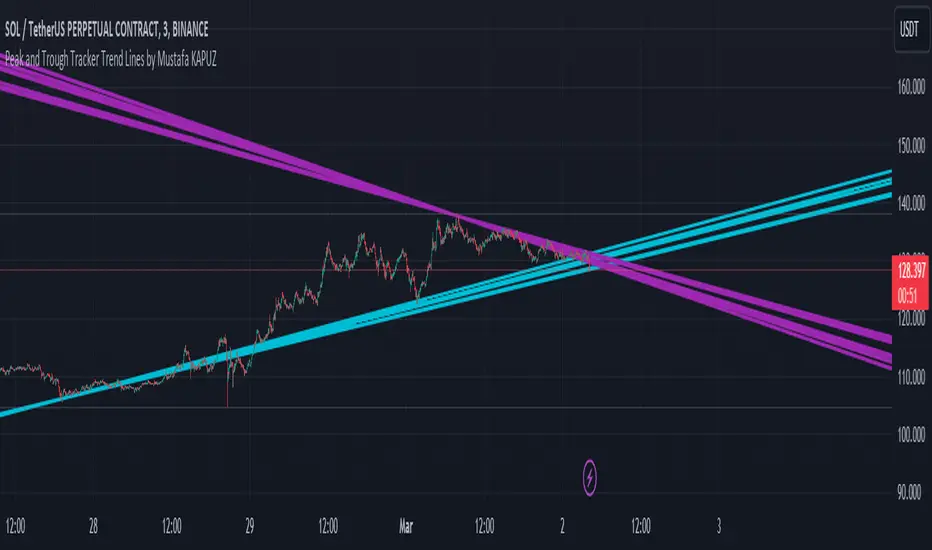
Peak and Trough Tracker by Mustafa KAPUZPeak and Trough Tracker
This indicator identifies the highest and lowest prices reached in two user-defined time periods. It then draws two lines connecting these peak and trough points. The purple line represents the connection between the highest prices, while the aqua line represents the relationship between the lowest prices. Both lines extend into the future and past, providing insights into potential support and resistance levels.
How to Use:
Add the indicator to your chart.
Enter two time periods.
Analyze the lines connecting peak and trough points.
This tool helps visually understand the market's key turning points and adjust your investment strategy based on these insights.
Zirve ve Dip Noktaları İzleyici
Bu indikatör, kullanıcı tarafından belirlenen iki zaman periyodunda piyasanın ulaştığı en yüksek ve en düşük fiyatları tespit eder. Ardından, bu zirve ve dip noktalarını birleştiren iki çizgi çizer. Mor çizgi, en yüksek fiyatlar arasındaki bağlantıyı gösterirken; aqua çizgi, en düşük fiyatlar arasındaki ilişkiyi temsil eder. Her iki çizgi de geleceğe ve geçmişe doğru uzanarak, potansiyel destek ve direnç seviyeleri hakkında fikir verir.
Kullanımı:
İndikatörü grafik üzerine ekleyin.
İki zaman periyodu girin.
Zirve ve dip noktalarını birleştiren çizgilerin analizini yapın.
Bu araç, piyasanın önemli dönüm noktalarını görsel olarak anlamanıza ve yatırım stratejinizi bu bilgilere göre ayarlamanıza yardımcı olur.
ZigZag Multi [TradingFinder] Trend & Wave Lines - Structures🔵 Introduction
"Zigzag" is an indicator that forms based on price changes. Essentially, the function of this indicator is to connect consecutive and alternating High and Low pivots. This pattern assists in analyzing price changes and can also be used to identify classic patterns. "Zigzag" is an analytical tool that, by filtering partial price movements based on the specified period, can identify price waves across different time frames (short or long term).
🔵 Reason for Creation
The combination of "short term zigzag" and "long term zigzag" enhances accuracy and reduces analysis time. In a time frame, "long term zigzag" represents the main trend, while "short term zigzag" depicts short-term waves.
🔵 How to Use
After selecting the desired time frame and adding "zigzag" to the chart, begin utilization. Keep in mind to identify the main market trend from "long term zigzag" and the minor waves from "short term zigzag".
🟣 Important: Additionally, classic patterns such as HH, LH, LL, and HL can be recognized. All traders analyzing financial markets using classic patterns and Elliot Waves can benefit from the "zigzag" indicator to facilitate their analysis.
🔵 Settings
Short term zigzag : In this section, you can adjust settings such as time frame range, display mode, color, and line width of the zigzag lines.
Short term label : This section allows you to activate or deactivate the display of zigzag labels according to your needs. You can also customize their color and size.
Long term zigzag : Here, you can adjust settings for time frame range, display mode, color, and line width of zigzag lines.
Long term label : Similar to short term label settings.
The recommended time frame for "long term zigzag" is between 9 to 15, and for "short term zigzag" is between 3 to 5.
🟣 Important Notes :
Considering the different behaviors of financial markets and various time frames, it is recommended to experiment with different time frame settings when using "zigzag" to find the best settings for each symbol and time frame, thereby preventing potential errors.
🟣 Terminology Explanations :
"HH": When the price is higher than the previous peak (Higher High).
"HL": When the price is higher than the previous low (Higher Low).
"LH": When the price is lower than the previous peak (Lower High).
"LL": When the price is lower than the previous low (Lower Low).

Polyline PlusThis library introduces the `PolylinePlus` type, which is an enhanced version of the built-in PineScript `polyline`. It enables two features that are absent from the built-in type:
1. Developers can now efficiently add or remove points from the polyline. In contrast, the built-in `polyline` type is immutable, requiring developers to create a new instance of the polyline to make changes, which is cumbersome and incurs a significant performance penalty.
2. Each `PolylinePlus` instance can theoretically hold up to ~1M points, surpassing the built-in `polyline` type's limit of 10K points, as long as it does not exceed the memory limit of the PineScript runtime.
Internally, each `PolylinePlus` instance utilizes an array of `line`s and an array of `polyline`s. The `line`s array serves as a buffer to store lines formed by recently added points. When the buffer reaches its capacity, it flushes the contents and converts the lines into polylines. These polylines are expected to undergo fewer updates. This approach is similiar to the concept of "Buffered I/O" in file and network systems. By connecting the underlying lines and polylines, this library achieves an enhanced polyline that is dynamic, efficient, and capable of surpassing the maximum number of points imposed by the built-in polyline.
🔵 API
Step 1: Import this library
import algotraderdev/polylineplus/1 as pp
// remember to check the latest version of this library and replace the 1 above.
Step 2: Initialize the `PolylinePlus` type.
var p = pp.PolylinePlus.new()
There are a few optional params that developers can specify in the constructor to modify the behavior and appearance of the polyline instance.
var p = pp.PolylinePlus.new(
// If true, the drawing will also connect the first point to the last point, resulting in a closed polyline.
closed = false,
// Determines the field of the chart.point objects that the polyline will use for its x coordinates. Either xloc.bar_index (default), or xloc.bar_time.
xloc = xloc.bar_index,
// Color of the polyline. Default is blue.
line_color = color.blue,
// Style of the polyline. Default is line.style_solid.
line_style = line.style_solid,
// Width of the polyline. Default is 1.
line_width = 1,
// The maximum number of points that each built-in `polyline` instance can contain.
// NOTE: this is not to be confused with the maximum of points that each `PolylinePlus` instance can contain.
max_points_per_builtin_polyline = 10000,
// The number of lines to keep in the buffer. If more points are to be added while the buffer is full, then all the lines in the buffer will be flushed into the poylines.
// The higher the number, the less frequent we'll need to // flush the buffer, and thus lead to better performance.
// NOTE: the maximum total number of lines per chart allowed by PineScript is 500. But given there might be other places where the indicator or strategy are drawing lines outside this polyline context, the default value is 50 to be safe.
lines_bffer_size = 50)
Step 3: Push / Pop Points
// Push a single point
p.push_point(chart.point.now())
// Push multiple points
chart.point points = array.from(p1, p2, p3) // Where p1, p2, p3 are all chart.point type.
p.push_points(points)
// Pop point
p.pop_point()
// Resets all the points in the polyline.
p.set_points(points)
// Deletes the polyline.
p.delete()
🔵 Benchmark
Below is a simple benchmark comparing the performance between `PolylinePlus` and the native `polyline` type for incrementally adding 10K points to a polyline.
import algotraderdev/polylineplus/2 as pp
var t1 = 0
var t2 = 0
if bar_index < 10000
int start = timenow
var p = pp.PolylinePlus.new(xloc = xloc.bar_time, closed = true)
p.push_point(chart.point.now())
t1 += timenow - start
start := timenow
var polyline pl = na
var points = array.new()
points.push(chart.point.now())
if not na(pl)
pl.delete()
pl := polyline.new(points)
t2 += timenow - start
if barstate.islast
log.info('{0} {1}', t1, t2)
For this benchmark, `PolylinePlus` took ~300ms, whereas the native `polyline` type took ~6000ms.
We can also fine-tune the parameters for `PolylinePlus` to have a larger buffer size for `line`s and a smaller buffer for `polyline`s.
var p = pp.PolylinePlus.new(xloc = xloc.bar_time, closed = true, lines_buffer_size = 500, max_points_per_builtin_polyline = 1000)
With the above optimization, it only took `PolylinePlus` ~80ms to process the same 10K points, which is ~75x the performance compared to the native `polyline`.

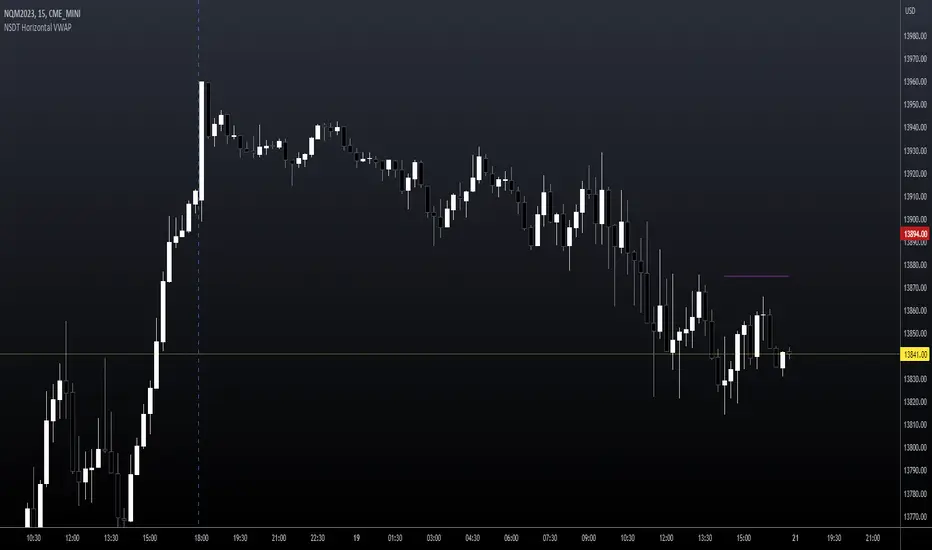
NSDT Horizontal VWAPThis script plots VWAP as a horizontal line starting at the most recent candle and extending backwards for a period of 10 to make it easier to see. (default is 10 but can be changed to fit your needs)
You may only want to see where VWAP is currently and not need to see the entire day. Helps keep the chart clean.
Colors and line settings can all be modified.
You can show the original VWAP plot as well for reference.
What Is the Volume-Weighted Average Price (VWAP)?
The volume-weighted average price (VWAP) is a technical analysis indicator used on intraday charts that resets at the start of every new trading session.
It's a trading benchmark that represents the average price a security has traded at throughout the day, based on both volume and price.
VWAP is important because it provides traders with pricing insight into both the trend and value of a security.
Drawings_publicLibrary "Drawings_public"
: Functions to manage drawings on the chart
extend_line(lineId, labelId)
: Extend specific line with its label
Parameters:
lineId
labelId
update_line_coordinates(lineId, labelId, x1, y1, x2, y2)
: Update specific line coordinates with its label
Parameters:
lineId
labelId
x1
y1
x2
y2
update_label_coordinates(labelId, value)
: Update coordinates of a label
Parameters:
labelId
value
delete_line(lineId, labelId)
: Delete specific line with its label
Parameters:
lineId
labelId
update_box_coordinates(boxId, labelId, left, top, right, bottom)
: Update specific box coordinates with its label
Parameters:
boxId
labelId
left
top
right
bottom
delete_box(boxId, labelId)
: Delete specific box with its label
Parameters:
boxId
labelId

Forex Strength IndicatorThis indicator will display the strength of 8 currencies, EUR, AUD, NZD, JPY, USD, GBP, CHF, and CAD. Each line will represent each currency. Alongside that, Fibonacci levels will be plotted based on a standard deviation from linear regression, with customizable lengths.
For more steady Fibonacci levels, use higher lengths for both Standard Deviations and Linear Regression. All currency lines come from moving averages with options like EMA, SMA, WMA, RMA, HMA, SWMA, and Linear Regression.
When lines of the active pair are far from each other, it means higher divergence in those currency strengths among the other pairs. The closer the lines are, the lower the divergence.
You can use the Fibonacci levels as points for the reversal or end of the current trend. When the lines cross can be used as a parameter for a more accurate signal of the next movement.
All 28 pairs are loaded from the same time frame and will use the same moving average for all of them
Alerts from the line crossing are available.

OHLC ToolOHLC Tool allows you to display Current or Historical OHLC Values as horizontal lines that extend to the right on your chart.
Features
Variable Lookback to display a specific historical bar's values. Default = 1 (Previous Candle)
Customizable Timeframe to view HTF Candle values.
Custom Line Colors, Styles, and Thicknesses.
Price Scale Value Display Capability.
For displaying the line values and labels on the price scale you will need to enable:
"Indicator and financials name labels"
and
"Indicator and financials value labels"
These options are found in the Price Scale Menu under Labels. Price Scale Menu > Labels
When you do this you will notice your other indicator values will also be on the price scale,
if you wish to disable these, go to the indicator settings under the "Style" Tab, Uncheck the "Labels on price scale" box.
Indicator Settings > Style > "Labels on price scale"
Enjoy!

[Mad] Active LineThis is a simple line tool that can give you active feedback based on the closing price.
It is intended for a live chart whose ticker is not changed by the user every 10 minutes, like a general overview of an asset in a higher time frame.
What can it provide:
Price difference from the price to the line
Price at the current collision point
How to use it:
When opened, it requests 2 input points from you.
After you set these 2 points, it will set the "Active Line" for you, like the normal TV line.
One thing to know is that you can't place into the future, so "extend" is always on by default.
and as always, have fun trading the assets up and down :-)

Wicked Good S&R Zones// Hello tradeurs, ChasinAlts here with a script you've DEFINITELY never seen before. Hope everyone is well. Ok, so heres the low-down...When a wick's
// % size is above the threshold set by the user it is plotted with light blue (these aren't really the significant ones) and are put into an array.
// These large wick lines are great S&R lines but we're looking to filter out to only the best ones. So, after all the large wicks are recorded for the
// chart and lines drawn, it then calculates the area between each of these lines in % (you can think of the lines as the upper and lower lines to a box
// if you'd like...ie. it is one of the ways to view the final BEST S&R lines). What we are want is the largest of ALL the % areas between lines and to
// use these as our ultimate S&R Areas. Depending on the Min % Wick size that is chosen, you will find price usually either bouncing between these levels or
// that price will keep bouncing off of the same level until a large spike (up or down) occurs in price and the price will finally breach the level its been
// testing over and over. Once this DOES occur the level that was just broken many times will be the furthest point back for the retest. Now, as stated
// before there are 2 ways to view the output data. Either way it will show the largest % area between the lines as it is developing down the line of
// progressing bars on the chart (that means it WILL change but usually a portion of the previous area/box will be used for the newer smaller box or that
// the area/box will jump back and forth between the same few areas every now and again). Viewing it as a box will show the updated largest box
// (as stated twice now) but viewing it in it's S&R Line form will draw a new S&R line at the top and bottom of where the box would be if it was selected
// EXCEPT that these lines will persist across bars and you will continuously see how these levels will continue to be revisited and constantly used
// as S&R Lines as time progresses. (SO box only show the largest area and lines draws line at the top and bottom of box and persists across bars).
// There is not repainting that can occur. I hope you all enjoy this as I've found it EXTREMELY beneficial bc it's rare that when price first gets to a
// printed S&R level that it will shoot through it so you can depend on it bouncing off the the levels often multiple times. I've included comments in all
// of the code for your convenience. Also, the higher subscription plan you have (thus the more bars/data you have access to...the more S&R Lines will be drawn).
// Wish you all the best in your endeavors and may the force be with your trades, and as ALWAYS...Peace and Love people....Peace and Love. -ChasinAlts out.

Support & Resistance Trendlines with PP + Fib. Channel█ Support & Resistance Trendlines with Pivot Points + Fibonacci Channel
This script automatically draw support and resistance trend lines based on pivot points and add a fibonacci channel.
It will show potential patterns with the help of support and resistance lines as well as breakout target and pullback entry with the fibonacci extension and retracement levels.
It is based on atolelole's script, I only made it more configurable so please check out his script.
I added the possibility to change values and add additional retracement and extension levels.
I also made it customizable with the possibility to change lines color, width and style.

AlgebraLibrary "Algebra"
Algebra functions.
line_fromXy(x1, y1, x2, y2)
Get line slope and y-intercept from coordinates
Parameters:
x1 : x coordinate 1 (int - bar index)
y1 : y coordinate 1 (float - price/value)
x2 : x coordinate 2 (int - bar index)
y2 : y coordinate 2 (float - price/value)
Returns: of line
line_getPrice(x, slope, yInt)
Get line slope and y-intercept from coordinates
Parameters:
x : x coordinate to solve for y (int - bar index)
slope : slope of line (float)
yInt : y-intercept of line (float)
Returns: y (price/value)

Yearly Monthly Vertical Lines [MsF]This indicator that draws vertical lines for each year and month starting from the specified date and time.
For example, starting from August 26th, 2022,
The annual vertical lines are Aug 26th, 2022, Aug 26th, 2021, Aug 26th, 2020, Aug 26th, 2019, Aug 26th, 2018, Aug 26th, 2017...
It is useful to check the action of the chart at the event of each year and month.
Caution:
Since there is a limit to the Bar-Count that can be specified in the script language, depending on the chart period setting It may not be displayed.
-------------------------
指定した日時を起点として、年、月ごとに垂直線(縦線)を描画するインジケータです。
例えば、2022/9/1を起点とした場合、
年次のラインは、2021/9/1、2020/9/1、2019/9/1、2018/9/1、2017/9/1、2016/9/1...
に描画します。
年、月ごとのイベント時のチャートの動きを確認するのに便利です。
※過去イベント時の価格変動確認の際、手作業で垂直線を引くのが面倒なため、作成しました。
<注意>
スクリプト言語で指定できるBarCntに制限がある為、チャートの期間設定によっては
表示されない場合があります。※今後改善の余地あり
