Multi-Length Stochastic Average [LuxAlgo]This indicator returns the average of stochastic oscillators with periods ranging from 4 to length . This allows for a slightly more reactive oscillator as well as having information regarding the position of the price relative to rolling maximums/minimums of different periods.
We introduce settings that allow for pre and post-smoothing, with selectable smoothing methods and periods for both steps.
Settings
Length: Period of the indicator, determine the maximum period of the stochastic oscillator used in the average
Source: Source input of the indicator
Pre-Smoothing (1st Input): Degree of smoothing applied to the source input
Pre-Smoothing (2nd Input): Pre-Smoothing Method
Post-Smoothing (1st Input): Degree of smoothing applied to the final oscillator output
Post-Smoothing (2nd Input): Post-Smoothing Method
Smoothing methods include a simple moving average, a triangular moving average, and a least-squares moving average (this method can induce overshoots during the post-smoothing step). The user can also select "None".
Usages
The "multi-length" aspect of technical indicators is something that hasn't been deeply explored yet such indicators can give us information regarding both short-term and long-term information which was the motivation for the creation of the indicator.
The Multi-length Stochastic Average allows us to quantify the price position relative to a multitude of highest/lowest levels.
In the example above the oscillator returns the average of stochastic oscillators with periods ranging from 4 to 20, as well as multiple rolling minimums with periods ranging from 4 to 20. We can see that when the price is equal to all rolling minimums the oscillator is equal to 0, the oscillator would return 100 if the price were equal to all rolling maximums with periods in that same range.
The oscillator can be interpreted like any scaled oscillator and can be used to estimate trend direction as well as trend strength.
Here we only make of use pre-smoothing by using a period 20 simple moving average. The indicator graphical elements such as colors/circles can help us determine potential directions trends might take.
Circles are displayed when the oscillator crosses over/under the 20/80 level. Such conditions offer better timing than waiting for the oscillator to be greater/lower than 50 and are less subjective to noise than simply looking at the direction taken by the oscillator. However, it can suffer from potential retracements in a trend more easily, this is illustrated in the chart above.
最小二乘移動平均線(LSMA)

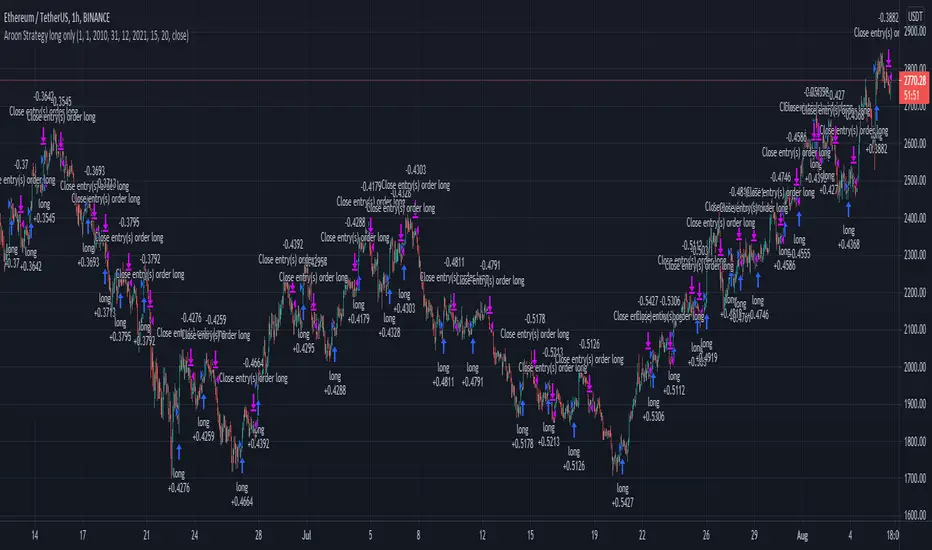
Aroon Strategy long onlyThis is a simple long only strategy made of Aroon and Least Square moving average.
The rules are simple:
Long entry = crossover of upper part with the lower part from aroon and close of the candle is above the moving average
Long exit = crossunder of upper part with the lower part from aroon and close of the candle is below the moving average
IF you have any questions let me know !
Volume, Momentum and Volatility weighted moving averageMoving averages are filters on price data. This moving average creates a filter which factors in:
- the price RSI or it's Momentum
- the volume RSI
- the RVI or Volatility
Each factor is put through a least squares filter to smooth them first.
Then the factors are used to build a coefficient for an exponentially weighted average.
The chart above shows a comparison of standard average types with this script.
This is useful if you are looking for a moving average based trigger and do not wish to react to candle noise price action.

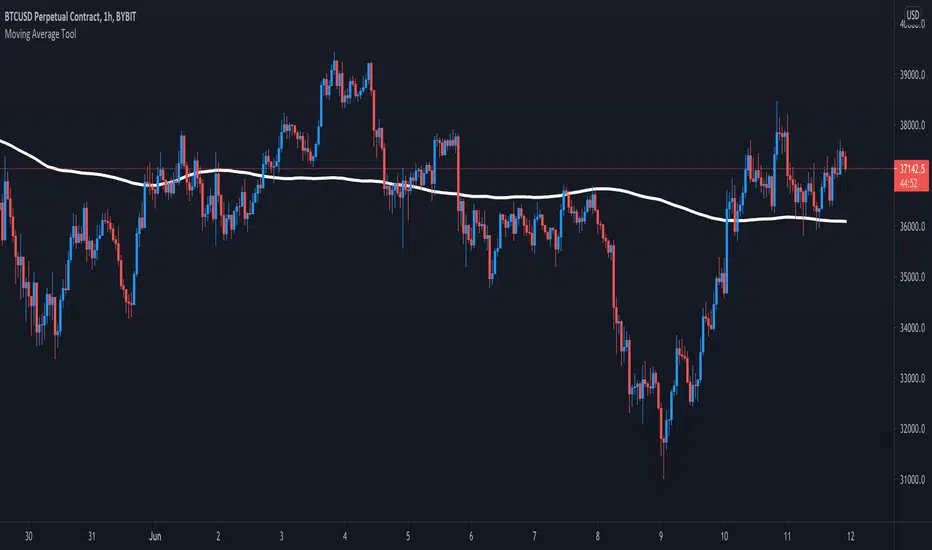
Moving Average ToolThe Moving Average Tool is the only indicator you will ever need to plot MA lines. It comes loaded with 9 different types of moving averages so traders can lay down any line at any length. There is also an option to plot a trigger line. Features: SMA , SMMA, EMA, LSMA, ZLSMA, HULL, LWMA, VWMA and ALMA. Simply pick an average type and enter the desired length.
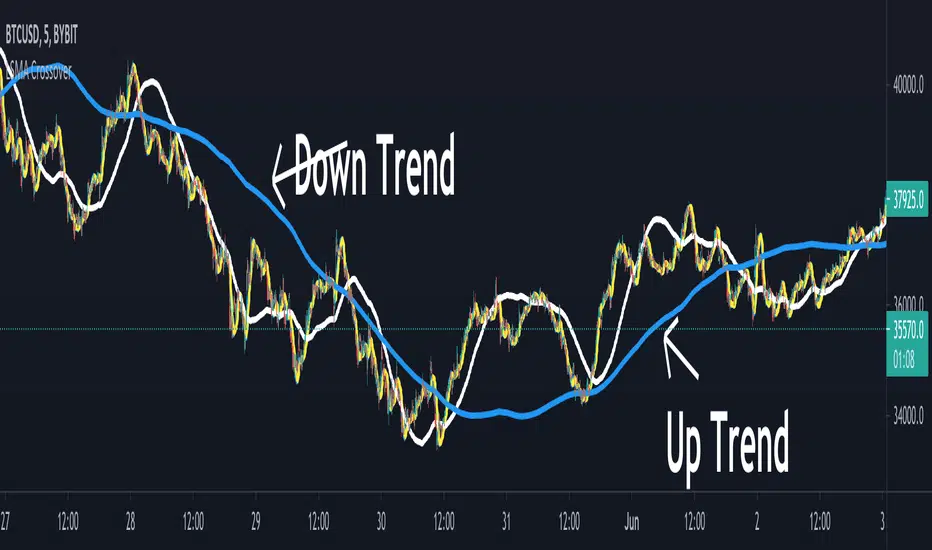
LSMA CrossoverThis is a simple script designed to help filter out bad trades. LSMA is a trend king and by using the 21,200 and 1000 length lines traders can get a clear view of where price action is travelling. This indicator is the perfect companion to the LSMA Wave Rider indicator. Once a pullback is discovered (price action crosses under blue or white line) Traders can use LSMA Wave Rider to locate perfect entry point.
Least Squares Moving Average follows these rules:
When price crosses over it signals a bull trend.
When price crosses under it signals bear trend.
When price stays close or on the line sideways action is to be expected.
The direction of the line shows the direction of the trend.
Here is an example of finding good trades. Price action pulls below white or blue line.
Another example of what a pullback looks like.
This example shows how to find trend using crossovers.
Another example how trend can be found but by using line direction.
LSMA Wave Rider can be found here:
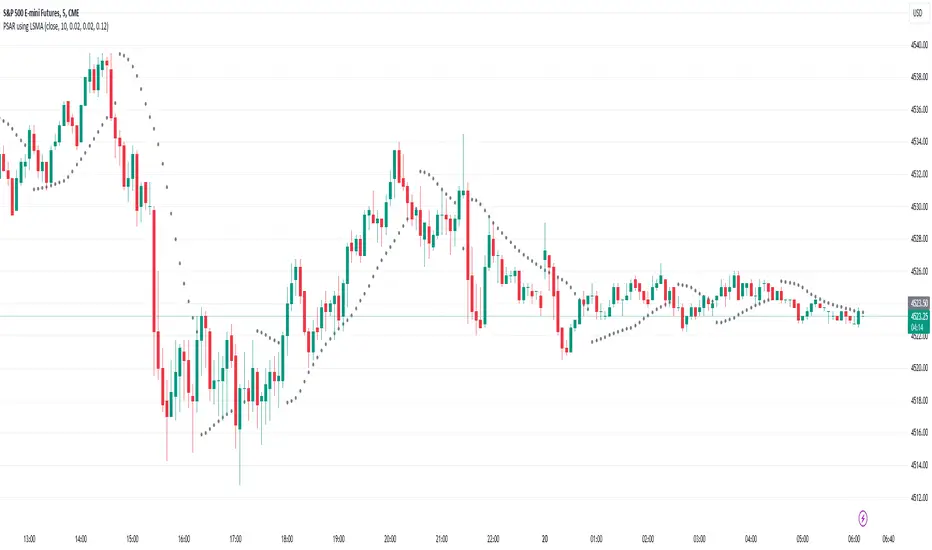
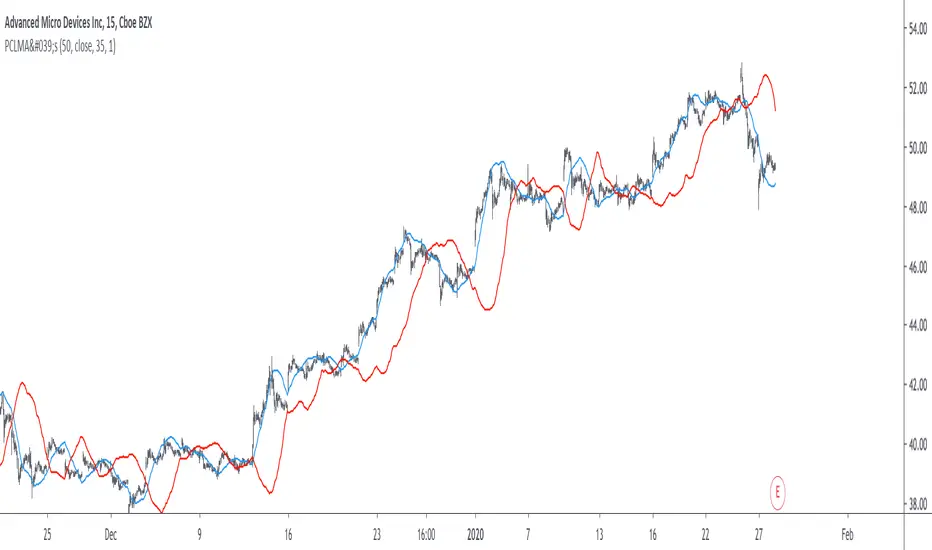
PSAR using Moving Linear Regression (LSMA)Works exactly as the standard PSAR with the only difference that a Moving Linear Regression Line (=Least Squares Moving Average, LSMA) is used as input.
So the PSAR flip is triggered not by price itself but by the LSMA line.
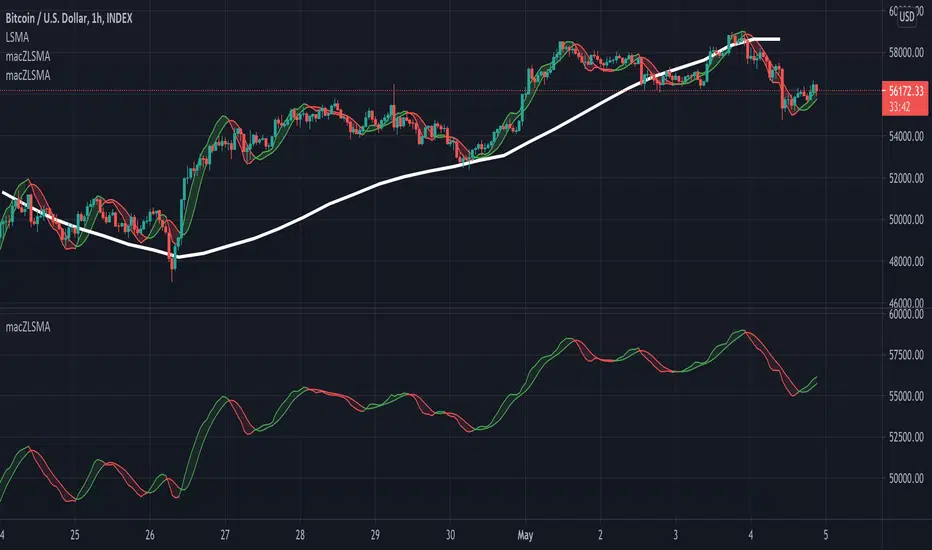
macZLSMA - Overlay**Overlay Version** Macd that shows instantaneous trend using ZLSMA. This crossover has the ability to reveal trend directions before it happens. With multi time frame option.
Above image shows 1 hour timeframe using 12hour setting on indicator
Example with 1 hour timeframe:
Example with 1 hour timeframe using daily setting on indicator:
Non overlay version available here:
macZLSMAMacd that shows instantaneous trend using ZLSMA. This crossover has the ability to reveal trend directions before it happens.

ZLSMA - Zero Lag LSMAAn almost zero lag version of the LSMA (Least Squares Moving Average)
Gives instant linear regression of current price action.
This line works with the same rules as its "laggy" counterpart the LSMA:
When price crosses over it signals a bull trend.
When price crosses under it signals bear trend.
When price stays close or on the line sideways action is to be expected.
The direction of the line shows the direction of the trend.

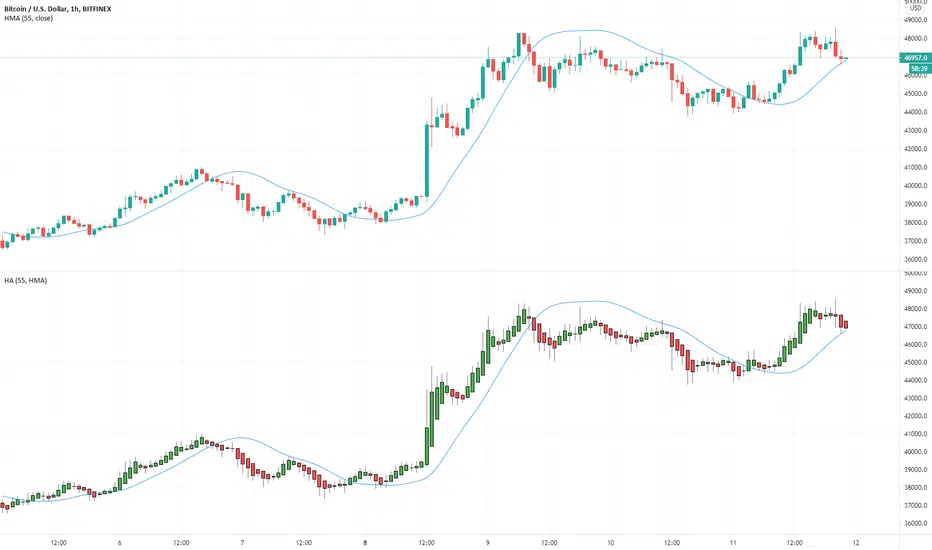
Multiple Moving Averages for Heikin Ashi I want to give credits to @QuantNomad, i got the heikin ashi part of the script from this open script /0iKy7lyG-QuantNomad-Heikin-Ashi-PSAR-Strategy/;
and to the other guy that provided a 17 type of moving average script open source but i forgot his name, if someone remember please tell me.
My idea was to see how the different types of moving averages behaves in a Heinkin Ashi chart, you can change to more than 15 types of Moving Average and use it the way you want it.
For the source of the moving averages i used a simple moving average of 1 period using the high of the heikin ashi candle, low of it and divided by 2 as the source of the different types of moving averages.
Different types of Moving Averages
Moving Average Types
SMA ---> Simple
WMA ---> Weighted
VWMA ---> Volume Weighted
EMA ---> Exponential
DEMA ---> Double EMA
ALMA ---> Arnaud Legoux
HMA ---> Hull MA
SMMA ---> Smoothed
LSMA ---> Least Squares
KAMA ---> Kaufman Adaptive
TEMA ---> Triple EMA
ZLEMA ---> Zero Lag
FRAMA ---> Fractal Adaptive
VIDYA ---> Variable Index Dynamic Average
JMA ---> Jurik Moving Average
T3 ---> Tillson
TRIMA ---> Triangular
The type of moving average you select will appear in a separated chart with Heikin Ashi candles, like in the image above.
Multi Timeframe Moving Average [xdecow]This indicator plots a moving average of 4 different timeframes.
The types of averages available are: SMA, EMA, DEMA, VWMA, RMA, WMA.

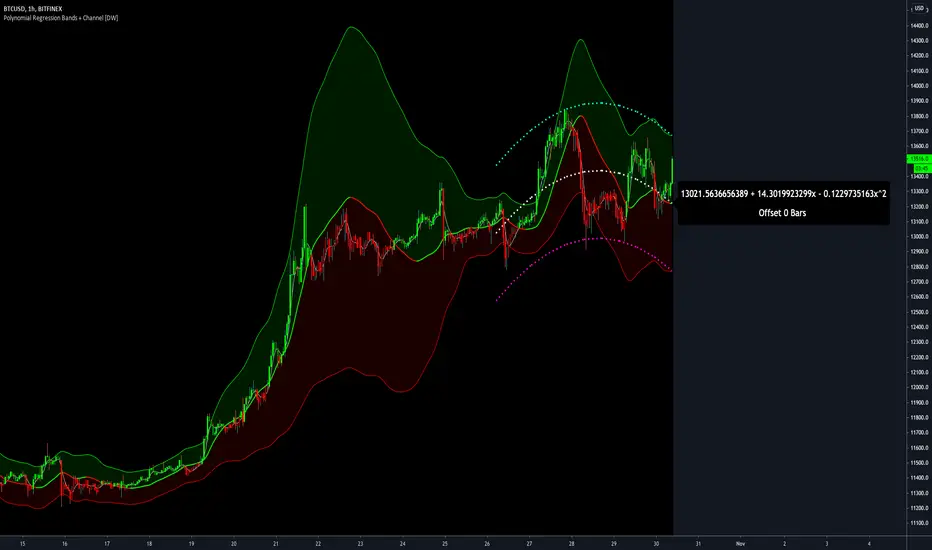
Polynomial Regression Bands + Channel [DW]This is an experimental study designed to calculate polynomial regression for any order polynomial that TV is able to support.
This study aims to educate users on polynomial curve fitting, and the derivation process of Least Squares Moving Averages (LSMAs).
I also designed this study with the intent of showcasing some of the capabilities and potential applications of TV's fantastic new array functions.
Polynomial regression is a form of regression analysis in which the relationship between the independent variable x and the dependent variable y is modeled as a polynomial of nth degree (order).
For clarification, linear regression can also be described as a first order polynomial regression. The process of deriving linear, quadratic, cubic, and higher order polynomial relationships is all the same.
In addition, although deriving a polynomial regression equation results in a nonlinear output, the process of solving for polynomials by least squares is actually a special case of multiple linear regression.
So, just like in multiple linear regression, polynomial regression can be solved in essentially the same way through a system of linear equations.
In this study, you are first given the option to smooth the input data using the 2 pole Super Smoother Filter from John Ehlers.
I chose this specific filter because I find it provides superior smoothing with low lag and fairly clean cutoff. You can, of course, implement your own filter functions to see how they compare if you feel like experimenting.
Filtering noise prior to regression calculation can be useful for providing a more stable estimation since least squares regression can be rather sensitive to noise.
This is especially true on lower sampling lengths and higher degree polynomials since the regression output becomes more "overfit" to the sample data.
Next, data arrays are populated for the x-axis and y-axis values. These are the main datasets utilized in the rest of the calculations.
To keep the calculations more numerically stable for higher periods and orders, the x array is filled with integers 1 through the sampling period rather than using current bar numbers.
This process can be thought of as shifting the origin of the x-axis as new data emerges.
This keeps the axis values significantly lower than the 10k+ bar values, thus maintaining more numerical stability at higher orders and sample lengths.
The data arrays are then used to create a pseudo 2D matrix of x power sums, and a vector of x power*y sums.
These matrices are a representation the system of equations that need to be solved in order to find the regression coefficients.
Below, you'll see some examples of the pattern of equations used to solve for our coefficients represented in augmented matrix form.
For example, the augmented matrix for the system equations required to solve a second order (quadratic) polynomial regression by least squares is formed like this:
(∑x^0 ∑x^1 ∑x^2 | ∑(x^0)y)
(∑x^1 ∑x^2 ∑x^3 | ∑(x^1)y)
(∑x^2 ∑x^3 ∑x^4 | ∑(x^2)y)
The augmented matrix for the third order (cubic) system is formed like this:
(∑x^0 ∑x^1 ∑x^2 ∑x^3 | ∑(x^0)y)
(∑x^1 ∑x^2 ∑x^3 ∑x^4 | ∑(x^1)y)
(∑x^2 ∑x^3 ∑x^4 ∑x^5 | ∑(x^2)y)
(∑x^3 ∑x^4 ∑x^5 ∑x^6 | ∑(x^3)y)
This pattern continues for any n ordered polynomial regression, in which the coefficient matrix is a n + 1 wide square matrix with the last term being ∑x^2n, and the last term of the result vector being ∑(x^n)y.
Thanks to this pattern, it's rather convenient to solve the for our regression coefficients of any nth degree polynomial by a number of different methods.
In this script, I utilize a process known as LU Decomposition to solve for the regression coefficients.
Lower-upper (LU) Decomposition is a neat form of matrix manipulation that expresses a 2D matrix as the product of lower and upper triangular matrices.
This decomposition method is incredibly handy for solving systems of equations, calculating determinants, and inverting matrices.
For a linear system Ax=b, where A is our coefficient matrix, x is our vector of unknowns, and b is our vector of results, LU Decomposition turns our system into LUx=b.
We can then factor this into two separate matrix equations and solve the system using these two simple steps:
1. Solve Ly=b for y, where y is a new vector of unknowns that satisfies the equation, using forward substitution.
2. Solve Ux=y for x using backward substitution. This gives us the values of our original unknowns - in this case, the coefficients for our regression equation.
After solving for the regression coefficients, the values are then plugged into our regression equation:
Y = a0 + a1*x + a1*x^2 + ... + an*x^n, where a() is the ()th coefficient in ascending order and n is the polynomial degree.
From here, an array of curve values for the period based on the current equation is populated, and standard deviation is added to and subtracted from the equation to calculate the channel high and low levels.
The calculated curve values can also be shifted to the left or right using the "Regression Offset" input
Changing the offset parameter will move the curve left for negative values, and right for positive values.
This offset parameter shifts the curve points within our window while using the same equation, allowing you to use offset datapoints on the regression curve to calculate the LSMA and bands.
The curve and channel's appearance is optionally approximated using Pine's v4 line tools to draw segments.
Since there is a limitation on how many lines can be displayed per script, each curve consists of 10 segments with lengths determined by a user defined step size. In total, there are 30 lines displayed at once when active.
By default, the step size is 10, meaning each segment is 10 bars long. This is because the default sampling period is 100, so this step size will show the approximate curve for the entire period.
When adjusting your sampling period, be sure to adjust your step size accordingly when curve drawing is active if you want to see the full approximate curve for the period.
Note that when you have a larger step size, you will see more seemingly "sharp" turning points on the polynomial curve, especially on higher degree polynomials.
The polynomial functions that are calculated are continuous and differentiable across all points. The perceived sharpness is simply due to our limitation on available lines to draw them.
The approximate channel drawings also come equipped with style inputs, so you can control the type, color, and width of the regression, channel high, and channel low curves.
I also included an input to determine if the curves are updated continuously, or only upon the closing of a bar for reduced runtime demands. More about why this is important in the notes below.
For additional reference, I also included the option to display the current regression equation.
This allows you to easily track the polynomial function you're using, and to confirm that the polynomial is properly supported within Pine.
There are some cases that aren't supported properly due to Pine's limitations. More about this in the notes on the bottom.
In addition, I included a line of text beneath the equation to indicate how many bars left or right the calculated curve data is currently shifted.
The display label comes equipped with style editing inputs, so you can control the size, background color, and text color of the equation display.
The Polynomial LSMA, high band, and low band in this script are generated by tracking the current endpoints of the regression, channel high, and channel low curves respectively.
The output of these bands is similar in nature to Bollinger Bands, but with an obviously different derivation process.
By displaying the LSMA and bands in tandem with the polynomial channel, it's easy to visualize how LSMAs are derived, and how the process that goes into them is drastically different from a typical moving average.
The main difference between LSMA and other MAs is that LSMA is showing the value of the regression curve on the current bar, which is the result of a modelled relationship between x and the expected value of y.
With other MA / filter types, they are typically just averaging or frequency filtering the samples. This is an important distinction in interpretation. However, both can be applied similarly when trading.
An important distinction with the LSMA in this script is that since we can model higher degree polynomial relationships, the LSMA here is not limited to only linear as it is in TV's built in LSMA.
Bar colors are also included in this script. The color scheme is based on disparity between source and the LSMA.
This script is a great study for educating yourself on the process that goes into polynomial regression, as well as one of the many processes computers utilize to solve systems of equations.
Also, the Polynomial LSMA and bands are great components to try implementing into your own analysis setup.
I hope you all enjoy it!
--------------------------------------------------------
NOTES:
- Even though the algorithm used in this script can be implemented to find any order polynomial relationship, TV has a limit on the significant figures for its floating point outputs.
This means that as you increase your sampling period and / or polynomial order, some higher order coefficients will be output as 0 due to floating point round-off.
There is currently no viable workaround for this issue since there isn't a way to calculate more significant figures than the limit.
However, in my humble opinion, fitting a polynomial higher than cubic to most time series data is "overkill" due to bias-variance tradeoff.
Although, this tradeoff is also dependent on the sampling period. Keep that in mind. A good rule of thumb is to aim for a nice "middle ground" between bias and variance.
If TV ever chooses to expand its significant figure limits, then it will be possible to accurately calculate even higher order polynomials and periods if you feel the desire to do so.
To test if your polynomial is properly supported within Pine's constraints, check the equation label.
If you see a coefficient value of 0 in front of any of the x values, reduce your period and / or polynomial order.
- Although this algorithm has less computational complexity than most other linear system solving methods, this script itself can still be rather demanding on runtime resources - especially when drawing the curves.
In the event you find your current configuration is throwing back an error saying that the calculation takes too long, there are a few things you can try:
-> Refresh your chart or hide and unhide the indicator.
The runtime environment on TV is very dynamic and the allocation of available memory varies with collective server usage.
By refreshing, you can often get it to process since you're basically just waiting for your allotment to increase. This method works well in a lot of cases.
-> Change the curve update frequency to "Close Only".
If you've tried refreshing multiple times and still have the error, your configuration may simply be too demanding of resources.
v4 drawing objects, most notably lines, can be highly taxing on the servers. That's why Pine has a limit on how many can be displayed in the first place.
By limiting the curve updates to only bar closes, this will significantly reduce the runtime needs of the lines since they will only be calculated once per bar.
Note that doing this will only limit the visual output of the curve segments. It has no impact on regression calculation, equation display, or LSMA and band displays.
-> Uncheck the display boxes for the drawing objects.
If you still have troubles after trying the above options, then simply stop displaying the curve - unless it's important to you.
As I mentioned, v4 drawing objects can be rather resource intensive. So a simple fix that often works when other things fail is to just stop them from being displayed.
-> Reduce sampling period, polynomial order, or curve drawing step size.
If you're having runtime errors and don't want to sacrifice the curve drawings, then you'll need to reduce the calculation complexity.
If you're using a large sampling period, or high order polynomial, the operational complexity becomes significantly higher than lower periods and orders.
When you have larger step sizes, more historical referencing is used for x-axis locations, which does have an impact as well.
By reducing these parameters, the runtime issue will often be solved.
Another important detail to note with this is that you may have configurations that work just fine in real time, but struggle to load properly in replay mode.
This is because the replay framework also requires its own allotment of runtime, so that must be taken into consideration as well.
- Please note that the line and label objects are reprinted as new data emerges. That's simply the nature of drawing objects vs standard plots.
I do not recommend or endorse basing your trading decisions based on the drawn curve. That component is merely to serve as a visual reference of the current polynomial relationship.
No repainting occurs with the Polynomial LSMA and bands though. Once the bar is closed, that bar's calculated values are set.
So when using the LSMA and bands for trading purposes, you can rest easy knowing that history won't change on you when you come back to view them.
- For those who intend on utilizing or modifying the functions and calculations in this script for their own scripts, I included debug dialogues in the script for all of the arrays to make the process easier.
To use the debugs, see the "Debugs" section at the bottom. All dialogues are commented out by default.
The debugs are displayed using label objects. By default, I have them all located to the right of current price.
If you wish to display multiple debugs at once, it will be up to you to decide on display locations at your leisure.
When using the debugs, I recommend commenting out the other drawing objects (or even all plots) in the script to prevent runtime issues and overlapping displays.
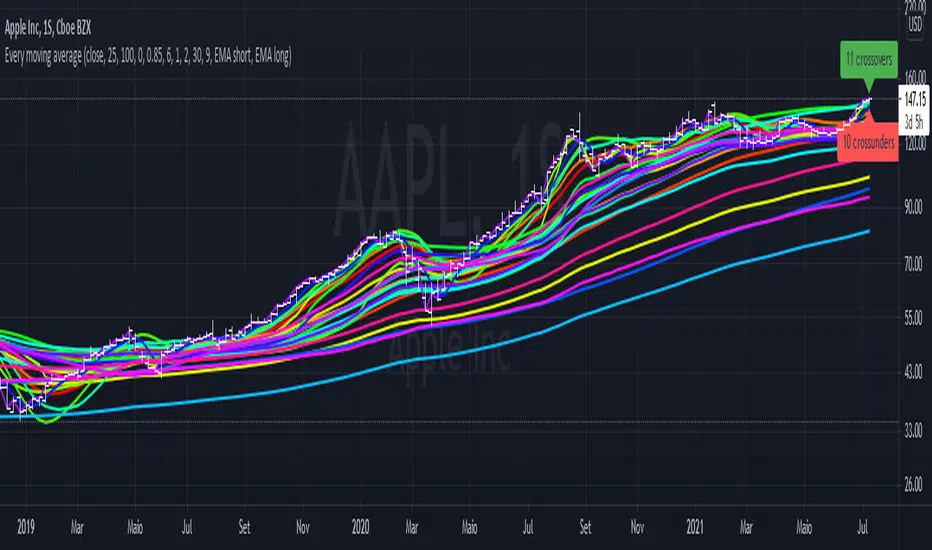
Every single moving average (ALMA, EMA, HMA, KAMA, RMA, SMA...)So you may be looking at the graph and thinking "this is a mess", and I agree.
The purpose of this script is to plot in the same graph every single type of moving average that I could think of, so you can find the ones that are better for your timeframe and for your asset. Once you add it, disable those types that doesn't seem to serve your purpose, until you can select one you like.
The average types are: ALMA, EMA, HMA, KAMA, RMA, SMA, SWMA, VIDYA, VWAP, VWMA, and WMA. Each one is ploted two times (except SWMA and VWAP), one with a short period, and another with a long, both of which you can configure.
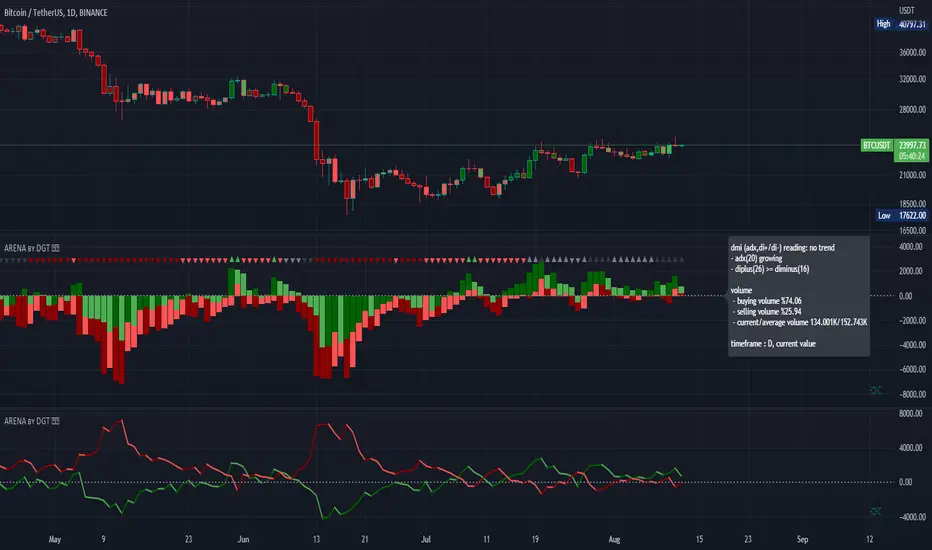
Bull vs Bear Power by DGTElder-Ray Bear and Bull Power
Dr. Alexander Elder cleverly named his first indicator Elder-Ray because of its function, which is designed to see through the market like an X-ray machine. Developed in 1989, the Elder-Ray indicator can be applied to the chart of any security and helps traders determine the strength of competing groups of bulls and bears by gazing under the surface of the markets for data that may not immediately be ascertainable from a superficial glance at prices
The Elder-Ray indicator is comprised by three elements – Bear Power, Bull Power and a 13-period Exponential Moving Average.
As the high price of any candle shows the maximum power of buyers and the low price of any candle shows the maximum power of sellers, Elder uses the 13-period EMA in order to present the average consensus of price value. Bull power shows whether buyers are capable of pushing prices above the average consensus of value. Bear power shows whether sellers are capable of pushing prices below the average consensus of value. Mathematically, Bull power is the result of subtracting the 13-period EMA from the high price of the day, and Bear power is the result of subtracting the 13-period EMA from the low price of the day.
What does this study implements
Attempts to customize interpretation of Alexander Elder's Elder-Ray Indicator (Bull and Bear Power) by
• adding additional insights to support/confirm Elder’s strategy with different indicators related with the Elder’s concept
• providing different options of visualization of the indicator
• providing smoothing capability
Other Indicators to support/confirm Elder-Ray Indicator:
Colored Directional Movement Index (CDMI) , a custom interpretation of J. Welles Wilder’s Directional Movement Index (DMI) , where :
DMI is a collection of three separate indicators ( ADX , +DI , -DI ) combined into one and measures the trend’s strength as well as its direction
CDMI is a custom interpretation of DMI which presents ( ADX , +DI , -DI ) with a color scale - representing the trend’s strength, color density - representing momentum/slope of the trend’s strength, and triangle up/down shapes - representing the trend’s direction. CDMI provides all the information in a single line with colored triangle shapes plotted on the top. DMI can provide quality information and even trading signals but it is not an easy indicator to master, whereus CDMI simplifies its usage.
Alexander Elder considers the slope of the EMA, which gives insight into the recent trend whether is up or down, and CDMI adds additional insight of verifying/confirming the trend as well as its strength
Note : educational content of how to read CDMI can be found in ideas section named as “Colored Directional Movement Index”
different usages of CDMI can be observed with studies “Candlestick Patterns in Context by DGT", “Ichimoku Colored SuperTrend + Colored DMI by DGT”, “Colored Directional Movement and Bollinger Band's Cloud by DGT”, and “Technical Analyst by DGT”
Price Convergence/Divergence , if we pay attention to mathematical formulations of bull power, bear power and price convergence/divergence (also can be expressed as price distance to its ma) we would clearly observe that price convergence/divergence is in fact the result of how the market performed based on the fact that we assume 13-period EMA is consensus of price value. Then, we may assume that the price convergence/divergence crosses of bull power, or bear power, or sum of bull and bear power could be considered as potential trading signals
Additionally, price convergence/divergence visualizes the belief that prices high above the moving average or low below it are likely to be remedied in the future by a reverse price movement
Alternatively, Least Squares Moving Average of Price Convergence/Divergence (also known as Linear Regression Curve) can be plotted instead of Price Convergence/Divergence which can be considered as a smoothed version of Price Convergence/Divergence
Note : different usages of Price Convergence/Divergence can be observed with studies “Trading Psychology - Fear & Greed Index by DGT”, “Price Distance to its MA by DGT”, “P-MACD by DGT”, where “Price Distance to its MA by DGT” can also be considered as educational content which includes an article of a research carried on the topic
Options of Visualization
Bull and Bear Power plotted as two separate
• histograms
• lines
• bands
Sum of Bull and Bear Power plotted as single
• histogram
• line
• band
Others
Price Convergence/Divergence displayed as Line
CDMI is displayed as single colored line of triangle shapes, where triangle shapes displays direction of the trend (triangle up represents bull and triangle down represent bear), colors of CDMI displays the strength of the trend (green – strong bullish, red – strong bearish, gray – no trend, yellow – week trend)
In general with this study, color densities also have a meaning and aims to displays if the value of the indicator is falling or growing, darker colors displays more intense move comparing to light one
Note : band's upper and lower levels are calculated by using standard deviation build-in function with multiply factor of 0.236 Fibonacci’s ratio (just a number for our case, no any meaning)
Smoothing
No smoothing is applied by default but the capability is added in case Price Convergence/Divergence Line is assumed to be used as a signal line it will be worth smoothing the bear, bull or sum of bear and bull power indicators
Interpreting Elder-Ray Indicator, according to Dr. Alexander Elder
Bull Power should remain positive in normal circumstances, while Bear Power should remain negative in normal circumstances. In case the Bull Power indicator enters into negative territory, this implies that sellers have overcome buyers and control the market. In case the Bear Power indicator enters into positive territory, this indicates that buyers have overcome sellers and control the market. A trader should not go long at times when the Bear Power indicator is positive and he/she should not go short at times when the Bull Power indicator is negative.
13-period EMAs slope can be used in order to identify the direction of the major trend. According to Elder, the most reliable buy signals are generated, when there is a bullish divergence between the Bear Power indicator and the price (Bear Power forms higher lows, while the market forms lower lows). The most reliable sell signals are generated, when there is a bearish divergence between the Bull Power indicator and the price (Bull Power forms lower highs, while the market forms higher highs).
There are four basic conditions, required to go long or short, with the use of the Elder-Ray method alone.
In order to go long:
1. The market is in a bull trend, as indicated by the 13-period EMA
2. Bear Power is in negative territory, but increasing
3. The most recent Bull Power top is higher than its prior top
4. Bear Power is going up from a bullish divergence
The last two conditions are optional that fine-tune the buying decision
In order to go short:
1. The market is in a bear trend, as indicated by the 13-period EMA
2. Bull Power is in positive territory, but falling
3. The most recent Bear Power bottom is lower than its prior bottom
4. Bull Power is falling from a bearish divergence
The last two conditions are optional, they provide a stronger signal for shorting but they are not absolutely essential
If a trader is willing to add to his/her position, he/she needs to:
1. add to his/her long position, when the Bear Power falls below zero and then climbs back into positive territory
2. add to his/her short position, when the Bull Power increases above zero and then drops back into negative territory.
note : terminology of the definitions used herein are as per TV dictionary
Trading success is all about following your trading strategy and the indicators should fit within your trading strategy, and not to be traded upon solely
Disclaimer : The script is for informational and educational purposes only. Use of the script does not constitute professional and/or financial advice. You alone have the sole responsibility of evaluating the script output and risks associated with the use of the script. In exchange for using the script, you agree not to hold dgtrd TradingView user liable for any possible claim for damages arising from any decision you make based on use of the script
Rolling Linear Regression ChannelCompute a rolling linear regression channel, the value of the bands at a precise point in time is equal to the last value of the corresponding extremity of a regression channel of equal length and mult at that point. The bands are made by adding/subtracting the RMSE of a linear regression to a least-squares moving average.
Settings
Length : Period of the indicator
Mult : Multiplication factor for the RMSE, determine the distance between the upper and lower extremities
Src : Input data for the indicator
Gradient : Determine if the area within the bands must be filled with a gradient, a color closer to blue indicates that src is close/superior to the upper band while a color closer to red indicates that src is close/inferior to the lower band. True by default, if false no filling is applied.
Usage
The indicator can be used like any other band indicator. Because the indicator makes use of the LSMA we can expect the bands to be more reactive to price changes, the indicator can also be more accurate when the bands must act as support and resistance as long as the underlying trend in the price is linear.
In blue/red the indicator, with the Bollinger bands in dark green with the same length/mult settings.
Since the indicator is derived from the linear regression channel indicator it can also be used to look at how drastically the regression channels changed over time, that is if the bands look linear, then it implies that the channel didn't change a lot with the arrival of new closing prices.
Details
As said the last value of each band is equal to the last value of the corresponding extremity of a linear regression channel.
In blue/red the indicator, with the linear regression channel in orange with the same length/mult settings, the last circle of the upper band is equal to the last value of the upper regression channel, same thing with the lower band, you can see this more clearly using the replay mode.
Notes
Thx to the twitter fans for their feedback and support, note that I often ask about feedback or about what kind of indicators I should do next on Twitter.

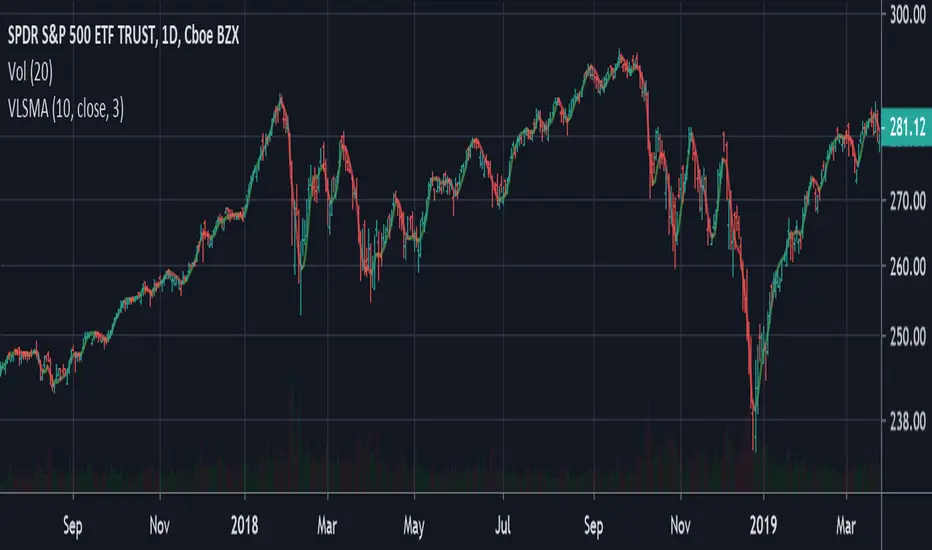
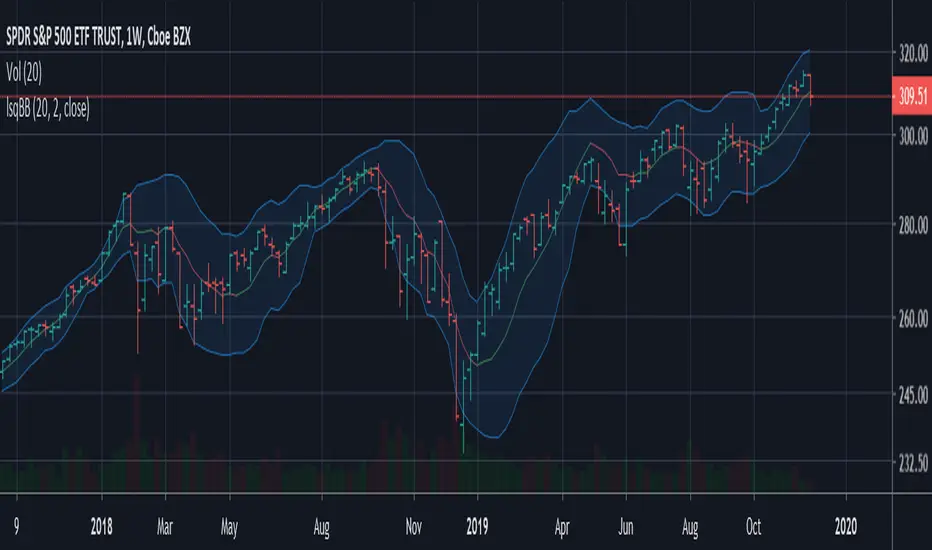
Computing The Linear Regression Using The WMA And SMAPlot a linear regression channel through the last length closing prices, with the possibility to use another source as input. The line is fit by using linear combinations between the WMA and SMA thus providing both an interesting and efficient method. The results are the same as the one provided by the built-in linear regression, only the computation differ.
Settings
length : Number of inputs to be used.
src : Source input of the indicator.
mult : Multiplication factor for the RMSE, determine the distance between the upper and lower level.
Usage
In technical analysis a linear regression can provide an estimate of the underlying trend in the price, this result can be extrapolated to have an estimate of the future evolution of the trend, while the upper and lower level can be used as support and resistance levels.
The slope of the fitted line indicates both the direction and strength of the trend, with a positive slope indicating an up-trending market while a negative slope indicates a down-trending market, a steeper line indicates a stronger trend.
We can see that the trend of the S&P500 in this chart is approximately linear, the upper and lower levels were previously tested and might return accurate support and resistance points in the future.
By using a linear regression we are making the following assumptions:
The trend is linear or approximately linear.
The cycle component has an approximately constant amplitude (this allows the upper and lower level to be more effective)
The underlying trend will have the same evolution in the future
In the case where the growth of a trend is non-linear, we can use a logarithmic scale to have a linear representation of the trend.
Details
In a simple linear regression, we want to the slope and intercept parameters that minimize the sum of squared residuals between the data points and the fitted line
intercept + x*slope
Both the intercept and slope have a simple solution, you can find both in the calculations of the lsma, in fact, the last point of the lsma with period length is equal to the last point of a linear regression fitted through the same length data points. We have seen many times that the lsma is an FIR filter with a series of coefficients representing a linearly decaying function with the last coefficients having a negative value, as such we can calculate the lsma more easily by using a linear combination between a WMA and SMA: 3WMA - 2SMA , this linear combination gives us the last point of our linear regression, denoted point B .
Now we need the first point of our linear regression, by using the calculations of the lsma we get this point by using:
intercept + (x-length+1)*slope
If we get the impulse response of such lsma we get
In blue the impulse response of a standard lsma, in red the impulse response of the lsma using the previous calculation, we can see that both are the same with the exception that the red one appears as being time inverted, the first coefficients are negative values and as such we also have a linear operation involving the WMA and SMA but with inverted terms and different coefficients, therefore the first point of our linear regression, denoted point A , is given by 4SMA - 3WMA , we then only need to join these two points thanks to "line.new".
The levels are simply equal to the fitted line plus/minus the root mean squared error between the fitted line and the data points, right now we only have two points, we need to find all the points of the fitted line, as such we first need to find the slope, which can be calculated by diving the vertical distance between B and A (the rise) with the horizontal distance between B and A (the run), that is
(A - B)/(length-1)
Once done we can find each point of our line by using
B + slope*i
where i is the position of the point starting from B, i=0 give B since B + slope*0 = B , then we continue for every i , we then only need to sum the squared distance between each closing prices at position i and the point found at that same position, we divide by length-1 and take the square root of the result in order to have the RMSE.
In Summary
The following post as shown that it was possible to compute a linear regression by using a linear combination between the WMA and SMA, since both had extremely efficient computations (see link at the end of the post) we could have a calculation for the linear regression where the number of operations is independent of length .
This post took me eons to make because it's related to the lsma, and I am rarely short on words when it comes to anything related to the lsma. Thx to LucF for the feedback and everything.

WMA/LSMA - Simplified CalculationsLots of moving averages are based on a weighted sum, the most common ones being the simple (arithmetic) and linearly weighted moving average. The problems with the weighted sum approach is that when your moving average is a FIR filter then the number of operations increase with higher values of length, and when the weights are based on a complex calculation this number of operations can increase drastically!
For the common technical analyst the calculation time of moving averages can be an insignificant factor, even more when using higher time frames, however its always a good practice to seek better performances. The SMA has already a calculation where the number of operations is independent of its length, as such it can be easy to do the same for the linearly weighted moving average (WMA). This post will describe the process toward calculating a simple and efficient WMA which will then be used to provide an efficient calculation of the least squares moving average (LSMA).
Carving Impulses Responses
Remember that impulses responses fully describe the properties of moving averages, the impulse response of the WMA is a linearly decreasing function, so we'll try to calculate it without using a weighted sum. We first need to use a cumulative sum, the cumulative sum can be described as a summation from the first element of a series to the n th element of the series, where n is the current bar number, one could say that this operation is actually super inefficient, however this is not the case, as a cumulative sum can be calculated recursively as follows:
y = y + x
The cumulative sum can be described as an amplifier and posses the following impulse response:
Once the cumulative sum receive the impulse signal as input the result will always be equal to 1. This will form the basis of our simplified calculation, all we need to do transform this response into a linearly decreasing one. The full process is as follows:
Get the impulse response of the cumulative sum
Subtract this response from a linearly increasing impulse response of size length
Normalize the result such that the sum of the resulting response is equal to 1
We need a linearly increasing response of size length , this can be done by using a running sum of the original cumulative sum response, however we must make sure that the value of this response is 0 when the one of the cumulative sum is first equal to 1. Because the resulting response as a maximum value of length we need to multiply our cumulative sum response with length , then we proceed to subtraction.
Finally we need to normalize the result, the sum of a linear sequence of values starting at 1 and ending at n is given by the explicit formula : n(n+1)/2 , which in our case give length*(length+1)/2 , we divide our previous response with this result and we end up with the impulse response of a WMA. This process can be graphically described as follows:
We can then replace the impulse function by the closing price in order to get the WMA of the closing price.
Advantages And Disadvantages
The big advantage of this calculation is its efficiency, in its non functional form (you can see it in the code) the calculation of the WMA only require 9 operations regardless of the value of length against length*2 + 4 for the weighted sum approach, as such both methods are equally efficient in terms of operations as long as the length of a standard WMA is inferior to 3, which is ridiculous, as such our approach is more appropriate.
Another advantage is that Pinescript does not allow for series as length arguments in the WMA function, however here we can have a variable length for the WMA.
Of course there are disadvantages to this approach, in terms of code we require more variables for the non functional form, which create a lengthier scripts. Another disadvantage is that we can be prone to rounding errors due to the cumulative sum, however they shouldn't be significants in our case.
Getting The Least Squares Moving Average
The LSMA is one of my favorite moving averages, and it can derived from a linear combination between the WMA and SMA described as follows : 3WMA - 2SMA. Since we proposed an alternative calculation of the WMA we can then calculate the LSMA without even using the SMA, why ? because the SMA can be calculated by computing the changes over length period of the cumulative sum of an input, this result is then divided by length .
Remember that the impulse response of a cumulative sum is just a rectangular function, all we need is to truncate it such that only length values of the response are equal to 1, this is done thanks to the change function in Pine.
In Summary
A more efficient calculations for both the WMA and LSMA have been presented, while this on itself isn't super important you have learned what is the process toward calculating a filter without relying on a weighted sum.
This calculation will soon be included in the Pinecoders script allowing series as length argument.
Thank you for reading, your interest is always appreciated !

Moving Averages Linear CombinatorLinearly combining moving averages can provide relatively interesting results such as a low-lagging moving averages or moving averages able to produce more pertinent crosses with the price.
As a remainder, a linear combination is a mathematical expression that is based on the multiplication of two variables (or terms) with two coefficients (also called scalars when working with vectors) and adding the results, that is:
ax + by
This expression is a linear combination , with x/y as variables and a/b as coefficients. Lot of indicators are made from linear combinations of moving averages, some examples include the double/triple exponential moving average, least squares moving average and the hull moving average.
Today proposed indicator allow the user to combine many types of moving averages together in order to get different results, we will introduce each settings of the indicator as well as how they affect the final output.
Explaining The Effects Of Linear Combinations
There are various ways to explain why linear combination can produce low-lagging moving averages, lets take for example the linear combination of a fast SMA of period p/2 and slow simple moving average of period p , the linear combination of these two moving averages is described as follows:
MA = 2SMA(p/2) + -1SMA(p)
Which is equivalent to:
MA = 2SMA(p/2) - SMA(p) = SMA(p/2) + SMA(p/2) - SMA(p)
We can see the above linear combinations consist in adding a bandpass filter to the fast moving average, which of course allow to reduce the lag. It is important to note that lag is reduced when the first moving average term is more reactive than the second moving average term. In case we instead use:
MA = -2SMA(p/2) + 1SMA(p)
we would have a combination between a low-pass and band-reject filter.
The Indicator
The indicator is based on the following linear combination:
Coeff × LeadingMA(length) - (Coeff-1) × LaggingMA(length)
The length setting control both moving averages period, leading control the type of moving average used as leading MA, while lagging control the type of MA used as lagging moving average, in order to get low lag results the leading MA should be more reactive than the lagging MA. Coeff control the coefficients of the linear combination, with higher values of coeff amplifying the effects of the linear combination, negative values of coeff would make a low-lag moving average become a lagging moving average, coeff = 1 return the leading MA, coeff = -1 return the lagging MA. The leading period divisor allow to divide the period of the leading MA by the selected number.
The types of moving average available are: simple, exponentially weighted, triangular, least squares, hull and volume weighted. The lagging MA allow you to select another MA on the chart as input.
length = 100, leading period divisor = 2, coeff = 2, with both MA type = SMA. Using coeff = -2 instead would give:
You can select "Plot leading and lagging" in order to show the leading and lagging MA.
Conclusion
The proposed tool allow the user to create a custom moving averages by making use of linear combination. The script is not that useful when you think about it, and might maybe be one of my worst, as it is relatively impractical, not proud of it, but it still took time to make so i decided to post it anyway.

Parametric Corrective Linear Moving AveragesImpulse responses can fully describe their associated systems, for example a linearly weighted moving average (WMA) has a linearly decaying impulse response, therefore we can deduce that lag is reduced since recent values are the ones with the most weights, the Blackman moving average (or Blackman filter) has a bell shaped impulse response, that is mid term values are the ones with the most weights, we can deduce that such moving average is pretty smooth, the least squares moving average has negative weights, we can therefore deduce that it aim to heavily reduce lag, and so on. We could even estimate the lag of a moving average by looking at its impulse response (calculating the lag of a moving average is the aim of my next article with Pinescripters) .
Today a new moving average is presented, such moving average use a parametric rectified linear unit function as weighting function, we will see that such moving average can be used as a low lag moving average as well as a signal moving average, thus creating a moving average crossover system. Finally we will estimate the LSMA using the proposed moving average.
Correctivity And The Parametric Rectified Linear Unit Function
Lot of terms are used, each representing one thing, lets start with the easiest one,"corrective". In some of my posts i may have used the term "underweighting", which refer to the process of attributing negative weights to the input of a moving average, a corrective moving average is simply a moving average underweighting oldest values of the input, simply put most of the low lag moving averages you'll find are corrective. This term was used by Aistis Raudys in its paper "Optimal Negative Weight Moving Average for Stock Price Series Smoothing" and i felt like it was a more elegant term to use instead of "low-lag".
Now we will describe the parametric rectified linear unit function (PReLU), this function is the one used as weighting function and is not that complex. This function has two inputs, alpha , and x , in short if x is greater than 0, x remain unchanged, however if x is lower than 0, then the function output is alpha × x , if alpha is equal to 1 then the function is equivalent to an identity function, if alpha is equal to 0 then the function is equivalent to a rectified unit function.
PReLU is mostly used in neural network design as an activation function, i wont explain to you how neural networks works but remember that neural networks aim to mimic the neural networks in the brain, and the activation function mimic the process of neuron firing. Its a super interesting topic because activation functions regroup many functions that can be used for technical indicators, one example being the inverse fisher RSI who make use of the hyperbolic tangent function.
Finally the term parametric used here refer to the ability of the user to change the aspect of the weighting function thanks to certain settings, thinking about it, it isn't a common things for moving averages indicators to let the user modify the characteristics of the weighting function, an exception being the Arnaud Legoux moving average (ALMA) which weighting function is a gaussian function, the user can control the peak and width of the function.
The Indicator
The indicator has two moving averages displayed on the chart, a trigger moving average (in blue) and a signal moving average (in red), their crosses can generate signals. The length parameter control the filter length, with higher values of length filtering longer term price fluctuations.
The percentage of negative weights parameter aim to determine the percentage of negative weights in the weighting function, note that the signal moving average won't use the same amount and will use instead : 100 - Percentage , this allow to reverse the weighting function thus creating a more lagging output for signal. Note that this parameter is caped at 50, this is because values higher than 50 would make the trigger moving average become the signal moving average, in short it inverse the role of the moving averages, that is a percentage of 25 would be the same than 75.
In red the moving average using 25% of negative weights, in blue the same moving average using 14% percent of negative weights. In theory, more negative weights = less lag = more overshoots.
Here the trigger MA in blue has 0% of negative weights, the trigger MA in green has however 35% of negative weights, the difference in lag can be clearly seen. In the case where there is 0% of negative weights the trigger become a simple WMA while the signal one become a moving average with linearly increasing weights.
The corrective factor is the same as alpha in PReLU, and determine the steepness of the negative weights line, this parameter is constrained in a range of (0,1), lower values will create a less steep negative weights line, this parameter is extremely useful when we want to reduce overshoots, an example :
here the corrective factor is equal to 1 (so the weighting function is an identity function) and we use 45% of negative weights, this create lot of overshoots, however a corrective factor of 0.5 reduce them drastically :
Center Of Linearity
The impulse response of the signal moving average is inverse to the impulse response of the trigger moving average, if we where to show them together we would see that they would crosses at a point, denoted center of linearity, therefore the crosses of each moving averages correspond to the cross of the center of linearity oscillator and 0 of same period.
This is also true with the center of gravity oscillator, linear covariance oscillator and linear correlation oscillator. Of course the center of linearity oscillator is way more efficient than the proposed indicator, and if a moving average crossover system is required, then the wma/sma pair is equivalent and way more efficient, who would know that i would propose something with more efficient alternatives ? xD
Estimating A Least Squares Moving Average
I guess...yeah...but its not my fault you know !!! Its a linear weighting function ! What can i do about it ?
The least squares moving average is corrective, its weighting function is linearly decreasing and posses negative weights with an amount of negative weights inferior to 50%, now we only need to find the exact percentage amount of negative weights. How to do it ? Well its not complicated if we recall the estimation with the WMA/SMA combination.
So, an LSMA of period p is equal to : 3WMA(p) - 2SMA(p) , each coefficient of the combination can give us this percentage, that is 2/3*100 = 33.333 , so there are 33.33% percent of negative weights in the weighting function of the least squares moving average.
In blue the trigger moving average with percentage of negative values et to 33.33, and in green the lsma of both period 50.
Conclusion
Altho inefficient, the proposed moving averages remain extremely interesting. They make use of the PReLU function as weighting function and allow the user to have a more accurate control over the characteristics of the moving averages output such as lag and overshoot amount, such parameters could even be made adaptive.
We have also seen how to estimate the least squares moving average, we have seen that the lsma posses 33.333...% of negative weights in its weighting function, another useful information.
The lsma is always behind me, not letting me focus on cryptobot super profit indicators using massive amount of labels, its like each time i make an indicator, the lsma come back, like a jealous creature, she want the center of attention, but you know well that the proposed indicator is inefficient ! Inefficient elegance (effect of the meds) .
Thanks for reading !
LSMA - A Fast And Simple Alternative CalculationIntroduction
At the start of 2019 i published my first post "Approximating A Least Square Moving Average In Pine", who aimed to provide alternatives calculation of the least squares moving average (LSMA), a moving average who aim to estimate the underlying trend in the price without excessive lag.
The LSMA has the form of a linear regression ax + b where x is a linear sequence 1.2.3..N and with time varying a and b , the exact formula of the LSMA is as follows :
a = stdev(close,length)/stdev(bar_index,length) * correlation(close,bar_index,length)
b = sma(close,length) - a*sma(bar_index,length)
lsma = a*bar_index + b
Such calculation allow to forecast future values however such forecast is rarely accurate and the LSMA is mostly used as a smoother. In this post an alternative calculation is proposed, such calculation is incredibly simple and allow for an extremely efficient computation of the LSMA.
Rationale
The LSMA is a FIR low-pass filter with the following impulse response :
The impulse response of a FIR filter gives us the weight of the filter, as we can see the weights of the LSMA are a linearly decreasing sequence of values, however unlike the linearly weighted moving average (WMA) the weights of the LSMA take on negative values, this is necessary in order to provide a better fit to the data. Based on such impulse response we know that the WMA can help calculate the LSMA, since both have weights representing a linearly decreasing sequence of values, however the WMA doesn't have negative weights, so the process here is to fit the WMA impulse response to the impulse response of the LSMA.
Based on such negative values we know that we must subtract the impulse response of the WMA by a constant value and multiply the result, such constant value can be given by the impulse response of a simple moving average, we must now make sure that the impulse response of the WMA and SMA cross at a precise point, the point where the impulse response of the LSMA is equal to 0.
We can see that 3WMA and 2SMA are equal at a certain point, and that the impulse response of the LSMA is equal to 0 at that point, if we proceed to subtraction we obtain :
Therefore :
LSMA = 3WMA - 2SMA = WMA + 2(WMA - SMA)
Comparison
On a graph the difference isn't visible, subtracting the proposed calculation with a regular LSMA of the same period gives :
the error is 0.0000000...and certainly go on even further, therefore we can assume that the error is due to rounding errors.
Conclusion
This post provided a different calculation of the LSMA, it is shown that the LSMA can be made from the linear combination of a WMA and a SMA : 3WMA + -2SMA. I encourage peoples to use impulse responses in order to estimate other moving averages, since some are extremely heavy to compute.
Thanks for reading !

Volume weighted LSMAQuick script made by reusing some functions written for other projects. This is a variation on the least squares moving average, but with custom weights on the linear regression. This gives higher weights to recent values and values with high volume.
Behaves very similarly to my volume weighted Hull moving average, especially with the hull smoothing option turned on.
Least Squares Bollinger BandsSimilar to Bollinger Bands but adjusted for momentum. Instead of having the centerline be a simply moving average and the bands showing the rolling variance, this does a linear regression, and shows the LSMA at the center, while the band width is the average deviation from the regression line instead of from the SMA.
This means that unlike for normal Bollinger bands, momentum does not make the bands wider, and that the bands tend to be much better centered around the price action with band walks being more reliable indicators of undersold/oversold conditions. They also give a much narrower estimate of current volatility/price range.
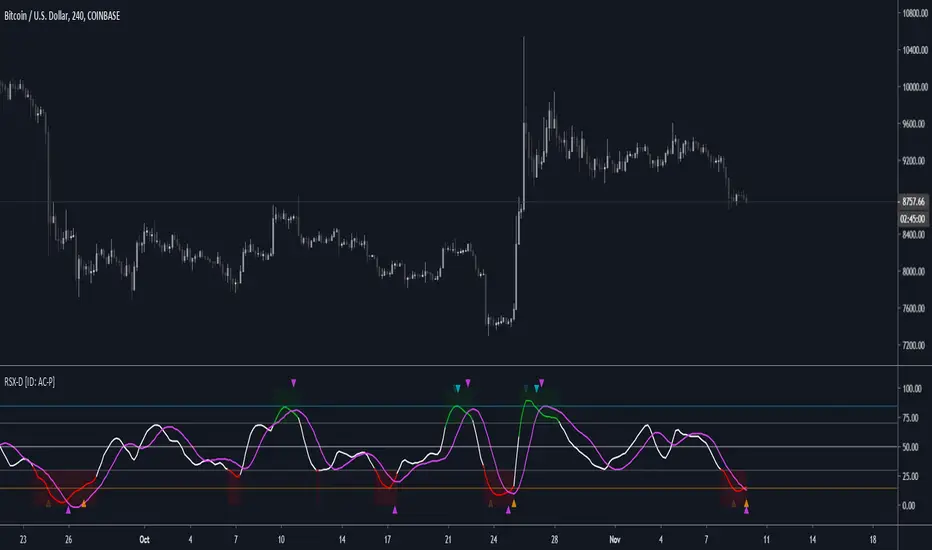
RSX-D [ID: AC-P]The "AC-P" version of Jaggedsoft's RSX Divergence and Everget's RSX script is my personal customized version of RSX with the following additions and modifications:
LSMA-D line that averages in three LSMA components to form a composite, the LSMA-D line. Offset for the LSMA-D line is set to -2 to offset latency from averaging togther the LSMA components to form a composite - recommended to adjust to your timeframe and asset/pair accordingly.
Divergence component from JustUncle, RicardoSantos, and Neobutane divergence scripts
Crossover indication and alerts for Midline, and custom M1 and M2 levels for both RSX and the LSMA-D line from Daveatt's CCI Stochastic Script
EMA21/55 zone cross highlighting option
SMA9/EMA45 MA option from my RSI sma/ema Cu script
Libertus Divergences and Pivot labels from Jaggedsoft's RSX Divergence script are hidden/off by default
Designed for darkmode by default. Minor visual changes from Jaggedsoft's and Everget's script(s) for darkmode and visual aesthetic.
Please Note:
Divergences that use fractal-based detection logic, offset, or a combination of both generally have a 1-2 bar/candle lag. This is an INHERENT limitation of divergence detection with fractals and offsets. Divergences generally will have a higher strikerate on HTF than LTF due to the 1-2 bar lag. While I'm not going to rule out a programming solution or math construct/formula that attempts to alleivates the 1-2 bar lag for divergences, this script is not it - please keep that in mind when using divergence components with a fractal base and offset.
LSMA-D is a composite of three LSMA lines, all with offset options. Different lengths and Offset values can compensate/adjust for the smoothing/latency from RSX, but only up to a certain point. For each LSMA, the least square regression line is calculated for the previous time periods, so the idea is that with finely tuned adjustments, you can get crossover/crossunder signals from the RSX with the LSMA-D line that you simply can't get with the SMA9/EMA45 due to the already smoothed RSX.
The defaults for the RSX and various components for the LSMA-D here will MOSTLY LIKELY NOT WORK OR BE APPLICABLE to every timeframe and asset that you trade - adjust, backtest, and test accordingly. The defaults are here are MEANT to be adjusted to the asset class and timeframe that you are trading.
If you're not familiar with the LSMA, tradingview author Alexgrover has a few great scripts that go into detail how the LSMA works, in addition to different interpretations and implementations of the LSMA.
References/Acknowledgements:
//@version=4
// Copyright (c) 2019-present, Alex Orekhov (everget)
// Jurik RSX script may be freely distributed under the MIT license.
//
//-------------------------------------------------------------------
// Acknowledgements:
//---- Base script:
// RSX Divergence — SharkCIA by Jaggedsoft
//
// Jurik Moving Average by Everget
//
//---- Divergences/Signals:
// Libertus RSI Divergences
//
// Price Divergence Dectector V3 by JustUncle
//
// Price Divergence Detector V2 by RicardoSantos
//
// Stochastic RSI with Divergences by Neobutane
//
// CCI Stochastic by Daveatt
//
//---- Misc. Reference:
// RSI SMA/EMA Cu by Auroagwei
//
// CBCI Cu by Auroagwei
//
// Chop and explode by fhenry0331
//
// T-Step LSMA by RafaelZioni
//
// Scripts by Jaggedsoft for structure and formatting
// Scripts by Everget for structure and formatting
//-------------------------------------------------------------------
// RSX-D v08
// Author: Auroagwei
// www.tradingview.com
//-------------------------------------------------------------------