Session Volume Profile Sniffer: HVN & Rejection ZonesA simple tool built for traders who rely on intraday volume structure.
What this script does
This script tracks volume distribution inside a selected session and highlights two key price levels:
High Volume Nodes (HVNs) — areas where price spent time building heavy participation.
Low Volume Nodes (LVNs) — thin zones where price moved quickly with very little interest.
Instead of plotting a full profile, this tool gives you the exact rejection-level lines you usually hunt manually.
Why these levels matter
HVN → price tends to react, stall, or flip direction
LVN → price often rejects strongly since liquidity is thin
Rejection patterns around these areas give clean entry signals
Positioning trades around HVN/LVN helps filter noise in choppy sessions
This script removes the trouble of drawing profiles, counting bins, or guessing node levels. Everything is calculated inside the session you choose.
How the detection works
Inside your session window, the script:
1. Tracks each tick-based price bucket
2. Accumulates raw volume for every bucket
Identifies:
HVNs = buckets with volume above a tier
LVNs = buckets with volume below a tier
3. Prints each level as a single clean line
4. Generates:
Long signal → bounce from LVN
Short signal → rejection from HVN
Built-in exits use ATR-based conditions for quick testing.
Features
Session-based volume mapping
HVN + LVN levels drawn automatically
Entry triggers based on rejection
ATR exits for experimental backtests
Clean, minimal visual output
Best use cases
Intraday futures
Index scalping
FX sessions (London / NY)
Crypto sessions (user-timed)
Anyone who trades around volume structure
Adjustable settings
Session window
Volume bin size
HVN multiplier
LVN multiplier
Enable/disable zone lines
This keeps it flexible enough for both scalpers and slow-paced intraday setups.
Important note
This script is built for study + idea testing.
It is not intended as a final system.
Once you identify how price behaves around these nodes, you can blend this tool into your own setup.
LVN

LVN/HVN Auto Detection [PhenLabs]📊 PhenLabs - LVN/HVN Auto Detection
Version: PineScript™ v6
📌 Description
The PhenLabs LVN/HVN Auto Detection indicator is an advanced volume profile analysis tool that automatically identifies Low Volume Nodes (LVN) and High Volume Nodes (HVN) across multiple trading sessions. This sophisticated indicator analyzes volume distribution patterns to pinpoint critical support and resistance levels where price is likely to react, providing traders with high-probability zones for entries, exits, and risk management.
Unlike traditional volume indicators that only show current activity, this tool builds comprehensive volume profiles from historical sessions and intelligently filters the most significant levels. It combines real-time volume analysis with dynamic level detection, offering both visual bubbles for immediate volume activity and persistent horizontal lines that act as ongoing support/resistance references.
🚀 Points of Innovation
Multi-Session Volume Profile Analysis - Automatically calculates and analyzes volume profiles across the last 5 trading sessions
Intelligent Level Separation Logic - Prevents overlapping signals by maintaining minimum separation between LVN and HVN levels
Dynamic Timeframe Adaptation - Automatically adjusts session lengths based on chart timeframe for optimal level detection
Real-Time Activity Bubbles - Shows volume activity strength through different bubble sizes at key levels
Persistent Line Management - Creates horizontal lines that extend until price crosses them, providing ongoing reference points
Dual Threshold System - Independent percentage-based thresholds for both LVN and HVN identification
🔧 Core Components
Volume Profile Engine : Builds 20-row volume profiles for each analyzed session, distributing volume across price levels
Level Identification Algorithm : Uses percentage-based thresholds to classify volume distribution patterns
Separation Logic : Ensures minimum distance between conflicting levels, prioritizing HVN when overlap occurs
Line Management System : Tracks active support/resistance lines and removes them when price crosses through
Volume Activity Monitor : Compares current volume to 13-period moving average for activity classification
🔥 Key Features
Customizable Thresholds : LVN threshold (5-35%, default 20%) and HVN threshold (65-95%, default 80%) for precise level filtering
Volume Activity Multiplier : Adjustable volume threshold (0.5+, default 1.5) for bubble and line creation sensitivity
Flexible Display Modes : Choose between Lines only, Bubbles only, or Both for optimal chart clarity
Smart Level Separation : Minimum separation percentage (0.1-2%, default 0.5%) prevents conflicting signals
Color Customization : Independent color controls for LVN (red) and HVN (blue) elements
Performance Optimization : Processes every 15 bars with maximum 500 active lines for smooth operation
🎨 Visualization
Colored Bubbles : Three sizes (large, medium, small) indicate volume activity strength at key levels
Horizontal Lines : Persistent support/resistance lines with width corresponding to volume activity
Dual Color System : Semi-transparent red for LVN areas, semi-transparent blue for HVN zones
Information Tooltip : Optional table showing usage guidelines and optimization tips
📖 Usage Guidelines
Volume Thresholds
LVN Threshold
○ Default: 20.0%
○ Range: 5.0-35.0%
○ Description: Price levels with volume below this percentage are marked as LVNs. Lower values create fewer, more significant levels. Typical range 15-25% works for most instruments.
HVN Threshold
○ Default: 80.0%
○ Range: 65.0-95.0%
○ Description: Price levels with volume above this percentage are marked as HVNs. Higher values create fewer, stronger levels. Range 75-85% is optimal for most trading.
Display Controls
Volume Threshold
○ Default: 1.5
○ Range: 0.5+
○ Description: Multiplier for volume significance (High=2+threshold, Medium=1+threshold, Low=0+threshold). Higher values require more volume for signals.
✅ Best Use Cases
Swing Trading : Identify key levels for position entries and exits over multiple days
Scalping : Use bubbles for immediate volume activity confirmation at critical levels
Risk Management : Place stops beyond LVN levels where price moves quickly
Breakout Trading : Monitor HVN levels for potential breakout or rejection scenarios
Multi-Timeframe Analysis : Combine with higher timeframe levels for confluence
⚠️ Limitations
Timeframe Sensitivity : Lower timeframes may produce too many levels; higher timeframes recommended for cleaner signals
Volume Data Dependency : Accuracy depends on reliable volume data from your data provider
Historical Analysis : Uses past volume data which may not predict future price behavior
Performance Impact : High number of active lines may affect chart performance on slower devices
💡 What Makes This Unique
Automated Session Analysis : No manual drawing required - automatically analyzes multiple sessions
Intelligent Filtering : Advanced separation logic prevents overlapping and conflicting signals
Adaptive Processing : Adjusts to different timeframes automatically for optimal level detection
Dual Visualization System : Combines persistent lines with real-time activity indicators
🔬 How It Works
1. Volume Profile Construction :
Analyzes the last 5 trading sessions with dynamic session length based on timeframe
Divides each session’s price range into 20 equal levels for volume distribution analysis
2. Level Classification :
Calculates volume percentage at each price level relative to session maximum
Identifies LVN levels below threshold and HVN levels above threshold
3. Signal Generation :
Creates bubbles when volume activity exceeds thresholds at identified levels
Draws horizontal lines that persist until price crosses through them
💡 Note : For optimal results, increase your chart timeframe if you see too many levels. The indicator performs best on 15-minute and higher timeframes where volume patterns are more meaningful and less noisy.

Price Range Volume Profile++ [Pt]█ Introduction
The Price Range Volume Profile++ (PRVP++) is an advanced, feature-rich indicator specifically designed for volume profile users for in-depth volume analysis. Unlike most other volume profile tools that are limited to a 5000-bar lookback, PRVP++ can utilize all available candles on the chart, offering an unparalleled scope of historical data analysis.
█ Main Features
Full Chart Historical Lookback : PRVP++ sets a new standard with its ability to analyze the entire history of candles available on a chart, far exceeding the typical 5000-bar limit of other tools. This feature allows traders to conduct a comprehensive and detailed study of volume data over extensive time periods.
Volume Profile Analysis : The tool provides an in-depth volume profile analysis, showcasing the distribution of trading activity across different price levels. This is crucial for identifying key areas of interest in the market.
Bull/Bear Strength Profile : A standout feature that displays the relative strength of buyers (bulls) and sellers (bears) at different price levels. This visual representation helps traders gauge market sentiment and power dynamics.
Automatic HVN and LVN Identification : PRVP++ automatically highlights High Volume Nodes (HVNs) and Low Volume Nodes (LVNs), making it easier for traders to identify significant zones of trading activity and potential breakout areas.
Customization and Visual Enhancements : Offers customization for the profile's width, horizontal offset, and a sophisticated gradient color scheme for HVNs and LVNs, enhancing the tool's visual appeal and analytical utility.
█ Input Parameters
Price Range : Sets the percentage distance for the volume profile relative to the current closing price, determining the extent of volume data analysis.
Profile Step Size (Tick Size) : Users can choose automatic sizing or set a specific tick step size, offering flexibility in the granularity of the volume profile.
Volume Profile Options : Includes settings for gradient power and color selections for high and low volume areas, along with a fun mode for random color variations.
Profile Placement and Appearance : Adjustments for profile width, horizontal offset, and the option for background fill to enhance visibility.
Background Fill : Allows users to fill the background of the volume profile range, enhancing the visual impact and readability.
Time Weighted Profile : An option that weights the volume profile to give more emphasis to recent trading activities, highlighting the impact of recent market movements.
Smooth Filter : A feature that smoothens the volume profile to reduce noise and fluctuations, offering a clearer view of dominant volume levels.
High and Low Volume Node Settings : Customizable detection settings for HVNs and LVNs, line styles, label text sizes, and the option to extend lines for clearer market analysis.
Extra Settings : Includes displaying the current price on the profile, a customizable settings table with adjustable location and font size, and table opacity.
Random Color Generation : A feature for dynamically changing the colors used in the volume profile.
█ Possible Use Cases
Long-Term Market Analysis : Due to its ability to analyze all available candles on the chart, PRVP++ is exceptionally suited for long-term market analysis. Traders can study the historical volume profile over extended periods, identifying significant volume trends and shifts that could impact long-term investment strategies.
Identifying Key Support and Resistance Levels : The automatic HVN and LVN identification feature of PRVP++ makes it easier for traders to spot potential support and resistance levels. HVNs often correspond to strong support or resistance zones where significant trading activity has occurred, while LVNs may indicate levels where the price could break through more easily.
Gauging Market Sentiment with Bull/Bear Strength Profile : The Bull/Bear Strength Profile helps traders understand the prevailing market sentiment at different price levels. By analyzing the dominance of buying or selling pressure, traders can align their trades with the market's direction or prepare for potential reversals.
Intraday Trading and Scalping : For intraday traders and scalpers, the time-weighted feature and the ability to adjust profile step size offer valuable insights. By emphasizing recent trading activity and adjusting the granularity of the profile, traders can make more informed decisions based on short-term price movements and volume changes.
Breakout Trading : By utilizing the LVN identification, traders can pinpoint areas with low trading activity that might serve as potential breakout points. This information can be instrumental in formulating strategies to capitalize on sudden price movements.
Volume Gap Analysis : PRVP++ can be used to identify volume gaps, which are areas with significantly low volume. These gaps can act as important indicators for price movements, as prices may move quickly through these levels due to the lack of historical trading activity.
Risk Management and Position Sizing : Understanding the volume profile can aid in better risk management and position sizing. By recognizing areas of high and low volume, traders can set stop-loss orders more effectively and adjust their position sizes according to the perceived strength of support or resistance levels.
Swing Trading : For swing traders, the comprehensive historical lookback and HVN/LVN analysis provide critical information about where to enter and exit trades. Swing traders can utilize these features to identify trend reversals and momentum shifts.
█ Best Practices and Tips
Start with a Clear Understanding : Before utilizing PRVP++, ensure you have a solid grasp of volume profile concepts. Understanding High Volume Nodes (HVNs), Low Volume Nodes (LVNs), and their implications on market behavior is crucial.
Combine with Other Analysis Tools : While PRVP++ is powerful, it's most effective when used in conjunction with other technical analysis tools and indicators. Combining volume profile data with price action analysis, trend lines, and technical indicators can provide a more comprehensive market view.
Customize According to Your Trading Style : Tailor the tool's settings to fit your trading strategy. Day traders might prefer a more detailed profile, while long-term investors may benefit from broader data analysis.
Pay Attention to HVNs and LVNs : HVNs can indicate potential support or resistance areas, while LVNs might suggest breakout points. Monitor these areas closely for trading opportunities.
Utilize the Full Historical Lookback Feature : For a broader perspective, use the full historical lookback feature to understand long-term volume patterns and their impact on current price movements.
Keep an Eye on Bull/Bear Strength : Use the Bull/Bear Strength Profile to gauge market sentiment at different price levels. This can help in predicting potential price movements.
Regularly Update Your Strategy : As market conditions change, regularly review and adjust your use of PRVP++ to ensure it aligns with current market dynamics.
Stay Informed About Market News : Be aware of how economic news and global events might affect the volume and price, as these factors can significantly impact the effectiveness of volume-based strategies.
█ Disclaimers and Risk Advice
No Guarantee of Profits : Trading involves risk, and the use of the PRVP++ tool does not guarantee profits. Always be aware of the potential for loss.
Educational Purposes Only : The information provided by PRVP++ is for educational purposes only and should not be considered financial advice.
Not a Standalone Tool : PRVP++ should not be used as a standalone decision-making tool. Combine it with comprehensive market analysis and personal judgment.
Past Performance Not Indicative of Future Results [/b: Historical data and trends analyzed by PRVP++ do not guarantee future market behavior.
Use Risk Management : Always employ sound risk management strategies, including setting stop-loss orders and managing position sizes to protect your capital.
Personal Responsibility : Trading decisions remain the responsibility of the individual trader. Use PRVP++ as one of several tools in your decision-making process.

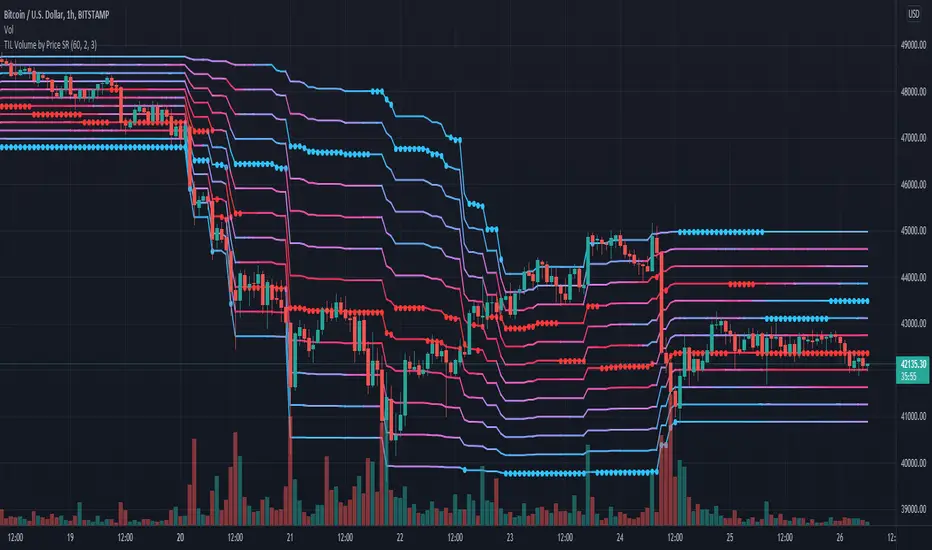
TIL Volume by Price SRTrading Indicator Lab's Volume by Price SR is a volume-based indicator for TradingView that reveals the strongest (and weakest) support and resistance levels in the chart among 12 price zones within a given period.
How It Works
The Volume by Price indicator uses a spectrum of blue to red colors to differentiate the strength of the volume within a price range for each bar. Think of it as a running volume profile with 12 price zones.
For each bar, the indicator calculates the rank of each price zone from the one that has the least number of volume to the highest within a given length of bars. Price zones that have less volume count are assigned colors that are closer to blue while price zones that have higher volume appear red. The indicator also marks the highest and lowest price levels in the rank with a red and blue dot which correspond to the same color code. The indicator repeats this in the next bar up to the last until it creates a stream of 12 lines that visually represent the gradual shift of volume strength in the price axis.
How to Use
The Volume by Price SR indicator is simple and can be used primarily to gauge support and resistance. Red lines represent price levels where there is a history of higher volume within the period, which also act as good support/resistance levels where price is more likely to be tested or bounce off.
As it can also be seen as a running volume profile indicator, the red and blue dots in each bar can be considered as high volume nodes (HVN) and low volume nodes (LVN) respectively. Though the calculation of the volume profile is continuous, the HVN and LVN dots can often appear consecutively or in a series within a single price level. The price tends to linger around or test lines that has the red dot (HVN). Meanwhile price rarely cross lines with the blue dot (LVN) or not spend as much time in these areas compared to other levels.
The height of the 12 price zones is determined by the difference between the highest high and lowest low of the period which can be useful in visualizing the chart's dynamic price range.
Inputs
- Length - sets the length of the period the indicator calculates for each bar
- Line Thickness - sets the thickness of the 12 lines all at once
- Dot Size - sets the size of the HVN and LVN dots
Single PrintsThis indicator plots Single Print levels when applied on the 30min time frame.
In the settings the user can change:
Level Colors
Level Width
Level Linestyle (Dotted, Dashed, Solid)
Toggle Retested Levels on/off
Toggle Profile Mode on/off
______________________________________________
Limitations:
1. Must be on 30min time frame. If you use other time frames to trade I recommend using a separate chart.
2. By default, retested levels are set to hide. For some tickers, the time/space between the creation of the Single Print, and the retest of that Single Print is too large. This causes errors due to a limitation from Tradingview. However, this limitation does not effect untested (naked) Single Prints. Naked Single Prints can be drawn accurately for any ticker without error, so that is the default setting.
______________________________________________
About Single Prints:
Single Prints come from Market Profile charting.
They represent a breakout from an old area of value to a newer area of value.
After a confirmed breakout from value, the extreme of the old area of value is the Single Print.
The level is often sensitive and can provide good trade locations especially on lower time frames.

Quantum Volume Point of Control (VPOC)Many forex traders are familiar with the concepts of volume price analysis as enshrined in Wyckoff’s three laws of effort and result, cause and effect and supply and demand. This is the linear relationship between volume and price. Now with the Volume Point of Control, this relationship is taken to the next level adding the concept of time and inspired by the ideas behind market profile.
The Quantum Volume Point of Control, or VPOC indicator blends ALL THREE of these important aspects of trading into a single powerful and visual indicator.
The Quantum VPOC indicator takes the analysis of volume and price to a higher level, which both complements and expands the VPA relationship. Whilst the Quantum tick volumes indicator considers the relationship between a single volume bar and its associated candle on the price time x-axis or groups of candles and volume bars, the Quantum VPOC indicator analyses the density and intensity of volume over time against price. In other words, the volume price relationship on the y axis. It does this in three distinct ways as follows:
First, the Quantum VPOC indicator constructs the Volume Profile from a set number of bars in history to the most current bar. The Volume Profile is then presented as a vertical histogram shown at the right edge of the chart – a stack of horizontal bars of varying lengths, but of equal height representing the amount of activity at each price level.
Second, the Quantum VPOC analyzes the Volume Profile to find the key price levels where activity is strong and rising, or weak and falling. In other words, the indicator looks for peaks (long bars) of the Volume Profile where price tends to be attracted as these are areas where price was previously accepted. These are called High Volume Nodes (HVN). The indicator also looks for troughs or valleys (short bars) of the Volume Profile where price tends to be repelled as these are areas where price was previously rejected. These are referred to as Low Volume Nodes (LVN). Both types of price level act as precise zones of support and resistance and as such are projected across the chart within the given period.
Third, the Quantum VPOC indicator looks for the Highest Volume Node or the highest peak in the Volume Profile and marks it as the Volume Point of Control – the price level which acts as the fulcrum from which price pivots. The indicator completes its calculations and updates as each new volume bar is delivered.
The result is a chart revealing the overarching influence of volume at price, coupled with time.
The Quantum VPOC indicator displays several key pieces of information on the chart as follows:
- Volume Profile – this appears as a histogram of volume on the vertical price axis on the right-hand side of the chart. The peaks and troughs are clearly displayed highlighting both High and Low Volume nodes.
- High volume node (HVN) – this is where we have a bulge in the volume profile generally because of an extended phase of price congestion. As a result, as the market approaches these regions on the chart price action is likely to become waterlogged with further congestion likely with the node acting as a strong area of support or resistance. As we have seen a strong acceptance of price at this level in the past, this is likely to be repeated with the market swinging in a range. Ultimately the market may reverse off these levels, with any move through then confirming the current sentiment.
- Low volume node (LVN) – this is where we see low volume in the volume profile. In these regions, the market has only paused temporarily – in other words a region where price has been rejected in the past. As such we are likely to see the market move quickly through these regions with little in the way of resistance or support acting to prevent a further advance of decline in price. The current sentiment is likely to continue and build quickly through these levels.
- Support and Resistance Zones – these are drawn at the High and Low Volume nodes to highlight the various HVN and LVN levels on the price axis.
- Volume Point of Control Line – this is drawn as a single line on the highest volume of the High Volume Node in the timeframe and clearly defines the tipping point of sentiment. This moves dynamically and represents the fulcrum of market sentiment where price has reached agreement, before moving on. If it is above the price action, then the current market sentiment is bearish. If it is below the current price action, then the current market sentiment is bullish. The VPOC Line reveals this balance simply, quickly, and clearly allowing you to judge market sentiment with accuracy and confidence.
As with all the Quantum Trading indicators, the VPOC indicator is dynamic, constantly changing and updating to reflect the relentless shift in sentiment as the market moves from bullish to bearish and back again. The indicator works in all timeframes and provides a powerful and much deeper understanding of support and resistance through the prism of volume and the associated High and Low Volume Nodes, with the Point of Control itself, acting as the fulcrum of the market.
