Buyer and Seller VWAPThis indicator calculates and visualizes Buyer and Seller Volume-Weighted Average Prices (VWAP) using a Least Squares Moving Average (LSMA) smoothing method. It classifies trades based on candle direction—buys when the close is above or equal to the open, and sells when the close is below the open.
The indicator applies LSMA to both buyer and seller VWAP values to reveal underlying trends with reduced noise. It also calculates a standard deviation band around each LSMA line, creating a shaded zone that represents volatility. This helps traders identify periods of expansion, contraction, and potential breakout opportunities based on buyer/seller strength.
M-VWAP

VPSRVP Sovereign Reign (VPSR) - Advanced Volume Profile Analysis
A sophisticated volume analysis tool that provides deep insights into market participation and momentum through an intuitive visual interface. This indicator helps traders identify significant market moves, potential reversals, and institutional activity.
Key Features:
1. Smart Volume Analysis
• Dynamic volume profiling
• Institutional participation detection
• Abnormal volume identification
• Real-time momentum tracking
2. Advanced Visual System
• Color-coded volume bars
• Adaptive cloud formation
• Reversal pattern detection
• Fake-out warning system
Visual Components:
1. Volume Bars
• Green: Bullish pressure with normal volume
• Purple: Bearish pressure with normal volume
• White: Significant bullish participation
• Pink: Significant bearish participation
• Orange: High-probability reversal zones
2. Dynamic Cloud
• White Cloud: Bullish control zone
• Purple Cloud: Bearish control zone
• Cloud density indicates participation strength
• Adaptive to market conditions
Signal Interpretation:
1. Normal Market Conditions
• Green/Purple bars show directional pressure
• Cloud color indicates dominant force
• Cloud height shows average participation
2. Significant Events
• White/Pink bars signal major moves
• Orange bars highlight potential reversals
• Cloud expansion shows increasing activity
• Cloud contraction indicates consolidation
Customization Options:
• Volume MA Length: Smoothing factor
• Abnormal Volume Threshold: Sensitivity
• Cloud Display: Toggle visualization
• Color scheme optimization
Best Practices:
1. Multiple Timeframe Analysis
• Start with higher timeframes
• Confirm on lower timeframes
• Watch for confluence
2. Volume Analysis
• Compare to historical levels
• Monitor abnormal spikes
• Track participation trends
3. Trade Management
• Use as confirmation tool
• Wait for clear signals
• Monitor fake-out warnings
• Combine with price action
Trading Applications:
1. Trend Analysis
• Identify strong moves
• Spot weakening trends
• Detect consolidation
2. Reversal Detection
• Spot potential turning points
• Identify fake-outs
• Monitor institutional activity
3. Risk Management
• Volume-based position sizing
• Stop loss placement
• Profit target selection
The VP Sovereign Reign indicator excels at:
• Identifying significant market moves
• Detecting institutional participation
• Warning of potential reversals
• Highlighting fake-outs
• Providing clear market context
Risk Warning:
This indicator is designed as a technical analysis tool and should be used as part of a complete trading strategy. Past performance does not guarantee future results. Always employ proper risk management techniques.
Note: For optimal results, use in conjunction with price action analysis and other complementary indicators.

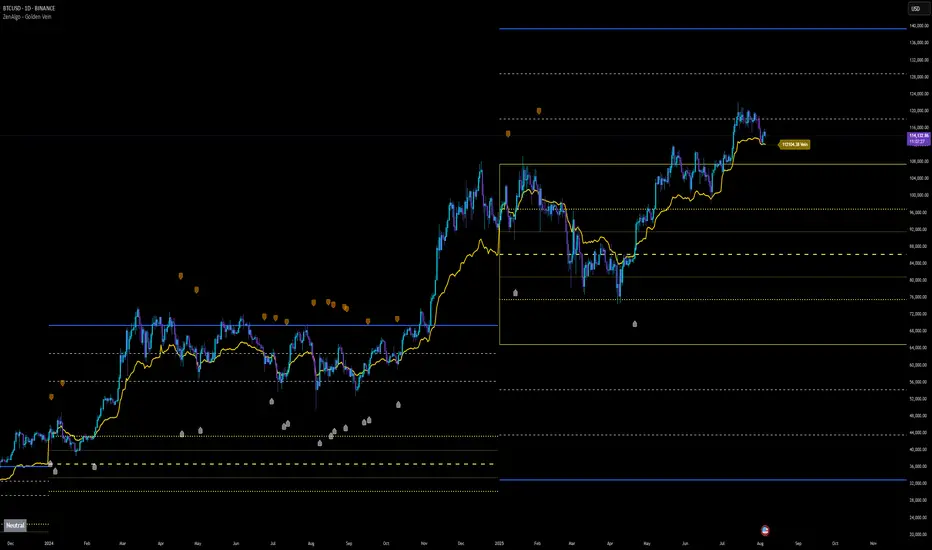
ZenAlgo - Golden VeinOverview and Motivation
This indicator combines multiple volume-weighted average price (VWAP) calculations from different timeframes and then merges them into a single composite line called “the Vein”. It begins by pulling a user-defined source (for instance, a typical price) and then anchors a VWAP on daily, weekly, monthly, quarterly, semiannual, and yearly intervals. By viewing all these timeframes together, the script captures multi-period trends in a way that stands apart from simpler, single-timeframe VWAP indicators. This comprehensive perspective is designed to offer practical benefits to those who monitor both short- and long-term VWAP behavior within a single tool.
Because it tracks many timeframes simultaneously, it can highlight instances when short-term and long-term VWAPs converge or diverge. Traders who need multi-timeframe validation may find this approach particularly helpful. Other free indicators typically restrict themselves to one or two timeframes, so the built-in multi-timeframe data in this script can save effort for those who rely heavily on VWAP analysis.
Core Inputs and Offsets
At the start, the script takes a single price input (e.g., the average of high, low, and close) and uses it to compute multiple VWAP lines. Users can also choose a distance factor (based on an ATR calculation) to control how far labels are placed from any crossover events. This distance sets how clearly the chart will display labels without overcrowding.
Beyond giving a cleaner visual, having a user-defined distance for labels means the script can adapt to any ticker’s volatility. If one trades assets with large intraday swings, the script leaves enough space for labels to remain readable. This flexibility is something that simpler free VWAP scripts might lack.
Multi-Timeframe VWAP Computations
The script calculates distinct VWAP lines: Daily, Weekly, Monthly, Quarterly (3-Month), Semiannual (6-Month), and Yearly (12-Month). Each line resets whenever it detects a new period has started, ensuring that each timeframe’s VWAP properly anchors to its own session window. This allows the indicator to track how the market perceives fair value (through VWAP) on multiple horizons, all at once.
Simultaneously checking these various intervals can offer added clarity to traders who want to compare immediate market conditions (e.g., daily) to broader contexts (e.g., quarterly or yearly). Tools that only show one or two timeframes may miss the nuances that arise when, say, daily VWAP aligns with monthly VWAP at a turning point.
Crossover Detection and Labeling
Whenever two different VWAP lines intersect, the script generates an internal crossover signal. It then draws small labels (e.g., D↑W or M↓Q) to highlight that a lower timeframe VWAP has moved above or below a higher timeframe VWAP. These labels use color-coding and an ATR-based offset to remain visible.
An additional subtle feature is how daily VWAP crossovers can optionally be displayed only on a specific weekday and hour. That allows users who only want to track daily crossovers under certain conditions (for example, a fixed point in the weekly cycle) to filter out other signals. This adaptability can be worth paying for if one needs advanced filtering—an area where simpler free VWAP cross indicators typically do not offer such granular control.
The “Golden VWAP” (Composite Calculation)
All six VWAP lines (daily, weekly, monthly, quarterly, semiannual, yearly) feed into a central average called “the Vein”. The script takes the midpoint of these six values on each bar, effectively combining short-, medium-, and long-term VWAP data into one. This composite serves as a reference line for overall market direction.
A volatility band (either a standard-deviation-based range or a user-defined percentage) wraps around this composite. The script thereby creates an upper and a lower boundary around the Golden VWAP, called “Resistance” and “Support.” Traders may interpret price moves beyond these levels as higher-probability expansions or contractions, but there is no guarantee of outcome. In choppier markets, breakouts above or below these bands might not lead to follow-through, so interpretation should always be combined with other evidence.
Simplified Market State Logic
By checking how price and the Golden VWAP behave from one bar to the next, the script tags the market state with labels like Bullish, Bearish, Super Bullish, or Super Bearish. These classifications hinge on whether the Golden VWAP is rising or falling, and whether price has crossed above or below the composite band. An optional table in the lower-left corner of the chart displays this label.
While such classification is convenient for scanning changing conditions quickly, it should be interpreted with caution. If the market is sideways or if volume patterns are erratic, the script can produce signals that do not align with real momentum. Treat these states as indications of potential bias rather than automatic buy or sell triggers.
Added Value
By gathering VWAP lines across multiple timeframes, generating alerts on all possible combinations of crossovers, and overlaying a composite VWAP with adjustable volatility bands, this script goes beyond typical single-timeframe VWAP indicators. It aims to let users track short-term shifts (e.g., daily crossing weekly) in the context of longer-term trends (e.g., yearly). This granularity and automation can reduce the need for multiple charts or manual recalculations of different VWAP windows.
Why It Can Be Worth Paying For
The capability to simultaneously anchor VWAP to multiple timeframes, detect crossovers, filter out daily signals by weekday/hour, and visualize a composite “Vein” with adjustable ranges represents a comprehensive feature set that free scripts often do not bundle together. For those who rely on multi-timeframe VWAP analysis, the time saved and clarity gained may justify a paid solution.
Interpreting Values
Crossover labels: Identify points where one timeframe’s VWAP moves above or below another. The direction (up or down) suggests potential momentum shifts.
Golden VWAP line: Treat it as the average “fair value” across all anchored periods. Large price moves above or below this line’s surrounding band might signal increased directional conviction—or false breakouts if volume is deceptive.
Market states: Use the Bullish/Super Bullish/Bearish/Super Bearish labels to gauge how price interacts with the composite’s slope and band.
How to Use It Best
Combine these signals with other risk-management methods.
Monitor multiple crossovers in tandem: for example, daily crossing weekly plus monthly crossing quarterly may offer stronger confluence.
Use the optional daily-label toggle to stay focused on selected higher-confidence signals if you find too many crossovers distracting.
Remember that every alert or label should be evaluated in broader market context and your own trading strategy.
Potential Shortcomings
As with any technical study, VWAP lines and crossovers are not foolproof predictors. The script can be less reliable in low-volume or fast-moving conditions. Large price shocks can cause abrupt changes that do not fit the typical patterns this indicator looks for.
In short, this script’s distinct advantage is showing multiple anchored VWAPs and a composite perspective in one place, offering fine control of alerts and appearance settings. Those who benefit most are chartists who want deeper VWAP insights across various timescales without juggling multiple separate indicators. However, like any technical tool, it should be understood as an aid rather than a guarantee of outcomes.
Pivot Levels with EMA Trend📌 Trend Change Levels with EMA Trend
✨ Description:
This TradingView script identifies clean trend change levels based on 1-hour structure shifts and filters them to keep only those not invalidated. It follows the "Jake Ricci" method, each level is printed at the beginning of the candle that changes the trend, on a 1 hour chart. For precision, make sure to exclude after/pre market and only use the levels on regular hours charts.
It includes dynamic EMAs (9, 50, 200), intraday VWAP, the daily open level printed, and a visual trend label based on EMA(9) slope.
Designed for intermediate traders, it helps build bias, manage entries, and avoid false setups by focusing on clean, reactive levels that the market respects.
🔧 Core Logic:
On the 1H chart, the script compares current and previous closes to detect trend direction. If the trend flips (e.g., up to down), the open of the candle that caused the flip becomes a candidate level.
Only levels that remain untouched by future candle closes are plotted — this filters out “weak” levels that price already violated (which means, a candle closes after passing through the level).
These levels become key S/R zones and often act as reaction points during pullbacks, traps, and liquidity sweeps.
The idea is to check how the price reacts to those levels. Usually there's a clean retest of the level. After that, if the price continues in that direction, it tends to reach the following level.
🔹 Included Tools:
🟣 Trend Change Levels (1H):
Fixed horizontal lines based on confirmed shifts in trend, shown only when not broken.
📉 EMAs (9 / 50 / 200):
Visibility can be set per timeframe. Use for trend context.
📍 EMA Trend Label:
Shows \"UP\", \"DOWN\", or \"RANGE\" based on EMA(9) slope.
🔵 VWAP (Intraday Reset):
Real-time volume-weighted average price that resets daily. Useful for fair value zones and reversion plays.
🟠 Daily Open Line:
Plot of the current day’s open. Used for intraday directional bias. Usually: DO NOT take longs below the Open Print, DO NOT take shorts above it.
📊 ATR Table:
Displays current ATR multiplier on the chart. It's useful to understand if the market is expanding or not.
📈 How to Use It (Strategy):
1. Start on the 1H chart to generate levels.
Only the open of candles that reversed trend are considered — and only if future candles didn’t close through them. I suggest manually adding horizontal lines to mark again the levels, so that they stick to all the timeframes.
2. Use the trend label to decide your bias — \"UP\" for long setups, \"DOWN\" for shorts. Avoid trading against the slope.
3. Switch to the 5m chart and wait for price to approach a plotted level. These are often used for manipulation, retests, or clean reversals.
4. Look for confirmation: rejection candles, break-and-retest, strong engulfing candles, or traps above/below the level. ALWAYS check the price action around the level, along with the volume.
5. Check if VWAP or an EMA is near the level. If yes, the confluence strengthens the trade idea.
6. Use the ATR value to understand if the market is expanding (candles are bigger than the ATR). You don't want to stay in a slow and ranging trade.
✅ Example Entry Flow:
1. On the 1H chart, note a trend change level printed recently.
2. Check the current trend label — if it says \"UP,\" prefer longs.
3. Wait for price to retrace toward the level.
4. On the 5m, look for a bullish engulfing candle or trap setup at the level.
5. Check if VWAP and EMA(50) are near. If yes, execute the trade.
6. Set stop just under the low of the candle prior to your entry. Ideally, a retracing candle.
To be clear: imaging to be LONG, you wait for a retracement that should touch your level. You wait for a candle that resumes the LONG trend, enter when it breaks the high of the previous candle (sill in retracement), you place your stop under the candle prior to your entry.
Notes:
No repainting — levels only show up after confirmed shifts.
Removes broken levels for chart clarity and reliability.
Helps spot high-probability pullback zones and fakeouts.
Perfect confluence tool to support price action, SMC, or EMA strategies.
Works across multiple timeframes with customizable inputs.
👤 Ideal For:
Intraday traders looking for reactive entry points and direction confirmation.
Swing traders wanting to pinpoint continuation zones or reversal pivots.
🚨 Final Note: This indicator doesn’t generate buy/sell signals. It improves your trade filtering by identifying areas the market already respected and reacting to them with price action. Combine it with your own system , test it in replay, and use screenshots to document setups.
📌 If used with discipline, this becomes a precision tool — not a signal generator.

VWAP + EMA Retracement Indicator SwiftEdgeVWAP + EMA Retracement Indicator
Overview
The VWAP + EMA Retracement Indicator is a powerful and visually engaging tool designed to help traders identify high-probability buy and sell opportunities in trending markets. By combining the Volume Weighted Average Price (VWAP) with two Exponential Moving Averages (EMAs) and a unique retracement-based signal logic, this indicator pinpoints moments when the price pulls back to a key zone before resuming its trend. Its modern, AI-inspired visuals and customizable features make it both intuitive and adaptable for traders of all levels.
What It Does
This indicator generates buy and sell signals based on a sophisticated yet straightforward strategy:
Buy Signals: Triggered when the price is above VWAP, has recently retraced to the zone between two EMAs (default 12 and 21 periods), and a strong bullish candle closes above both EMAs.
Sell Signals: Triggered when the price is below VWAP, has retraced to the EMA zone, and a strong bearish candle closes below both EMAs.
Signal Filtering: A customizable cooldown period ensures that only the first signal in a sequence is shown, reducing noise while preserving opportunities for new trends.
Confidence Scores: Each signal includes an AI-inspired confidence score (0-100%), calculated from candle strength and price distance to VWAP, helping traders gauge signal reliability.
The indicator’s visuals enhance decision-making with dynamic gradient lines, a highlighted retracement zone, and clear signal labels, all customizable to suit your preferences.
How It Works
The indicator integrates several components that work together to create a cohesive trading tool:
VWAP: Acts as a dynamic support/resistance level, reflecting the average price weighted by volume. It filters signals to ensure buys occur in uptrends (price above VWAP) and sells in downtrends (price below VWAP).
Dual EMAs: Two EMAs (default 12 and 21 periods) define a retracement zone where the price is likely to consolidate before continuing its trend. Signals are generated only after the price exits this zone with conviction.
Retracement Logic: The indicator looks for price pullbacks to the EMA zone within a user-defined lookback window (default 5 candles), ensuring signals align with trend continuation patterns.
Candle Strength: Signals require strong candles (bullish for buys, bearish for sells) with a minimum body size based on the Average True Range (ATR), filtering out weak or indecisive moves.
Cooldown Mechanism: A unique feature that prevents signal clutter by allowing only the first signal within a user-defined period (default 3 candles), balancing responsiveness with clarity.
Confidence Score: Combines candle body size and price distance to VWAP to assign a score, giving traders an at-a-glance measure of signal strength without needing external analysis.
These components are carefully combined to capture high-probability setups while minimizing false signals, making the indicator suitable for both short-term and swing trading.
How to Use It
Add to Chart: Apply the indicator to a 15-minute chart (recommended) or your preferred timeframe.
Customize Settings:
VWAP Source: Choose the price source (default: hlc3).
EMA Periods: Adjust the fast and slow EMA periods (default: 12 and 21).
Retracement Window: Set how many candles to look back for retracement (default: 5).
ATR Period & Body Size: Define candle strength requirements (default: 14 ATR period, 0.3 multiplier).
Cooldown Period: Control the minimum candles between signals (default: 3; set to 0 to disable).
Candle Requirements: Toggle whether signals require bullish/bearish candles or entire candle above/below EMAs.
Visuals: Enable/disable gradient colors, retracement zone, confidence scores, and choose a color scheme (Neon, Light, or Dark).
Interpret Signals:
Buy: A green "Buy" label with a confidence score appears below the candle when conditions are met.
Sell: A red "Sell" label with a confidence score appears above the candle.
Use the confidence score to prioritize higher-probability signals (e.g., above 80%).
Trade Management: Combine signals with your risk management strategy, such as setting stop-loss below the retracement zone and targeting a 1:2 risk-reward ratio.
Why It’s Unique
The VWAP + EMA Retracement Indicator stands out due to its thoughtful integration of classic indicators with modern enhancements:
Balanced Signal Filtering: The cooldown mechanism ensures clarity without missing key opportunities, unlike many indicators that overwhelm with frequent signals.
AI-Inspired Confidence: The confidence score simplifies decision-making by quantifying signal strength, mimicking advanced analytical tools in an accessible way.
Elegant Visuals: Dynamic gradients, a highlighted retracement zone, and customizable color schemes (Neon, Light, Dark) create a sleek, futuristic interface that’s both functional and visually appealing.
Flexibility: Extensive customization options let traders tailor the indicator to their style, from conservative swing trading to aggressive scalping.

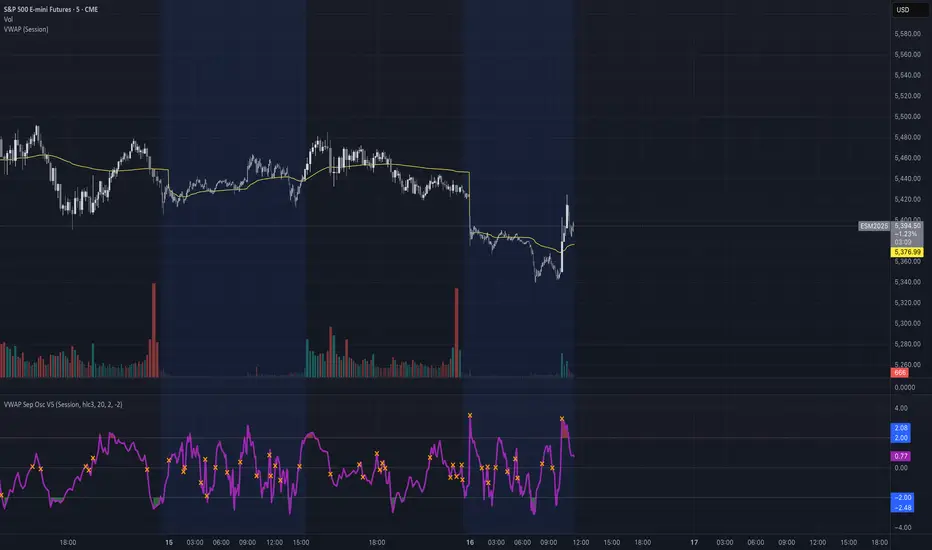
VWAP Separation Oscillator V5 (No Arrows)Okay, here is a draft description you can adapt for your TradingView publication. It starts from the basics and explains the concepts behind the indicator and how to interpret its visual elements.
VWAP Separation Oscillator
Summary
This indicator provides a normalized view of how far the current price has deviated from its Volume-Weighted Average Price (VWAP), helping traders identify potentially overbought or oversold conditions relative to recent VWAP dynamics. It calculates the price separation from VWAP and expresses it in terms of standard deviations (a Z-score), making it easier to gauge the statistical significance of the deviation.
Core Concepts Explained
What is VWAP?
VWAP stands for Volume-Weighted Average Price. It's a trading benchmark calculated by taking the total dollar value traded for every transaction (price multiplied by volume) and dividing it by the total shares traded for the day (or other chosen period).
Unlike a simple moving average, VWAP gives more weight to price levels where more volume occurred. Many institutional traders use it as a reference point for execution quality.
This indicator allows you to choose the "Anchor Period" (Session, Week, Month, etc.) which determines when the VWAP calculation resets.
What is VWAP Separation?
P
rice doesn't always stay at the VWAP; it naturally fluctuates above and below it.
"VWAP Separation" is simply the difference between the current price (Source) and the calculated VWAP value (Separation = Price - VWAP). A positive separation means the price is above VWAP; negative means below.
How Standard Deviation is Used:
While knowing the separation is useful, its significance can vary wildly between different stocks or market conditions. A $1 separation might be huge for one stock but tiny for another.
Standard Deviation is a statistical measure of how spread out data points are from their average. In this indicator, we calculate the standard deviation of the VWAP Separation over a specified Lookback Length. This tells us how volatile or dispersed the separation has been recently.
The Oscillator Line (Z-Score):
The main purple (or Green/Red) line plotted by this indicator is the Z-score of the VWAP Separation.
Formula conceptually: Oscillator Value = (Current Separation - Average Separation) / Standard Deviation of Separation
Interpretation: It tells you how many standard deviations the current separation is away from the average separation over the lookback period.
A value of +2.0 means the current separation is 2 standard deviations higher (more extended to the upside) than the average separation.
A value of -1.5 means the current separation is 1.5 standard deviations lower (more extended to the downside) than the average separation.
This normalization makes it easier to compare readings across different assets or timeframes and to define consistent thresholds for "extreme" deviations.
Visual Elements Explained
Oscillator Line: The primary line showing the Z-score value (explained above). Can optionally be colored Green/Red based on its slope (rising/falling).
Overbought Line (Solid Red): A user-defined level (default: 2.0). When the oscillator moves above this line, it suggests the price deviation above VWAP is statistically significant compared to recent history.
Oversold Line (Solid Green): A user-defined level (default: -2.0). When the oscillator moves below this line, it suggests the price deviation below VWAP is statistically significant compared to recent history.
Overbought/Oversold Zone Fills (Transparent Red/Green): These shaded areas appear only when the oscillator line enters the respective Overbought or Oversold territory (defined by the OB/OS Lines), visually highlighting these periods.
Zero Line (Dotted Gray): Represents the point where the current VWAP separation is exactly equal to the average VWAP separation over the lookback period. Crossings indicate shifts relative to this mean.
Zero Cross Markers (Orange 'X'): Small 'x' marks plotted directly on the oscillator line whenever it crosses the Zero Line, pinpointing these moments.
Potential Usage / Interpretation
Identifying Extremes: High positive values (above OB Level) or low negative values (below OS Level) can suggest the price move relative to VWAP might be over-extended and potentially due for a pause or pullback. Look for the oscillator turning back from these extremes.
Spotting Divergences: Look for discrepancies between price action and the oscillator.
Bearish Divergence: Price makes a new high, but the oscillator makes a lower high (often in the OB zone). Suggests weakening upside momentum relative to VWAP dynamics.
Bullish Divergence: Price makes a new low, but the oscillator makes a higher low (often in the OS zone). Suggests weakening downside momentum relative to VWAP dynamics.
Context is Key: This oscillator measures deviation from a specific benchmark (VWAP). Its interpretation should always be done within the context of the overall market trend, price structure (support/resistance), volume analysis, and potentially other confirming indicators.
Disclaimer: This indicator is a tool for analysis, not a standalone trading system. It does not provide financial advice. Always use risk management.
Settings Overview
Anchor Period: Determines how often the VWAP calculation resets (Session, Week, Month, etc.).
Source: The price data used for the separation calculation (default: hlc3).
Lookback Length: The number of bars used to calculate the average and standard deviation of the separation, influencing the oscillator's responsiveness.
Overbought/Oversold Levels: User-defined thresholds for identifying extreme Z-score values.
Color Oscillator Line: Option to color the oscillator line based on whether it's rising or falling.
Anchored VWAP Pro (Final Visibility Enhanced)This is a fully customizable Anchored VWAP (Volume Weighted Average Price) indicator designed for traders who prioritize precision, clarity, and macro trend analysis.
Unlike traditional VWAPs tied to daily or session data, this version allows you to manually anchor the VWAP to any candle in history—ideal for macro swing trading, cycle lows, breakouts, and reaccumulation phases.
Features:
• Manual Anchor Date: Set the exact year, month, and day for your VWAP to begin
• Custom Price Source: Choose between HLC3, close, or any OHLC-based input
• VWAP Bands: Two standard deviation bands for identifying overextension or fair value zones
• Full Visual Control:
• Toggle each band on/off individually
• Adjust color, line width, and line style (solid, dotted, dashed)
• Built for Clarity: Designed to stand out on both light and dark charts
This script is ideal for:
• Identifying macro confluence zones
• Defining risk during trend pullbacks
• Confirming breakout legitimacy
• Layering with other tools like Market Cipher, VRVP, and Fib levels
Inspired by the work of LonesomeTheBlue, Algokid, and other pros—this is a cleaner, more flexible and updated alternative for precision trading.
Script created and published by @ImmortalEmerson
For advanced swing traders, crypto analysts, and macro trend specialists.
VWAP 2.0 with desv + Initial Balance by RiotWolftrading🌟 Overview
This powerful tool is designed for traders who want to harness the power of the Volume Weighted Average Price (VWAP) alongside session-based ranges to make informed trading decisions. Whether you're a day trader or a swing trader, this indicator provides a clean and effective way to identify support, resistance, and market trends—all in one place! 💡
✨ Key Features
Auto-Anchored VWAP 📊
Automatically calculates the VWAP based on a user-defined anchor period (e.g., Daily, Weekly, Monthly).
Resets at the start of each period (e.g., daily for a Daily anchor).
Displays a customizable VWAP line with standard deviation bands to highlight key price levels.
Standard Deviation Bands 📏
Plots up to three sets of standard deviation bands above and below the VWAP (multipliers: 1.0, 2.0, 3.0).
Includes volume percentage labels to show where trading volume is concentrated. 📉
Session High/Low Range 🕒
Identifies the high and low prices within a customizable session (default: 12:00 to 15:31).
Draws horizontal lines at the session high and low, with dotted deviation lines for additional reference points.
Perfect for spotting key levels during your trading session! 🔑
Time-Based Range Box ⏰
Highlights a specific time window (default: 15:40 to 15:50) with a colored box showing the high and low prices.
Ideal for tracking price action during high-impact events like news releases or market opens. 📅
Alerts 🚨
Set up alerts for when the price crosses above or below the VWAP—never miss a potential trading opportunity!
⚙️ Settings
Customize the indicator to fit your trading style with these easy-to-use settings:
VWAP Settings
Timezone 🌍: Select your timezone (default: GMT+2) to align calculations with your local time.
VWAP Source 📈: Choose the price source for VWAP (default: hlc3 - average of high, low, close).
Std Deviation Multipliers 📐: Adjust the multipliers for the bands (default: 1.0, 2.0, 3.0).
Line Width ✏️: Set the thickness of the VWAP and band lines (default: 1).
Session Time ⏳: Define the session window for VWAP calculations (default: 08:00-18:00, all days).
Show Upper/Lower Bands 👀: Toggle visibility for each set of bands (default: Band 1 visible, Bands 2 & 3 hidden).
Range Settings
Range Start/End Time 🕙: Set the time window for the range box (default: 15:40 to 15:50).
Box Color 🎨: Customize the border color (default: blue).
Box Background Color 🖌️: Adjust the background color (default: light aqua, 90% transparency).
I created this indicator to provide a streamlined, clutter-free tool for traders who rely on VWAP and session-based analysis. It focuses on the essentials—VWAP, standard deviation bands, session high/low, and range box—without unnecessary overlays. I hope it helps you in your trading journey! If you have feedback or suggestions, feel free to share—I’d love to hear from you! 😊

Auto Anchored VWAPs for FuturesAbout the Script
This indicator automatically plots five anchored VWAPs based on predefined starting times, offering traders key reference points across multiple timeframes. These starting points are hardcoded and cannot be customized, ensuring consistency across all time zones. Below are the anchored VWAPs and their respective starting times:
NY Session: Starts daily at 9:30 AM EST
Globex: Starts daily at 6:00 PM EST
Weekly: Resets every Sunday at 6:00 PM EST
Monthly: Anchored to the first session of the month at 6:00 PM EST
Yearly: Anchored to the first session of the year at 6:00 PM EST
How to Use the Script
1) Add the script to your chart.
2) Select the appropriate Daylight Savings Time format.
3) Customize the visual appearance to your preference.
4) Click "OK" to apply the changes.
Once configured, the VWAP levels will automatically adjust based on the predefined timeframes.
How the Script Works
The script calculates and plots anchored VWAPs at the predefined starting times listed above. As each session, week, month, and year progresses, the corresponding VWAP is recalculated and updated on the chart, providing traders with dynamic insights into market trends and volume-weighted price action.

ScalpSwing Pro SetupScript Overview
This script is a multi-tool setup designed for both scalping (1m–5m) and swing trading (1H–4H–Daily). It combines the power of trend-following , momentum , and mean-reversion tools:
What’s Included in the Script
1. EMA Indicators (20, 50, 200)
- EMA 20 (blue) : Short-term trend
- EMA 50 (orange) : Medium-term trend
- EMA 200 (red) : Long-term trend
- Use:
- EMA 20 crossing above 50 → bullish trend
- EMA 20 crossing below 50 → bearish trend
- Price above 200 EMA = uptrend bias
2. VWAP (Volume Weighted Average Price)
- Shows the average price weighted by volume
- Best used in intraday (1m to 15m timeframes)
- Use:
- Price bouncing from VWAP = reversion trade
- Price far from VWAP = likely pullback incoming
3. RSI (14) + Key Levels
- Shows momentum and overbought/oversold zones
- Levels:
- 70 = Overbought (potential sell)
- 30 = Oversold (potential buy)
- 50 = Trend confirmation
- Use:
- RSI 30–50 in uptrend = dip buying zone
- RSI 70–50 in downtrend = pullback selling zone
4. MACD Crossovers
- Standard MACD with histogram & cross alerts
- Shows trend momentum shifts
- Green triangle = Bullish MACD crossover
- Red triangle = Bearish MACD crossover
- Use:
- Confirm swing trades with MACD crossover
- Combine with RSI divergence
5. Buy & Sell Signal Logic
BUY SIGNAL triggers when:
- EMA 20 crosses above EMA 50
- RSI is between 50 and 70 (momentum bullish, not overbought)
SELL SIGNAL triggers when:
- EMA 20 crosses below EMA 50
- RSI is between 30 and 50 (bearish momentum, not oversold)
These signals appear as:
- BUY : Green label below the candle
- SELL : Red label above the candle
How to Trade with It
For Scalping (1m–5m) :
- Focus on EMA crosses near VWAP
- Confirm with RSI between 50–70 (buy) or 50–30 (sell)
- Use MACD triangle as added confluence
For Swing (1H–4H–Daily) :
- Look for EMA 20–50 cross + price above EMA 200
- Confirm trend with MACD and RSI
- Trade breakout or pullback depending on structure

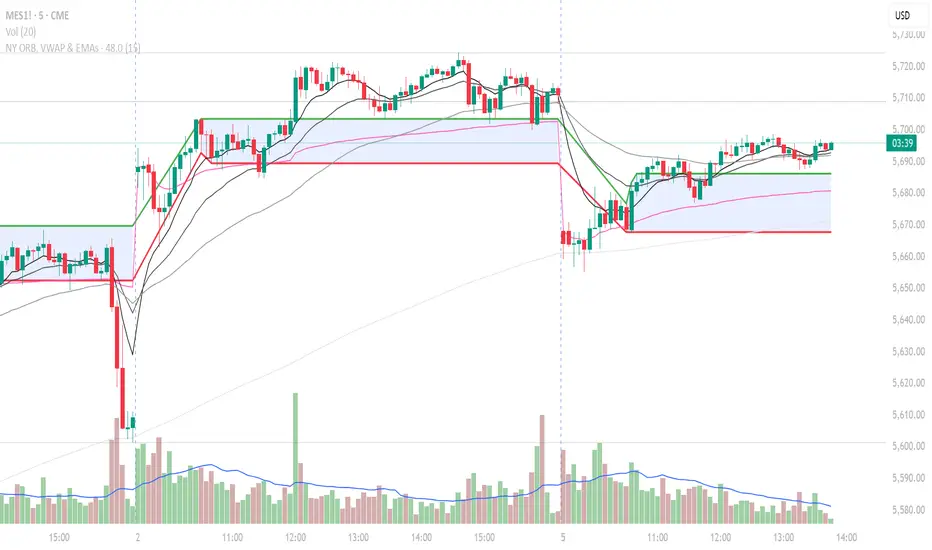
NY ORB, VWAP & EMAsIndicator is designed to display key technical analysis tools on your Trading View chart. It includes:
One of the key benefits of this indicator is that it allows Basic Trading View users to set VWAP, EMAs, and ORB in a single indicator. This is particularly useful for users who are limited to a single indicator on their Basic plan, as it provides a comprehensive view of market sentiment, trend, and potential breakouts without the need for multiple indicators.
Features
New York Opening Range Breakout (ORB): Plots the high and low of the first 15 minutes (configurable) of the New York trading session.
Volume Weighted Average Price (VWAP): Displays the VWAP line, which can be toggled on or off.
Exponential Moving Averages (EMAs): Plots four EMAs (9, 21, 50, and 200 periods), which can also be toggled on or off.
Customization
ORB Length: Choose from 5 or 15 minutes for the ORB calculation.
Show VWAP and EMAs: Toggle the visibility of the VWAP and EMA lines on or off.
Usage
This indicator is designed to help traders identify key market levels, trends, and potential breakouts during the New York trading session. The ORB can be used to gauge market sentiment, while the VWAP provides a benchmark for average price action. The EMAs offer additional trend analysis and can be used to identify potential support and resistance levels.
Multi-Timeframe Anchored VWAP Valuation# Multi-Timeframe Anchored VWAP Valuation
## Overview
This indicator provides a unique perspective on potential price valuation by comparing the current price to the Volume Weighted Average Price (VWAP) anchored to the start of multiple timeframes: Weekly, Monthly, Quarterly, and Yearly. It synthesizes these comparisons into a single oscillator value, helping traders gauge if the current price is potentially extended relative to significant volume-weighted levels.
## Core Concept & Calculation
1. **Anchored VWAP:** The script calculates the VWAP separately for the current Week, Month, Quarter (3 Months), and Year (12 Months), starting the calculation from the first bar of each period.
2. **Price Deviation:** It measures how far the current `close` price is from each of these anchored VWAPs. This distance is measured in terms of standard deviations calculated *within* that specific anchor period (e.g., how many weekly standard deviations the price is away from the weekly VWAP).
3. **Deviation Score (Multiplier):** Based on this standard deviation distance, a score is assigned. The further the price is from the VWAP (in terms of standard deviations), the higher the absolute score. The indicator uses linear interpolation to determine scores between the standard deviation levels (defaulted at 1, 2, and 3 standard deviations corresponding to scores of +/-2, +/-3, +/-4, with a score of 1 at the VWAP).
4. **Timeframe Weighting:** Longer timeframes are considered more significant. The deviation scores are multiplied by fixed scalars: Weekly (x1), Monthly (x2), Quarterly (x3), Yearly (x4).
5. **Final Valuation Metric:** The weighted scores from all four timeframes are summed up to produce the final oscillator value plotted in the indicator pane.
## How to Interpret and Use
* **Histogram (Indicator Pane):**
* The main output is the histogram representing the `Final Valuation Metric`.
* **Positive Values:** Suggest the price is generally trading above its volume-weighted averages across the timeframes, potentially indicating strength or relative "overvaluation."
* **Negative Values:** Suggest the price is generally trading below its volume-weighted averages, potentially indicating weakness or relative "undervaluation."
* **Values Near Zero:** Indicate the price is relatively close to its volume-weighted averages.
* **Histogram Color:**
* The color of the histogram bars provides context based on the metric's *own recent history*.
* **Green (Positive Color):** The metric is currently *above* its recent average plus a standard deviation band (dynamic upper threshold). This highlights potentially significant "overvalued" readings relative to its normal range.
* **Red (Negative Color):** The metric is currently *below* its recent average minus a standard deviation band (dynamic lower threshold). This highlights potentially significant "undervalued" readings relative to its normal range.
* **Gray (Neutral Color):** The metric is within its typical recent range (between the dynamic upper and lower thresholds).
* **Orange Line:** Plots the moving average of the `Final Valuation Metric` itself (based on the "Threshold Lookback Period"), serving as the centerline for the dynamic thresholds.
* **On-Chart Table:**
* Provides a detailed breakdown for transparency.
* Shows the calculated VWAP, the raw deviation multiplier score, and the final weighted (adjusted) metric for each individual timeframe (W, M, Q, Y).
* Displays the current price, the final combined metric value, and a textual interpretation ("Overvalued", "Undervalued", "Neutral") based on the dynamic thresholds.
## Potential Use Cases
* Identifying potential exhaustion points when the indicator reaches statistically high (green) or low (red) levels relative to its recent history.
* Assessing whether price trends are supported by underlying volume-weighted average prices across multiple timeframes.
* Can be used alongside other technical analysis tools for confirmation.
## Settings
* **Calculation Settings:**
* `STDEV Level 1`: Adjusts the 1st standard deviation level (default 1.0).
* `STDEV Level 2`: Adjusts the 2nd standard deviation level (default 2.0).
* `STDEV Level 3`: Adjusts the 3rd standard deviation level (default 3.0).
* **Interpretation Settings:**
* `Threshold Lookback Period`: Defines the number of bars used to calculate the average and standard deviation of the final metric for dynamic thresholds (default 200).
* `Threshold StDev Multiplier`: Controls how many standard deviations above/below the metric's average are used to set the "Overvalued"/"Undervalued" thresholds (default 1.0).
* **Table Settings:** Customize the position and colors of the data table displayed on the chart.
## Important Considerations
* This indicator measures price deviation relative to *anchored* VWAPs and its *own historical range*. It is not a standalone trading system.
* The interpretation of "Overvalued" and "Undervalued" is relative to the indicator's logic and calculations; it does not guarantee future price movement.
* Like all indicators, past performance is not indicative of future results. Use this tool as part of a comprehensive analysis and risk management strategy.
* The anchored VWAP and Standard Deviation values reset at the beginning of each respective period (Week, Month, Quarter, Year).

VWAP StrategyVWAP and volatility filters for structured intraday trades.
How the Strategy Works
1. VWAP Anchored to Session
VWAP is calculated from the start of each trading day.
Standard deviations are used to create bands above/below the VWAP.
2. Entry Triggers: Al Brooks H1/H2 and L1/L2
H1/H2 (Long Entry): Opens below 2nd lower deviation, closes above it.
L1/L2 (Short Entry): Opens above 2nd upper deviation, closes below it.
3. Volatility Filter (ATR)
Skips trades when deviation bands are too tight (< 3 ATRs).
4. Stop Loss
Based on the signal bar’s high/low ± stop buffer.
Longs: signalBarLow - stopBuffer
Shorts: signalBarHigh + stopBuffer
5. Take Profit / Exit Target
Exit logic is customizable per side:
VWAP, Deviation Band, or None
6. Safety Exit
Exits early if X consecutive bars go against the trade.
Longs: X red bars
Shorts: X green bars
Explanation of Strategy Inputs
- Stop Buffer: Distance from signal bar for stop-loss.
- Long/Short Exit Rule: VWAP, Deviation Band, or None
- Long/Short Target Deviation: Standard deviation for target exit.
- Enable Safety Exit: Toggle emergency exit.
- Opposing Bars: Number of opposing candles before safety exit.
- Allow Long/Short Trades: Enable or disable entry side.
- Show VWAP/Entry Bands: Toggle visual aids.
- Highlight Low Vol Zones: Orange shading for low volatility skips.
Tuning Tips
- Stop buffer: Use 1–5 points.
- Target deviation: Start with VWAP. In strong trends use 2nd deviation and turn off the counter-trend entry.
- Safety exit: 3 bars recommended.
- Disable short/long side to focus on one type of reversal.
Backtest Setup Suggestions
- initial_capital = 2000
- default_qty_value = 1 (fixed contracts or percent-of-equity)

Multi-TF Volume & Price Analysis[BullByte]This indicator offers a comprehensive view of market dynamics by combining volume and price analysis across multiple timeframes. It calculates key metrics—such as bullish/bearish volume percentages, relative volume (RVol), cumulative volume delta (CVD), and price change percentages—for each timeframe that you choose (for example, 1, 3, 5, and 15 minutes). Here are the main features in simple terms:
- Multi-Timeframe Analysis:
The tool analyzes volume and price action from four different timeframes simultaneously. This means you get insights from short-term and slightly longer-term trends in one view.
- Volume Breakdown:
It splits the volume into bullish and bearish parts by comparing closing and opening prices. This helps you see how much of the trading volume is driving the market upward versus downward.
- Relative Volume & Spike Detection:
It calculates relative volume (current volume compared to a moving average) and flags any significant volume spikes based on a customizable multiplier. This feature helps identify unusual trading activity.
- Volume Smoothing Option:
For a cleaner signal, you can enable a smoothing option (using an exponential moving average) to reduce noise in the volume data.
- Advanced Summary:
The indicator combines volume data, price changes, and volume spikes to produce an overall market summary for each timeframe—labeling conditions as “Bullish Strong,” “Bullish Moderate,” “Bearish Strong,” “Bearish Moderate,” or “Neutral.”
- Cumulative Overview:
In addition to individual timeframe analysis, it aggregates the data to offer a cumulative view. This includes a collective bullish/bearish percentage, overall CVD, and even a simplified volume level (Low, Normal, or High).
- Customizable Dashboard:
All these metrics are neatly displayed in a dashboard on the chart. You can customize its position and text size. The dashboard uses dynamic, color-coded cells to instantly convey the market sentiment—making it easy to spot trends at a glance.
- VWAP Integration:
Finally, the dashboard includes VWAP information, providing an additional layer of context to the price action.
Overall, this indicator is designed to provide a quick yet thorough snapshot of market conditions, enabling traders to make more informed decisions with a clear visual representation of volume and price activity across different timeframes.

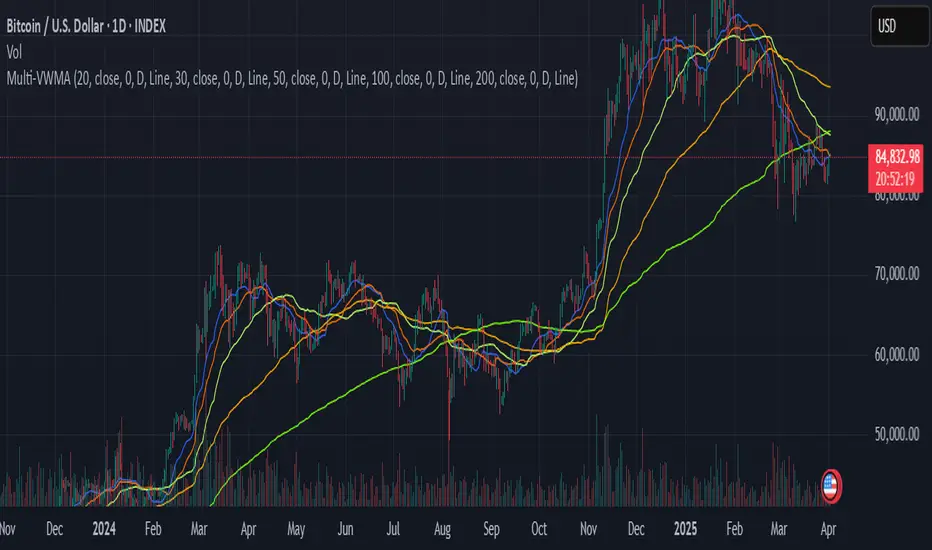
Multiple VWMATradingView Indicator: Multiple VWMA
This TradingView indicator allows you to display up to five separate Volume Weighted Moving Averages (VWMAs) directly on your price chart.
What it does:
Plots 5 VWMAs: It calculates and draws five distinct VWMA lines (or other styles) on the chart.
Volume Weighting: Unlike simple moving averages, a VWMA gives more weight to prices where trading volume was higher, potentially offering a clearer picture of the trend strength confirmed by volume.
Highly Customizable: Each of the five VWMAs can be configured independently through the indicator's settings panel. For each one, you can set:
Length: The lookback period (number of bars) used for the calculation.
Source: The price data to use (e.g., close, open, high, low, hl2, etc.).
Timeframe: You can calculate each VWMA based on a different timeframe than the one currently displayed on your chart (e.g., view daily VWMAs on an hourly chart). Leave blank to use the chart's timeframe.
Offset: Shift the VWMA line forwards or backwards on the chart by a specific number of bars.
Style: Choose how each VWMA is displayed (Line, Histogram, or Cross).
Overlay: The VWMAs are plotted directly over the price bars for easy comparison.
Purpose:
This indicator is useful for traders who want to analyze trends using multiple volume-weighted perspectives simultaneously. By comparing VWMAs of different lengths or based on different timeframes, you can gain insights into short-term vs. long-term trends, potential support/resistance levels, and the significance of price movements based on accompanying volume.
ATR from VWAP📌 ATRs from VWAP – Intraday Volatility Tracker
This script measures how far price is from VWAP in ATR units, helping traders assess short-term overextension and reversion potential.
🔹 Key Features:
✅ ATR Distance from VWAP – Calculates how many ATRs the price is from the VWAP.
✅ Dynamic Table Display – Shows ATR distance in real-time for quick decision-making.
✅ Intraday Focus – Designed for scalpers and day traders using minutes or hourly timeframes.
📊 How to Use:
Look for price moving away from VWAP to identify extended moves.
Use as a reversion signal when price deviates too far from VWAP.

Multi-Period Rolling VWAPMulti-Period Rolling VWAP (MP-RVWAP)
This indicator plots multiple Rolling Volume-Weighted Average Price (RVWAP) lines over different time periods (7, 14, 30, 60, 90, 180, and 360 days) on a single chart. Each RVWAP is calculated using a user-defined timeframe and source (default: HLC3), ensuring consistency across chart resolutions.
Key Features:
Customizable Periods: Toggle visibility for each period (7d, 14d, 30d, 60d, 90d, 180d, 360d) and adjust their colors.
Labels: Each RVWAP line is labeled at the end (e.g., "7d", "360d") for easy identification.
Standard Deviation Bands: Optional bands can be added above and below each RVWAP, with customizable multipliers (set to 0 to hide).
Flexible Timeframe: Define a single timeframe (default: 1D) for all RVWAP calculations, independent of the chart’s timeframe.
Minimum Bars: Set a minimum number of bars (default: 10) to ensure reliable calculations.
Usage:
Ideal for traders analyzing price trends across multiple time horizons. Enable/disable specific RVWAPs, tweak colors, and add bands to suit your strategy.

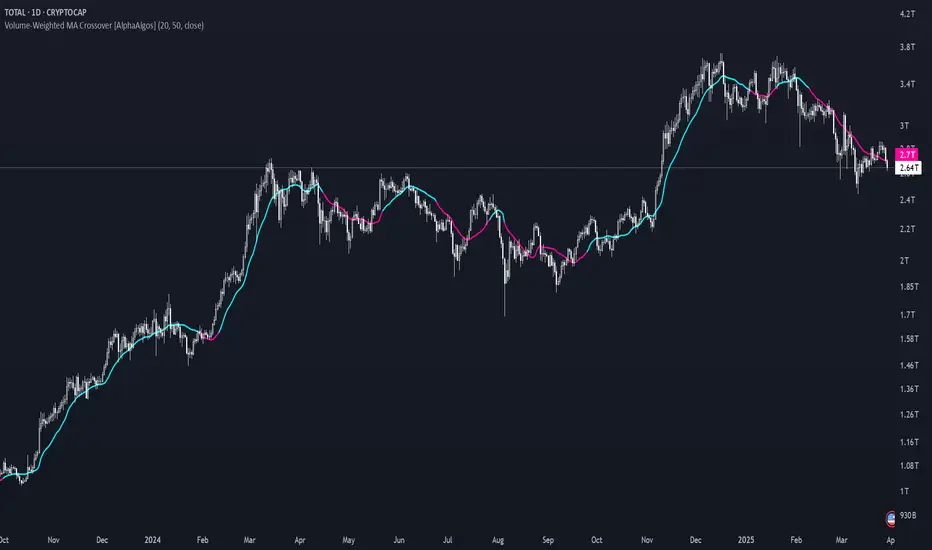
Volume-Weighted MA Crossover [AlphaAlgos]Volume-Weighted MA Crossover
Overview:
The Volume-Weighted MA Crossover is a sophisticated trend-following indicator designed to capture reliable trend reversals and trend continuation signals using volume and price action. By combining the power of Volume-Weighted Moving Averages (VWMA) and the simplicity of Simple Moving Averages (SMA) , this indicator provides a more robust and reliable trend filter. It ensures that trend signals are supported by strong market volume, offering a deeper insight into market strength and potential price movements.
How It Works:
The Volume-Weighted MA Crossover indicator calculates a Volume-Weighted Moving Average (VWMA) of the chosen price source (typically close ), which takes into account both the price and volume of each bar. This ensures that price movements with higher volume are weighted more heavily, providing a better reflection of actual market sentiment.
In conjunction with the VWMA, a traditional Simple Moving Average (SMA) is used to filter out noise and smooth price data, providing a more stable trend direction. The crossover between the VWMA and SMA serves as the primary trading signal:
Long Signal (Bullish Crossover) : The VWMA crosses above the SMA, indicating that a strong bullish trend is likely underway, supported by increased volume and price action.
Short Signal (Bearish Crossover) : The VWMA crosses below the SMA, signaling that a bearish trend is emerging, backed by decreasing volume and price reversal.
The Volume-Weighted MA Crossover can be used as a standalone indicator or in conjunction with other tools to enhance your trading strategy, offering both trend-following and volume confirmation.
Key Features:
Volume Sensitivity : The VWMA adjusts the moving average based on volume, providing a more accurate representation of price action during high-volume periods. This makes the indicator more sensitive to market dynamics, ensuring that price movements during significant volume spikes are prioritized.
Trend Confirmation : The crossover of the VWMA and SMA offers clear and actionable signals, helping traders identify trend reversals early and with more confidence.
Clean Signal Presentation : With color-coded signal markers , this indicator makes it easy to spot actionable entry points.
Customizable Settings : Tailor the VWMA and SMA periods, volume multiplier, and source price according to your preferred market conditions and timeframes, allowing the indicator to fit your trading style.
How to Use It:
Trend Direction : Look for crossovers between the VWMA and SMA to identify potential trend changes:
Volume Confirmation : The volume-weighted aspect of this indicator ensures that trends are confirmed by volume. A bullish trend with a VWMA crossing above the SMA suggests that the upward movement is supported by strong market sentiment (high volume). Conversely, a bearish trend with a VWMA crossing below the SMA indicates a reversal is supported by volume reduction.
Trend Continuation & Reversal : This indicator works particularly well during strong trending markets. However, it can also identify potential reversals, particularly during periods of high volume and rapid price changes.
Best Timeframe to Use:
This indicator is adaptable to multiple timeframes and can be used across various market types. However, it tends to work most effectively on medium to long-term charts (such as 1-hour, 4-hour, and daily charts) where trends have the potential to develop more clearly and with more volume participation.
Ideal for:
Trend-following traders looking for reliable signals that are confirmed by both price action and volume.
Swing traders who want to enter trades at the beginning of a new trend or after a confirmed trend reversal.
Day traders seeking clear and easy-to-read signals on intra-day charts, helping to pinpoint optimal entry and exit points during volatile market conditions.
Conclusion:
The Volume-Weighted MA Crossover is an essential tool for any trader looking to improve their trend-following strategy. By incorporating both volume and price action into a VWMA and SMA crossover , it offers a more refined approach to identifying and confirming trends. Whether you're a trend follower , swing trader , or day trader , this indicator provides clear, actionable signals backed by volume confirmation, giving you the confidence to execute your trades with precision.
VWAPv6The VWAP ( Volume Weighted Average Price ) Deviation script is a powerful tool designed for traders to analyze the relationship between price and volume . By calculating deviations around the VWAP , the script allows users to identify key support and resistance levels that can help in making better-informed trading decisions.
The script calculates VWAP based on the chosen data source (default is closing price) and then computes deviations above and below the VWAP using either the Average Deviation or the Standard Deviation method. The user can select the desired method through the script's input options. These deviations are then plotted as bands on the chart, providing a visual representation of the areas where the price may potentially revert or experience a breakout.
A unique and valuable feature of this script is the addition of a monitor that counts the number of times the price crosses above the Upper Deviation level 2 and below the Lower Deviation level 2 within a user-defined lookback period. This monitor is displayed as a table in the bottom right corner of the chart and can be enabled or disabled through an input option.
The cross count monitor serves as a valuable aid to traders by providing insights into the historical frequency of price crossing the deviation levels. This information can be used to identify potential trading opportunities based on historical price behavior around these levels.

VWAP anchored with Previous VWAPVWAP with Persistent Previous VWAP Levels
🔹 Overview
This indicator calculates and displays Daily, Weekly, and Monthly VWAP (Volume Weighted Average Price) along with their previous period VWAP levels, helping traders analyze key price points used by institutional players. Unlike traditional VWAP indicators that reset at the start of each period, this script extends the previous VWAP levels across the current period, providing strong reference points for support and resistance.
🔹 Key Features
✅ Multiple Timeframe VWAPs – Displays Daily, Weekly, and Monthly VWAPs for better trend analysis.
✅ Persistent Previous VWAPs – Keeps and extends previous period VWAP levels as horizontal lines.
✅ Customizable Appearance – Modify colors, line widths, and visibility of each VWAP level.
✅ VWAP Labels – Optional labels for quick reference to VWAP and previous VWAP values.
✅ Efficient Calculation – Optimized for smooth performance on all chart timeframes.
🔹 How It Works
VWAP Calculation
Uses hlc3 (high + low + close) / 3 as the default VWAP price source.
Accumulates price-volume data within each time period (day, week, or month).
Previous VWAP Line Extension
When a new period begins, the final VWAP value of the previous period is stored.
A horizontal line is drawn at this level and extends across the current period.
Customizable Display
Enable/disable Daily, Weekly, and Monthly VWAPs independently.
Choose colors for VWAP and Previous VWAP lines.
Toggle labels for better visibility.
🔹 Why Use This Indicator?
📌 Identify Institutional Trading Zones – VWAP is widely used by hedge funds, banks, and algorithmic traders.
📌 Detect Key Support & Resistance Levels – Previous VWAP levels act as dynamic support and resistance.
📌 Improve Trade Entries & Exits – Use VWAP bounces and breaks for confirmation.
📌 Works on All Timeframes – Useful for scalpers, swing traders, and long-term investors.
🔹 Best Use Cases
📍 Trend Confirmation – Price above VWAP suggests an uptrend; below VWAP indicates a downtrend.
📍 Support & Resistance Trading – Use previous VWAP levels as key reaction zones.
📍 Breakout & Mean Reversion Strategies – Combine with price action for high-probability trades.
📢 Try it out and elevate your trading strategy with institutional-grade VWAP levels! 🚀

VWAP Balance Zones - SessionsVWAP Balance Zones Sessions Version is an alternate take on the Original VWAP Balance Zones indicator. The Sessions version allows users to select a specific session to view the VWAP Balance Zones at while still utilizing the full ETH Data.
The Session version provides a better focused display while still maintaining the core functions of the original script with mindful optimizations.
Author's Note: "VBZ Sessions was made with logistics in mind, for the users who only trade within certain times of the day. While it displays the same core concepts, it is not as "Raw" of a display as the Original. For this reason, some users may prefer the Original VWAP Balance Zones, which is why I have opted to release this alternate version instead of updating the original."
> What are VWAP Balance Zones?
"VWAP Balance Zones" is an original concept aimed at identifying the equilibrium area between market participants within the current trend by averaging the Daily Extremes and the Daily VWAP.
Refer to the illustration below for a better understanding of exactly how VWAP Balance Zones are formed:
These zones are displayed for the Daily, Weekly, and Monthly VWAPs, with the most interactive timeframe being the Daily.
> Features
1. The Session Version uses ETH data at all times, and does not solely rely on the chart's data to create the VWAPs or Zones.
This allows the user to focus on a specific trading session, while not losing out on the full VBZ Calculation, with the notable benefit of a cleaner display.
The Original VBZ starts drawing at the beginning of the chart's "Day", and would produce different results when using an RTH chart vs an ETH chart. Along with creating a bird's nest of unusable data at the beginning of the day.
2. Session Start and End lines are displayed for easier identification of the designated trading session.
3. The extreme "Close" Lines are no longer displayed to reduce noise and redundancy.
4. Additionally, the interior VWAP lines are no longer displayed. Ultimately, this was to reduce noise and focus the script on the 50% zones.
5. Weekly and Monthly Zones are now displayed due to the reduced noise!
6. As with the original, the weekly display will yield to the daily, and the monthly display will yield to the weekly.
In the screenshot below, you can observe this behavior.
Enjoy!

Multiple AVWAP [OmegaTools]The Multiple AVWAP indicator is a sophisticated trading tool designed for professional traders who require precision in volume-weighted price tracking. This indicator allows for the deployment of multiple Anchored Volume Weighted Average Price (AVWAP) calculations simultaneously, offering deep insights into price movements, dynamic support and resistance levels, and trend structures across multiple timeframes.
This indicator caters to both institutional and retail traders by integrating flexible anchoring methods, multi-timeframe adaptability, and enhanced visualization features. It also includes deviation bands for statistical analysis, making it a comprehensive volume-based trading solution.
Key Features & Functionalities
1. Multiple AVWAP Configurations
Users can configure up to four distinct AVWAP calculations to track different market conditions.
Supports various anchoring methods:
Fixed: A traditional AVWAP that starts from a defined historical point.
Perpetual: A rolling VWAP that continuously adjusts over time.
Extension: An extension-based AVWAP that projects from past calculations.
High Volume: Anchors AVWAP to the highest volume bar within a specified period.
None: Option to disable AVWAP calculation if not required.
2. Advanced Deviation Bands
Implements standard deviation bands (1st and 2nd deviation) to provide a statistical measure of price dispersion from the AVWAP.
Serves as a dynamic method for identifying overbought and oversold conditions relative to VWAP pricing.
Deviation bands are customizable in terms of visibility, color, and transparency.
3. Multi-Timeframe Support
Users can assign different timeframes to each AVWAP calculation for macro and micro analysis.
Helps in identifying long-term institutional trading levels alongside short-term intraday trends.
4. Z-Score Normalization Mode
Option to standardize oscillator values based on AVWAP deviations.
Converts price movements into a statistical Z-score, allowing traders to measure price strength in a normalized range.
Helps in detecting extreme price dislocations and mean-reversion opportunities.
5. Customizable Visual & Aesthetic Settings
Fully customizable line colors, transparency, and thickness to enhance clarity.
Users can modify AVWAP and deviation band colors to distinguish between different levels.
Configurable display options to match personal trading preferences.
6. Oscillator Mode for Trend & Momentum Analysis
The indicator converts price deviations into an oscillator format, displaying AVWAP strength and weakness dynamically.
This provides traders with a momentum-based perspective on volume-weighted price movements.
User Guide & Implementation
1. Configuring AVWAPs for Optimal Use
Choose the mode for each AVWAP instance:
Fixed (set historical point)
Perpetual (rolling, continuously updated AVWAP)
Extension (projection from past AVWAP levels)
High Volume (anchored to highest volume bar)
None (disables the AVWAP line)
Adjust the length settings to fine-tune calculation sensitivity.
2. Utilizing Deviation Bands for Market Context
Activate deviation bands to see statistical boundaries of price action.
Monitor +1 / -1 and +2 / -2 standard deviation levels for extended price movements.
Consider price action outside of deviation bands as potential mean-reversion signals.
3. Multi-Timeframe Analysis for Institutional-Level Insights
Assign different timeframes to each AVWAP to compare:
Daily VWAP (institutional trading levels)
Weekly VWAP (swing trading trends)
Intraday VWAPs (short-term momentum shifts)
Helps identify where institutional liquidity is positioned relative to price.
4. Activating the Oscillator for Momentum & Bias Confirmation
The oscillator converts AVWAP deviations into a normalized value.
Use overbought/oversold levels to determine strength and potential reversals.
Combine with other indicators (RSI, MACD) for confluence-based trading decisions.
Trading Applications & Strategies
5. Trend Confirmation & Institutional VWAP Tracking
If price consistently holds above the primary AVWAP, it signals a bullish trend.
If price remains below AVWAP, it indicates selling pressure and a bearish trend.
Monitor retests of AVWAP levels for potential trend continuation or reversal.
6. Dynamic Support & Resistance Levels
AVWAP lines act as dynamic floating support and resistance zones.
Price bouncing off AVWAP suggests continuation, whereas breakdowns indicate a shift in momentum.
Look for confluence with high-volume zones for stronger trade signals.
7. Mean Reversion & Statistical Edge Trading
Prices that deviate beyond +2 or -2 standard deviations often revert toward AVWAP.
Mean reversion traders can fade extended moves and target AVWAP re-tests.
Helps in identifying exhaustion points in trending markets.
8. Institutional Liquidity & Volume Footprints
Institutions often execute large trades near VWAP zones, causing price reactions.
Tracking multi-timeframe AVWAP levels allows traders to anticipate key liquidity areas.
Use higher timeframe AVWAPs as macro support/resistance for swing trading setups.
9. Enhancing Momentum Trading with AVWAP Oscillator
The oscillator provides a momentum-based measure of AVWAP deviations.
Helps in confirming entry and exit timing for trend-following trades.
Useful for pairing with stochastic oscillators, MACD, or RSI to validate trade decisions.
Best Practices & Trading Tips
Use in Conjunction with Volume Analysis: Combine with volume profiles, OBV, or CVD for increased accuracy.
Adjust Timeframes Based on Trading Style: Scalpers can focus on short-term AVWAP, while swing traders benefit from weekly/daily AVWAP tracking.
Backtest Different AVWAP Configurations: Experiment with different anchoring methods and lookback periods to optimize trade performance.
Monitor Institutional Order Flow: Identify key VWAP zones where institutional traders may be active.
Use with Other Technical Indicators: Enhance trading confidence by integrating with moving averages, Bollinger Bands, or Fibonacci retracements.
Final Thoughts & Disclaimer
The Multiple AVWAP indicator provides a comprehensive approach to volume-weighted price tracking, making it ideal for professional traders. While this tool enhances market clarity and trade decision-making, it should be used as part of a well-rounded trading strategy with risk management principles in place.
This indicator is provided for informational and educational purposes only. Trading involves risk, and past performance is not indicative of future results. Always conduct your own analysis and due diligence before executing trades.
OmegaTools - Enhancing Market Clarity with Precision Indicators

AVWAP CurvesThis indicator calculates and displays Anchored Volume-Weighted Average Price (AVWAP) for the 15-minute, 1-hour, and 4-hour timeframes. It helps identify volume-weighted support/resistance levels and trends based on volume and price data.
Multiple Timeframes: Displays AVWAP curves for 15m, 1h, and 4h. Users can toggle visibility for each timeframe.
Price Anchor Selection: Choose between Low, High, or HL2 as the price anchor for the AVWAP calculation.
Custom Date & Time Anchor: Set a specific start time for the AVWAP calculation.
Alerts: Alerts are triggered when the price crosses above or below any AVWAP curve.
