Global Liquidity IndexThe Global Liquidity Index offers a consolidated view of all major central bank balance sheets from around the world. For consistency and ease of comparison, all values are converted to USD using their relevant forex rates and are expressed in trillions. The indicator incorporates specific US accounts such as the Treasury General Account (TGA) and Reverse Repurchase Agreements (RRP), both of which are subtracted from the Federal Reserve's balance sheet to give a more nuanced view of US liquidity. Users have the flexibility to enable or disable specific central banks and special accounts based on their preference. Only central banks that both don’t engage in currency pegging and have reliable data available from late 2007 onwards are included in this aggregated liquidity model.
Global Liquidity Index = Federal Reserve System (FED) - Treasury General Account (TGA) - Reverse Repurchase Agreements (RRP) + European Central Bank (ECB) + People's Bank of China (PBC) + Bank of Japan (BOJ) + Bank of England (BOE) + Bank of Canada (BOC) + Reserve Bank of Australia (RBA) + Reserve Bank of India (RBI) + Swiss National Bank (SNB) + Central Bank of the Russian Federation (CBR) + Central Bank of Brazil (BCB) + Bank of Korea (BOK) + Reserve Bank of New Zealand (RBNZ) + Sweden's Central Bank (Riksbank) + Central Bank of Malaysia (BNM).
This tool is beneficial for anyone seeking to get a snapshot of global liquidity to interpret macroeconomic trends. By examining these balance sheets, users can deduce policy trajectories and evaluate the global economic climate. It also offers insights into asset pricing and assists investors in making informed capital allocation decisions. Historically, riskier assets, such as small caps and cryptocurrencies, have typically performed well during periods of rising liquidity. Thus, it may be prudent for investors to avoid additional risk unless there's a consistent upward trend in global liquidity.
M2

Global (World) Monetary Supply M2 (measured in USD)This is the Global Monetary Supply M2 of the richest and most populous countries that have info from at least 2008
It is measured in USD (converting the M2 of each of the countries respective currencies and virtually converting them into USD)
This is less than the global liquidity as it does not include the countries' assets in other currencies (on their balance sheets), it only focuses on the monetary supply of each of the countries own currencies.

Global Monetary Supply M2 Vs the Global GDP This indicator compares the Global (world) Monetary Supply (measured in USD) compared to the Global GDP.
This can be useful to measure the "money printing speed" of the world compare to the "world gdp growth", the higher the slope (angle of growth) the more money printing.
It includes the exact same countries of the Global M2 indicator (done by me), to make fair the comparison, which has the richest and most populous countries so to have a clear overview.
There tough a few very populated countries excluded, the details can be found on the Global M2 indicator script and reason for exclusion.
Enjoy!

Recession Warning Traffic LightThis is an indicator that uses 6 different metrics to determine the combined probability of a recession and compares the high probability warning periods against actual historical periods of recession.
GREEN tells us that the referenced recession indicators are not exhibiting any warning. Observe the long stretches of “all-green” in between recessionary periods in the chart above.
RED will show a full-on warning level for that particular recession indicator, signaling that monitoring of this sector is clearly showing a problem – which has in the past, reliably exhibited itself as a forewarning of recessions.
Adding green and red together can help determine a combined probability of recession.
IMPORTANT: Your chart should be on 1d and set to SPX , DJI ,or NDQ indices
Precious metals: This indicator calculates the relative prices of Gold & rhodium. Gold is a flight-to-quality asset. Rhodium is the rarest of precious industrial metals and prices spike when the economy is heating up. In front of a recession, the upper relative movement of rhodium precedes gold.
Stock markets: This indicator compares closing prices to growth rate curves of the SPX. This indication is the noisiest but tells us very well when the recession has ended. Stock market indices, which respond to “smart money” moving out of markets when the other indicators begin to warn of recession, or when markets become overheated and rise to historically unsustainable levels.
Yield curve: This indicator compares the 3m & 10y treasuries and detects yield curve inversions. Interest rates are controlled by the Federal Reserve and by the purchasers in the Federal Treasury auction markets, which together create the treasury yield curve. This inversion is the most reliable recession indicator. These happen during a flight to quality.
Federal Reserve: This indicator measures GDP and detects contraction which is technically a recession. This is usually one of the last indicators to enter a Warning state, and it could be 6 months delayed simply confirming what may have already been projected.
Money Supply. This indicator measures the M2 money supply, which typically grows about 1% per calendar quarter. When this shrinks, it's tapping the brakes on the economy. This can also lead to yield curve inversion. This is also a measure of inflation and its effects on the aggregate money supply (liquid capital) available for short-term economic activity, or which can be directed into the purchase of long-term, less liquid assets.
Leading Economic factors: There is a whole basket of leading economic indicators that, as collections, reflect overall growth or contraction of economic activity. These indicators include measures of level and growth in productivity, employment, housing, consumer confidence, industrial purchasing confidence, and much more. These indicators may or may not be detached from the broader economy, and often provide up to 6 months of foresight. For more information please visit www.conference-board.org
Actual Recession: Central Bank indicators are published by the Federal Reserve and reflect their own analysis of national and regional economic health, as well as their calculations of the likelihood of a recession. The Federal Reserve has a recession ticker which is used to plot periods of actual recessions on this indicator for comparison.

Annualizer: New Indicator + CPI AnalysisThis indicator calculates the annualized month-over-month percent change of a cumulative index and plots it alongside the year-over-year percent change for comparison. It was developed for the purpose of analyzing the inflation rate of CPI indexes such as “CPIAUCSL.” It can also be used on M2 money supply and pretty much any cumulative index. It will not produce useful outputs on percent change indexes such as “USCCPI” because it performs percent change calculations which are already applied to those indexes.
This indicator takes data from the monthly chart, regardless of how often the data is reported or what the timeframe of the current chart is. Doing so allows it to work on all timeframes while displaying only monthly data outputs but limits it from recognizing data which might be released more often than once per month. This limitation should be suitable for macroeconomic data such as CPI and M2 money supply which are usually analyzed on a month-to-month basis.
If the ticker symbol is "M2SL" which is M2 money supply, annualized percent change is plotted in green, otherwise, it’s plotted in blue.
CPI analysis:
Upon deploying this indicator, it was observed that the year-over-year (YoY) inflation rate (red) is a lagging indicator of the annualized month-over-month (MoM) inflation rate (blue) and that it appears to almost be a moving average of it. A moving average plot was temporarily added for comparison to the YoY and it was found that the difference between the two plots is negligible and that for the purposes of high-level analysis of inflation, the two plots can be considered to be no different from one another. Below is a screenshot for demonstration. Notice how closely the white 12-month SMA of the annualized rate tracks the YoY rate.
For other indexes which may see more dramatic changes month-over-month such as M2 money supply, the difference between the two signals becomes more pronounced but they are still comparable. The conclusion is that the YoY inflation rate can be considered to be a 12-month simple moving average of the annualized MoM rate.
12-month SMA:
It’s easy to see and stands to reason that if the annualized MoM inflation rate (blue) remains where it has been for the previous 2 months YoY inflation (red) will begin falling and eventually reach similar levels due to its moving-average-like behavior. This will bring us back to the 2% YoY inflation target of the Fed within no more than 10 months. There may be a perception that deflation is required to bring prices back down to the purple channel of CPI to make prices pre-Covid "normal" again. We were headed in that direction in July with a slightly negative MoM CPI read. What may have freaked investors out about the August report (most recent as of this writing) is that the inflation rate, rather than continuing into negative deflationary territory, has bounced back into positive territory.
M2 money supply isn’t an integral part of this analysis, but it helps demonstrate the indicator. It can be observed that CPI growth lags M2 money supply growth which seems to have leveled off.
I’m not a macroeconomist so I’m probably missing some things, but I do not see a lagging indicator such as YoY inflation being at 8.25% while annualized MoM inflation is at 1.42% as something to freak out about as investors have seemingly done. I’m a stock market bear as of last week, but I do not feel this CPI analysis strongly supports a bearish thesis, nor is it bullish. Next month’s annualized MoM % change may begin to sway me one way or the other depending on what this chart looks like when it’s updated.

Inflation Adjusted Performance: Ticker/M2 money supplyPlots current ticker / M2 money supply, to give an idea of 'inflation adjusted performance'.
~In the above, see the last decade of bullish equities is not nearly as impressive as it seems when adjusted to account for the FED's money printing.
~Works on all timeframes/ assets; though M2 money supply is daily data release, so not meaningful to plot this on timeframe lower than daily.
~To display on same pane; comment-out line 6 and un-comment line 7; then save, remove and re-add indicator.
~Scale on the right is meaningless; this indicator is just to show/compare the shape of the charts.

Money Velocity Population Adjusted (MVPA)MVPA=GDPPC/( M2 /POP). An adaptation to normal Money Velocity, taking into account populations for more volatile plots/different perspective. Major world economy's money supply velocity. Compare how each country's monetary policy has played out and current trajectory in comparison to others. The velocity of money is a measure of the number of times that the average unit of currency is used to purchase goods and services within a given time period. The concept relates the size of economic activity to a given money supply, and the speed of money exchange is one of the variables that determine inflation .

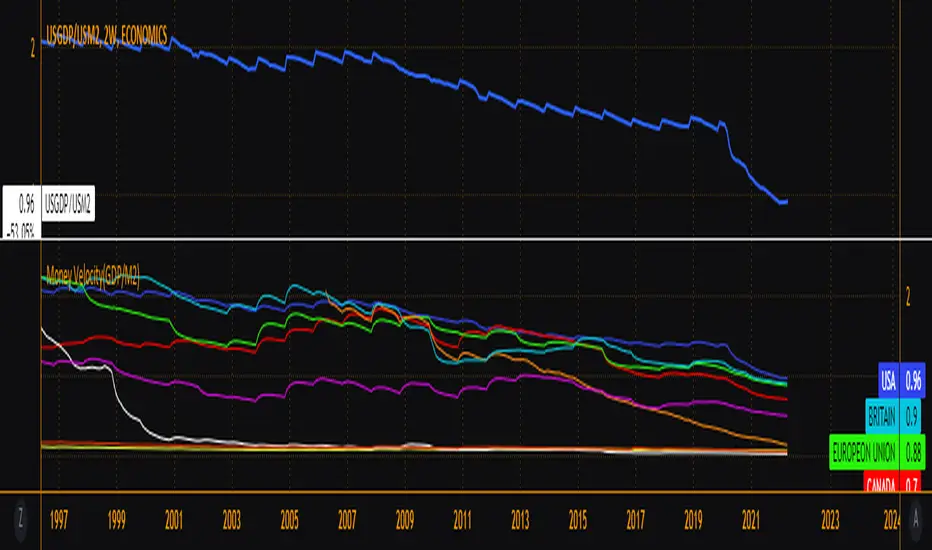
Money Velocity(GDP/M2)V=GDP/M2
Major world economy's money supply velocity. Compare how each country's monetary policy has played out and current trajectory in comparison to others. The velocity of money is a measure of the number of times that the average unit of currency is used to purchase goods and services within a given time period. The concept relates the size of economic activity to a given money supply, and the speed of money exchange is one of the variables that determine inflation.
gold price levels denominated in usd/gramsPlots the gold price (USD) for the quantities (grams) identified as support or resistance in the indicator settings. Default values are:
75 gold grams
300 gold grams
500 gold grams
1000 gold grams
5000 gold grams
More context: The purchasing power of Bitcoin

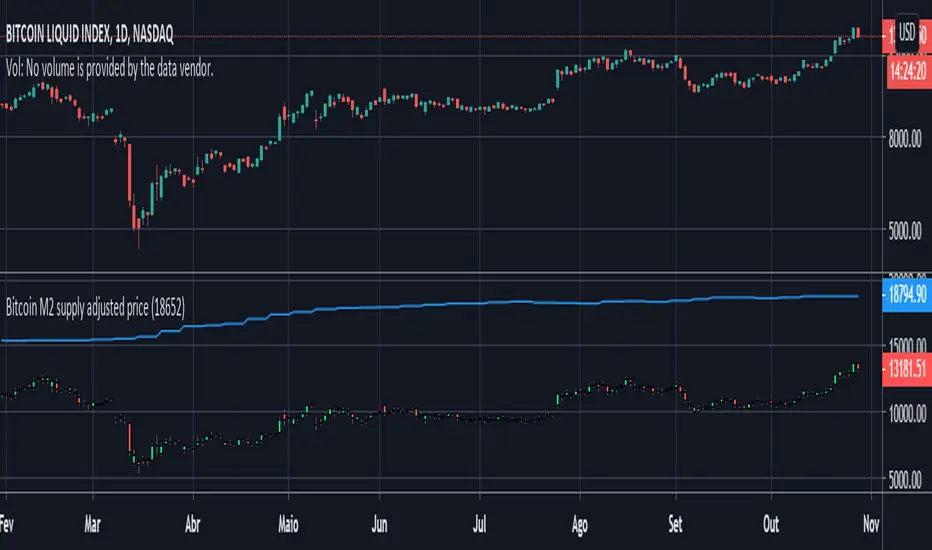
Bitcoin M2 supply adjusted priceThis script plots bitcoin candles adjusted by M2 supply (blue line), helping the trader to obtain insight of new support/resistance levels adjusted by M2 supply.
Note: As it was not possible to make the price adjust automatically by the last M2 value (pinescript limitation, I guess), the input parameter "M2Last" must be updated manually observing the last M2 value in blue curve.