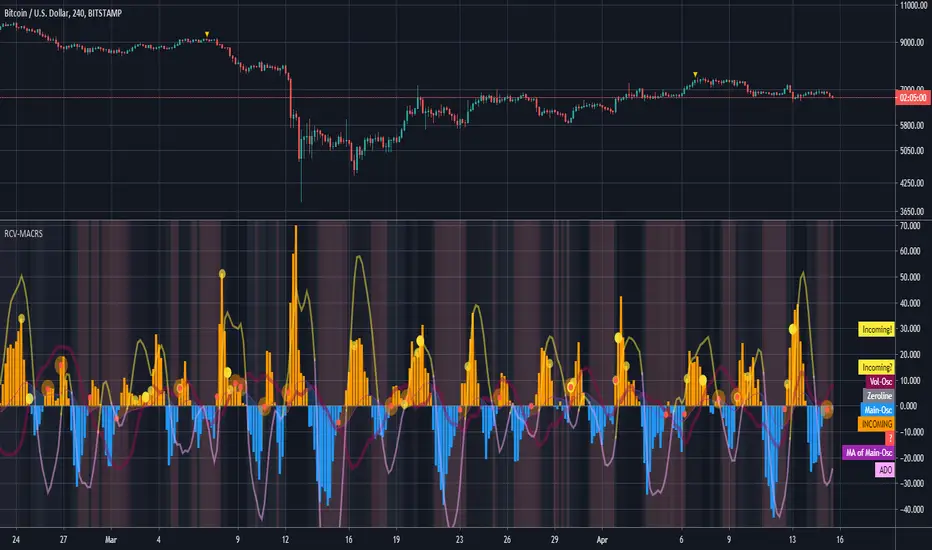
RCV-MACRSThe main oscillator (orange/blue) histogram is the RCV-MACRS (Relative Candle Volatility driven MACD modulated RSI) -- basically a sensitive indicator of volatility trends.
The yellow/lavender colored oscillator is a proprietary asymmetric differential oscillator (ADO) which is modulated by the main oscillator. When this (thinner line) secondary oscillator is > 0, it is yellow; and when it is < 0, it is lavender. The user can select the order of the differential (i.e. Order 1 = Momentum, Order 2 = Acceleration, Order 3 = Jerk, Order 4 = Snap, Order 5 = Crackle, Order 6 = Pop). This oscillator provides details of the more subtle underlying/hidden trends that is emerging or brewing, and may hint of an incoming move ahead of time. Divergence in the sign and slope of this secondary oscillator with respect to the main oscillator may provide a useful edge for trade setup.
A (thick transparent maroon) volume-momentum oscillator is also provided (which can be switch to the volume oscillator in the settings).
A cluster of circle markers may indicate a significant price swing incoming.
The red background-highlights indicate periods of low volume and volatility.
平滑異同移動平均線(MACD)
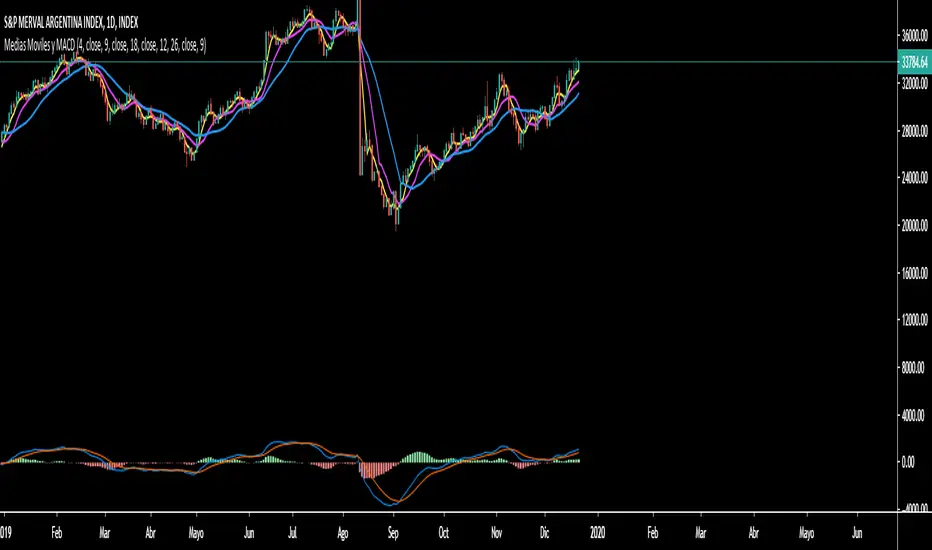
Simple Mobile Averages y MACDScript designed for users who need more than 3 indicators. It has 3 programmable "Simple Mobile Averages". MACD integrated in the main panel, also programmable.
MACRS {Lite}This is the open-source stripped down version of the full-featured RSI-MACD indicator (MACRS), with the ADO and the option to filter out weekend price action removed.
The main oscillator is the RSI modulated by the MACD (default). The RSI mode can be disabled to revert to a normal MACD oscillator for the main oscillator.
When the main oscillator (thicker line) is > 0, it is green; and if it is < 0, it is red.
The MACD can be re-scaled and whenever its value > 100, a background fill between the oscillator and the zeroline appear to indicates overbought condition; and < -100 indicates oversold condition. The user can tweak the scaling factor to optimize this for a given chart and timeframe.
A (thick transparent light blue) volume oscillator is also provided. An increase in volume trend provides confirmation of (or solidifies) the movements in the main oscillator over that period. A falling volume oscillator trend raises doubts on the main oscillator trend, and hints of the possibility of a counter-trend (also look at the secondary ADO oscillator for clues).
The novel aspects and principles of this indicator and this source code are the property of © cybernetwork.
This indicator and script is free for the TV community to use.

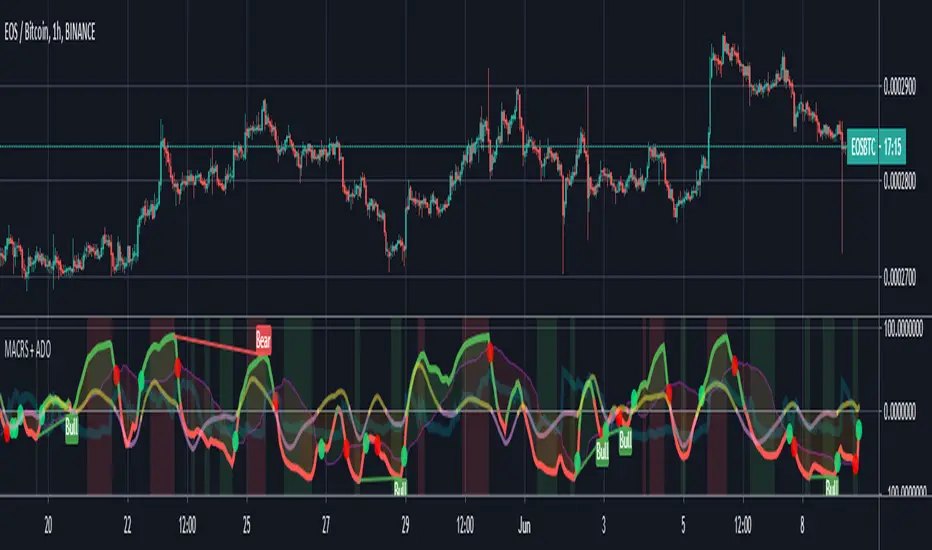
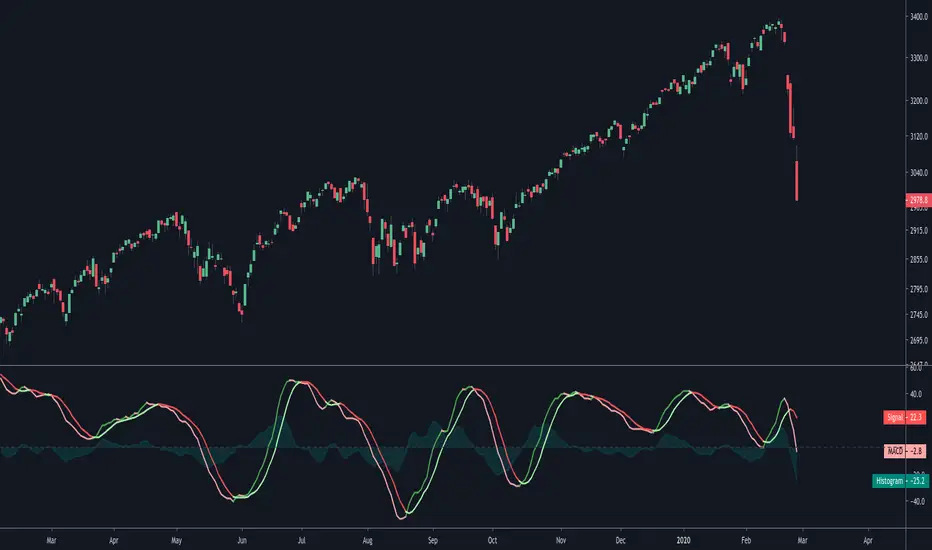
MACD modulated RSIThe main oscillator is the RSI modulated by the MACD (default). The RSI mode can be disabled to revert to a normal MACD oscillator for the main oscillator.
When the main oscillator (thicker line) is > 0, it is green; and if it is < 0, it is red.
The MACD can be re-scaled and whenever its value > 100, a background fill between the oscillator and the zeroline appear to indicates overbought condition; and < -100 indicates oversold condition. The user can tweak the scaling factor to optimize this for a given chart and timeframe.
A proprietary asymmetric differential oscillator (ADO) is also implemented, which is modulated by the main oscillator. When this (thinner line) secondary oscillator is > 0, it is yellow; and when it is < 0, it is lavender. The user can select the order of the differential (i.e. Order 1 = Momentum, Order 2 = Acceleration, Order 3 = Jerk, Order 4 = Snap, Order 5 = Crackle, Order 6 = Pop). This oscillator provides details of the more subtle underlying/hidden trends that is emerging or brewing, and may hint of an incoming move ahead of time. Divergence in the sign and slope of this secondary oscillator with respect to the main oscillator may provide a useful edge for trade setup.
A (thick transparent light blue) volume oscillator is also provided. An increase in volume trend provides confirmation of (or solidifies) the movements in the main oscillator over that period. A falling volume oscillator trend raises doubts on the main oscillator trend, and hints of the possibility of a counter-trend (also look at the secondary ADO oscillator for clues).
The novel aspects and principles of this indicator and this source code are the property of © cybernetwork.
This indicator and script is free for the TV community to use.
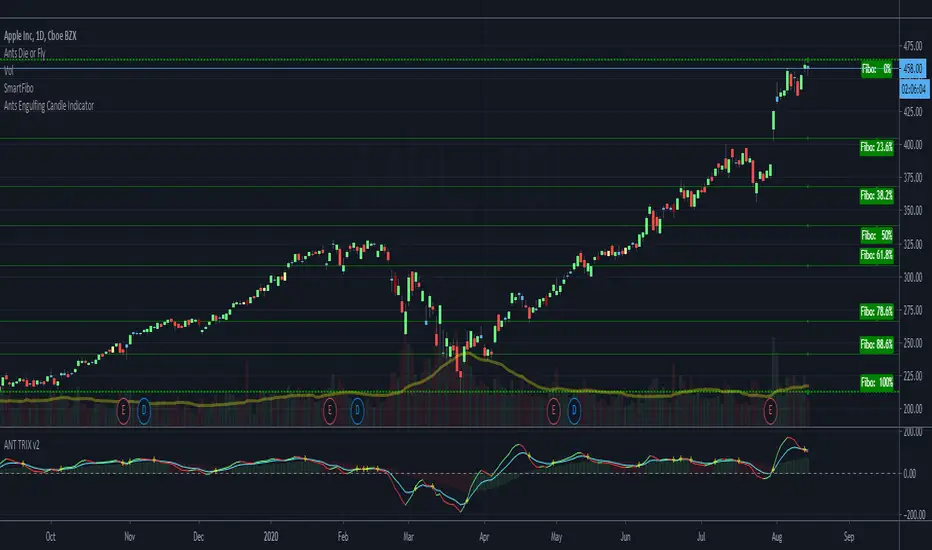
ANTS BEAST MODE TRIX+MACD TRIX CROSSThis indicator is both the TRIX + MACD all in one inidicator -- a + sign is displayed whenever the trix crosses
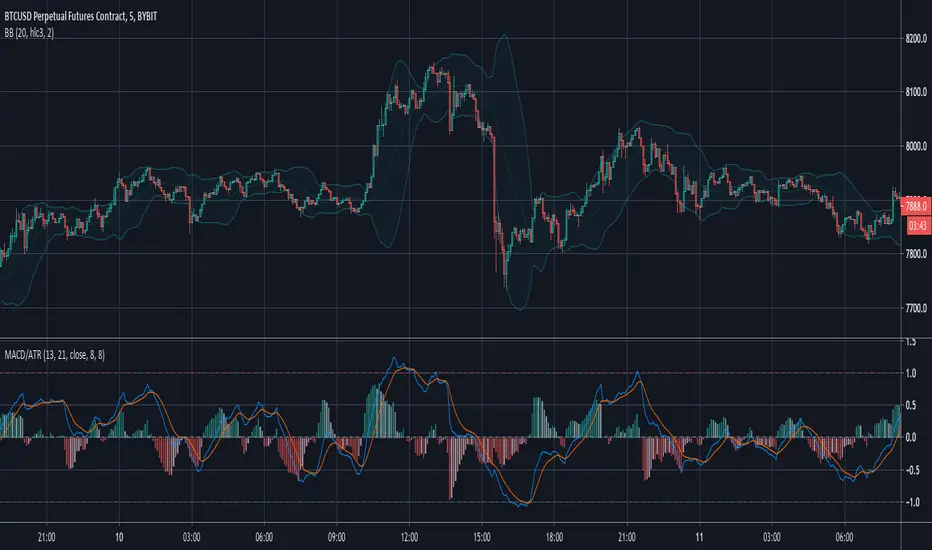
MACD/ATRThis indicator is a restricted MACD .
I reached this with a little trick: I devided it by ATR . This way it is most of the time inside the -1..1 range. It depends on the length of the ATR's period. If it is greater, the probability of outliers is greater.
With this indicator you can use cerain levels of MACD and its histogram as a trigger.
Share with me if you found it useful.
ORTI MACD (Static Timeframe Multi-Period)The " ORTI Moving Average Convergence Divergence (Static Timeframe Multi-Period) " is now a public script, based into a existing study named " MACD aka Moving Average Convergence Divergence ", but with some better functions about time frame and its measurament. As a redesigned and recalculated set of the common plotted averages, a trend-following momentum indicator that shows the relationship between two moving averages of a security’s price.
The cherry on the top for this version is, when you want to get a predetermined count in (ranges) units of time, as: minutes, hours or days, in any graph you could get a static average, and this count will be automatically respected. For example, an average could be configurated to know a trend per day, week or month... or whatever comes to mind, and at every single chart that you move through (5m, 15m, 1h, 4h, etc), you will see the same average to make your own "trend analysis" into a micro/macro market view.
But now, with the option to convert the " Exponential Moving Average " to adapt into 9 different kinds of "Moving Averages" and by any of the most used Moving Averages, an hybrid basically.
The following options to convert the "Exponential Moving Average ( EMA ) to:
• Double Exponential Moving Average ( DEMA )
• Exponential Moving Average ( EMA )
• Hull Moving Average ( HMA )
• Modified Moving Average ( MMA ) *
• Rolling Moving Average ( RMA ) *
• Simple Moving Average ( SMA )
• Smoothed Moving Average ( SMMA ) *
• Volume-weighted Moving Average ( VWMA )
• Weighted Moving Average ( WMA )
* Same Moving Averages: a Modified Moving Average is otherwise known as the Running Moving Average or Smoothed Moving Average.
The MACD is usually calculated by subtracting the 26-period Exponential Moving Average ( EMA ) from the 12-period EMA . The result of that calculation is the MACD line. A nine-day EMA of the MACD , called the "Signal Line", is then plotted on top of the MACD line which can function as a trigger for buy and sell signals. Traders may buy the security when the MACD crosses above its signal line and sell, or short, the security when the MACD crosses below the signal line.
The MACD has a positive value whenever the 12-period EMA is above the 26-period EMA and a negative value when the 12-period EMA is below the 26-period EMA . The more distant the MACD is above or below its baseline indicates that the distance between the two EMAs is growing. In the following chart, you can see how the two EMAs applied to the price chart correspond to the MACD (blue) crossing above or below its baseline (red dashed) in the indicator below the price chart.
The MACD is often displayed with a histogram which graphs the distance between the MACD and its signal line. If the MACD is above the signal line, the histogram will be above the MACD’s baseline. If the MACD is below its signal line, the histogram will be below the MACD’s baseline. Traders use the MACD’s histogram to identify when bullish or bearish momentum is high.
For more technical information look at Investopedia .
Note: The previous calculation example is not the default, the parameters can be adjusted according to the criteria of the merchant.

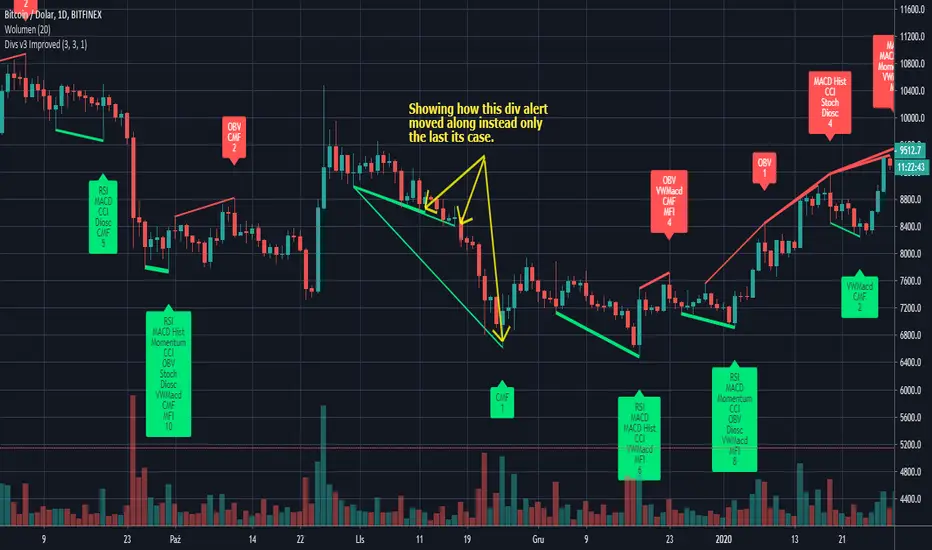
Divergence for many indicator v3 ImprovedThis is a modificated version of original script by @LonesomeTheBlue (Thank you for giving me rights to use your code with my modification in invite-only format):
I made few changes to lessen the amount of divergences generated on the chart and how they moved along (lines without cloud with text) instead only the last cases that may be missleading for some (especially when you would use that code to generate alerts).
MacD_TT by Chill00rThis is an MacD indicator with a signal line, color is trend-based
Outputs for Sells and Buys
A fancy trend-based background color is also avilable

MACD At Scales with AlertsI use the horizontal scale lines on the MACD indicator as part of my scalping strategy along with other indicators like RSI/EMA and Market Cipher B when trading BTC
I am looking for a cross above or below the 12.5 and 25 horizontal scale lines, along with lining up other indicators
I set my alerts on the 5 min TF and look to the 15 and 30 min TF's for further confirmation.
I have find the scale lines to be very useful for visual reference of the crosses, above/below 25 lines is mostly a safer trade, crosses above/below 12.5 lines can have more risk, crosses between 0 baseline and 12.5 can have a higher return but have much more risk.
Don't ever use just this indicator by itself, you must always have at least 2 indicators running
This is an example of the TF's not lining up, so a entry here would be high risk
This is an example of the TF's lining up, so a entry here would be less risk
Quadratic Weighted (QWMA) MACDMACD but on the Quadratic Weighted Moving Average instead of regular Moving Average
"The quadratic moving average ( QMA ) or quadratic weighted moving average (QWMA) is a type of moving average who is closer to the price when price is up trending. This moving average is defined as the square root of the moving average of the squared price." @alexgrover ()
Base MACD code from @RicardoSantos ()
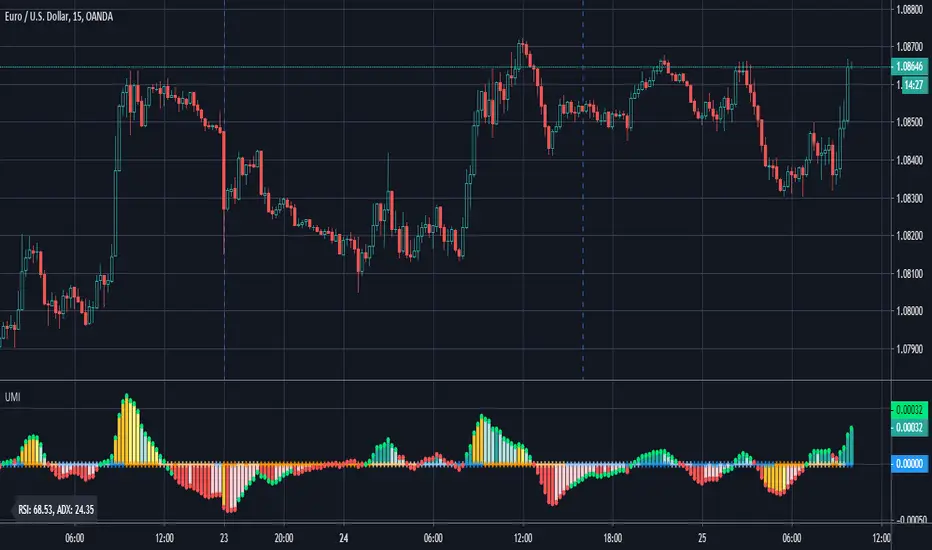
Ultimate Momentum IndicatorThis is an indicator I've been playing with for a while, based on my previous MACD w/ RSI Warning indicator. This one takes it a step further, including information from MACD, RSI, ADX, and Parabolic SAR. These four indicators are represented in this indicator as follows:
MACD: The histogram itself is a normal MACD histogram. Nothing strange about it, and you can adjust the settings for it just as you would a normal MACD.
RSI: Any time the RSI is outside of normal ranges (which can be adjusted in the settings), the bar on the histogram will turn amber to warn you. The actual RSI value is also shown in a label to the left side of the indicator.
ADX: Crosses are drawn along the 0 line to indicate ADX. Blue means the ADX is below the trending level (adjustable in the settings), and orange means it is above that level. Darker colors indicate the ADX has gone up since the previous bar, while lighter colors indicate it has gone down. The actual ADX value is also shown in the label to the left side of the indicator.
Parabolic SAR: At the outside point of each bar in the histogram, a colored dot is drawn. If the dot is green, the Parabolic SAR (settings adjustable) is currently below the closing price. If the dot is red, the SAR is above the closing price.
I must stress that this indicator is not a replacement for any one of the indicators it includes, as it's really only pulling small bits of information from each. The point of this indicator is to give a cohesive picture of momentum at a quick glance. I encourage you to continue to use the normal versions of whichever of the basic indicators you already use, especially if those indicators are a key part of your strategy. This indicator is designed purely as a way to get a bird's eye view of the momentum.
Pretty much every normally adjustable value can be adjusted in the settings for each of the base indicators. You can also set:
The RSI warning levels (30 and 70 by default)
The ADX Crossover, i.e. the point at which you consider the ADX value to indicate a strong trend (25 by default)
The offset for the label which shows the actual RSI & ADX values (109 by default, which happens to line up with my chart layout--yours will almost certainly need to be different to look clean)
All of the colors, naturally
As always, I am open to suggestions on how I might make the indicator look cleaner, or even other indicators I might try to include in the data this indicator produces. My choice of indicators to base this one from is entirely based on the ones I use and know, but I'm sure there are other great indicators that may improve this combination indicator even more!
Adam H Grimes - Keltner Channels with Day's High & LowThe indicator shows the day's high and low along with the Keltner Channels.
Keltner Channel Period - 20
Keltner Channel Multiple - 2.25

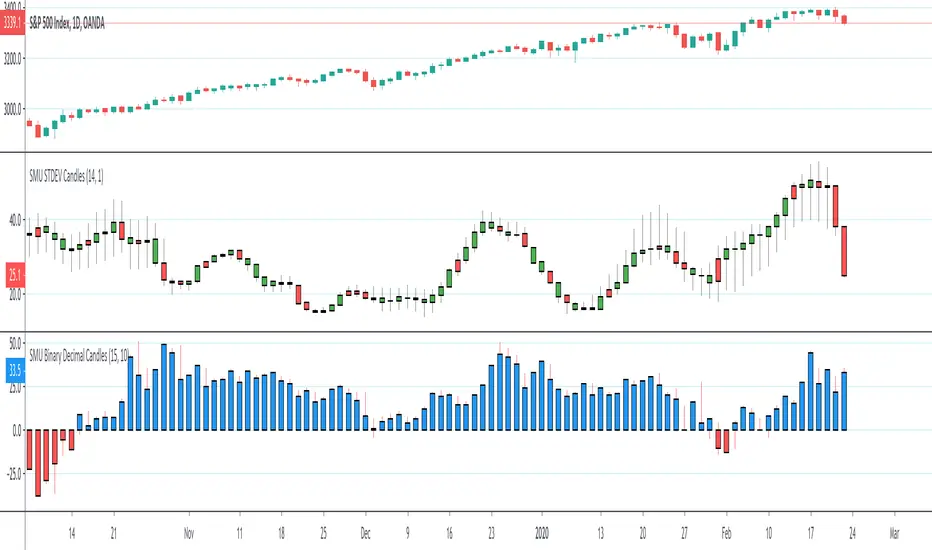
SMU Binary Decimal CandlesThis script creates a Decimal and Binary representation of the price using ROC. The idea is to simplify the price action into a distance from Zero to upside and downside.
You can see clearly trend develops in the ROC in the decimal view, kind of like MACD but based on raw price action change. I'm' a big fan of raw price action, so my scripts are super simple.
You can also use this script in a binary mode close higher = 1 and lower is -1. I use the binary mode to remove the psychological pressure of watching the stock going against me. I turn off the actual price and only focus on number of reds vs blue. On a Quantum physics level, when I short, I observe /wish for more reds like last night 1% sell-off
The main message form all my scripts is think outside the box, experiment with something crazy that doesn't make sense at first and make it to make sense. I always start with an idea that pops into my head, script with Pine script super simple and then watch it for hours to see what is trying to tell me. I have many work in progress that still doesn't make sense but looks really weird and wonderful. When I figure out what is trying to tell me I publish it
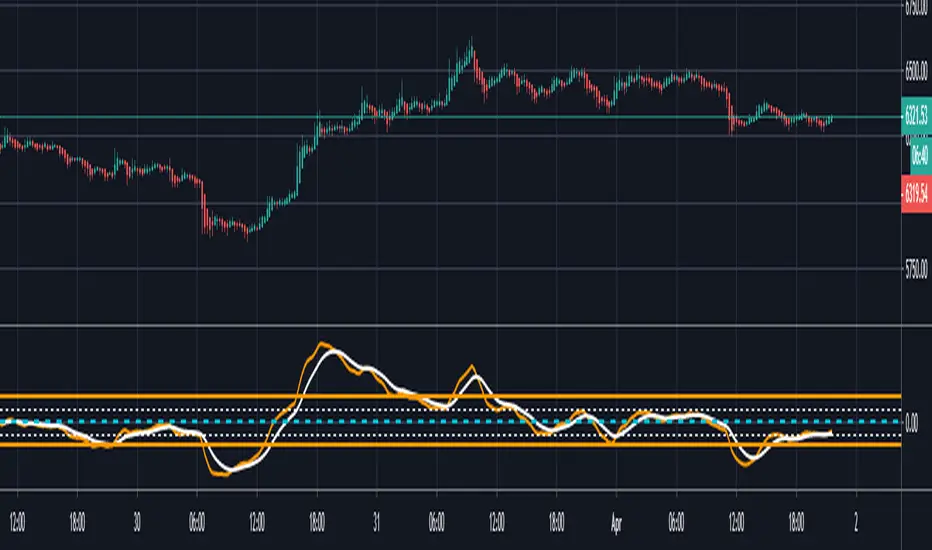
Stochastic MACDStochastic MACD (SMACD) is an oscillating momentum indicator, that combine the Stochastic oscillator and MACD (Moving Average Convergence/Divergence).
SMACD is based on the difference of two exponential moving averages (EMA) and their relative positions compared to the highest and lowest prices of a certain period (standard 45).
A possible high/low is around 15, so those values have been marked with a dotted line.
SMACD have proven to better show positive/negative divergences compared to the traditional MACD indicator. The indicator itself is very close to the MACD, but differ in the way you can compare the historical values.

Market Waves Alpha All-In-One IndicatorMarket Waves Alpha Indicator is a part of the Market Waves All-In-One indicators. It provides indicators on top of the candles which give accurate information on where the market it heading. It is important to familiarize yourself with the different keys available in Market Waves Alpha Indicator . These indicators appear above each candle, but it is important to wait until the candle actually closes before reacting on them. To make things a little easier, we are going to look at each indicator on its own and compare it with market price to see how it performs.
Blood & Red Diamond
These are suppose to be showing you when there is bearish momentum in the trend. Blood & Red Diamonds mean strong bearish momentum.
Yellow Cross – Market Manipulation
This indicator can identify when there is market manipulation about to occur, so be careful with your trade! Let’s see it in action:
Red Cross – Bearish Indicator
The red cross above the candle shows that there is bearish signals showing, so be careful!
Green Dot
The green dot that appears above the candles on Market Waves Alpha Indicator is suppose to where there is bullish intent:
The image above shows 2 green dots that appeared on 1 hour time frame. Clearly, the green dot appear followed by a large spike in price.
Blue Triangle
The blue triangle on Market Waves Alpha Indicator lets you know when there is a trend change, so if price action currently looks bullish the triangle lets you know that we are now in a bearish zone. Let’s take a look at this indicator:
EMA Ribbon
EMA ribbon can be used to identify the trend. Price is above the EMA ribbon when the trend is bullish and below the EMA ribbon when the trend is bearish.
This indicator is recommended to be used with Market Waves Omega Indicator for additional confirmation:
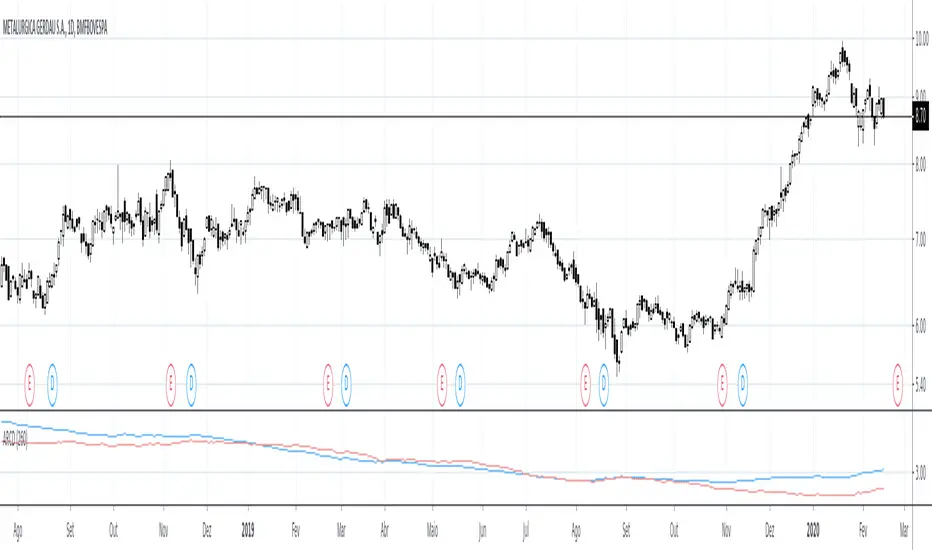
Average Range Convergence DivergenceHi there,
It's a script that plot the ATR (Average True Range) and ADR (Average Day Range) together and do an histogram of it. The histogram is the difference from ATR to ADR, I believe that it shows the average GAP in the asset. So I can easily found the offset to use when defining my stop.
PT
Esse script desenha o ATR (no profit True Range) e o ADR (media da diferença entre máximas e minimas) junto da diferença entre essas médias em formato de histograma. O gap médio de um ativo é mostrado no histograma.
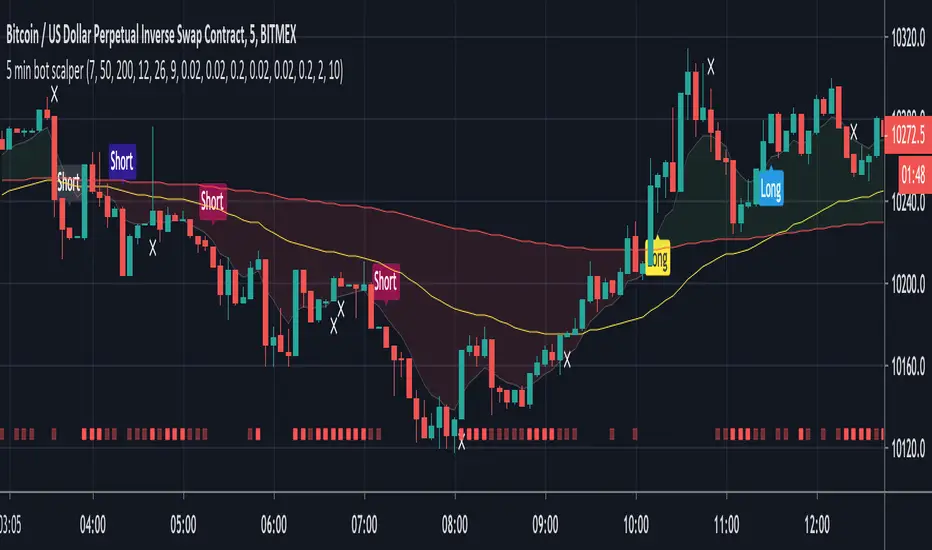
5 min bot scalperSAR signals (Parabolic and Lucid) combined with UT pivots, all filtered by the 200 MA. Golden and death crosses are also included to catch larger moves out-with long/short trends. These are filtered by my chop indicator to remove sideways signals.
This is designed for the 5 minute chart but may be useful elsewhere with some tweaking.
Alerts are included for long, short and exit signals.
[CryptoWho] Multi DivergencesThis script looks for divergences on up to six indicators, sums them up and draw a histogram below the chart.
You have several options to customize the output:
1. indicators: RSI, Stoch RSI, MACD, CCI, OBV, WaveTrend (LazyBear)
2. Divergences: Regular, hidden, both
3. Lookback period for divergences
BITSTAMP:BTCUSD

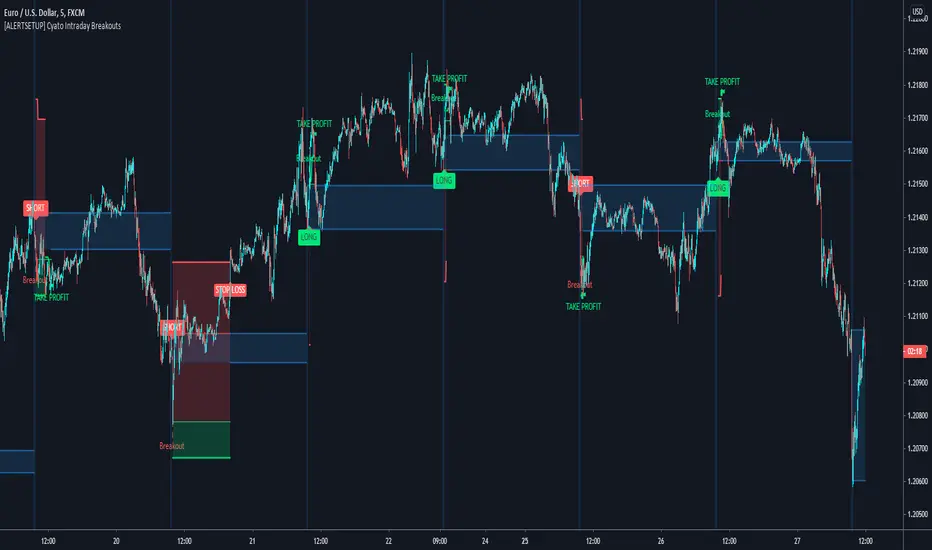
Cyatophilum Intraday Breakouts [ALERT SETUP]Private indicator.
Here is the alert version of the Triple Screen Strategy
Recap of the strategy:
The goal of this indicator is to be able to automate and backtest the strategy, all while staying on a single chart and without repainting.
Features:
Market Tide MACD configuration
Market Wave choice between 3 oscillator: Elder Force Index, Stochastic and William Percent Range
Automated Long and Short entries alerts
Integrated Trailing Stop Loss system fully configurable with automated exit alerts
Integrated Trailing Take profit system fully configurable with automated exit alerts
Indicator samples
Backtest version:
Alerts
Entry Long: Triggers on green long labels.
Take Profit Long: Triggers on the "TAKE PROFIT" green flag if the long target is reached.
Stop Loss Long: Triggers on the "STOP LOSS" or "TSSL" label if the stop loss line has been crossed.
Exit Long: Triggers on either of Take Profit Long or Stop loss long.
Entry Short: Triggers on red short labels.
Take Profit Short: Triggers on the "TAKE PROFIT" green flag if the short target is reached.
Stop Loss Short: Triggers on the "STOP LOSS" or "TSSL" label if the stop loss line has been crossed.
Exit Short: Triggers on either of Take Profit Short or Stop Loss Short.
To get access to this indicator use the link below
Thanks for reading!
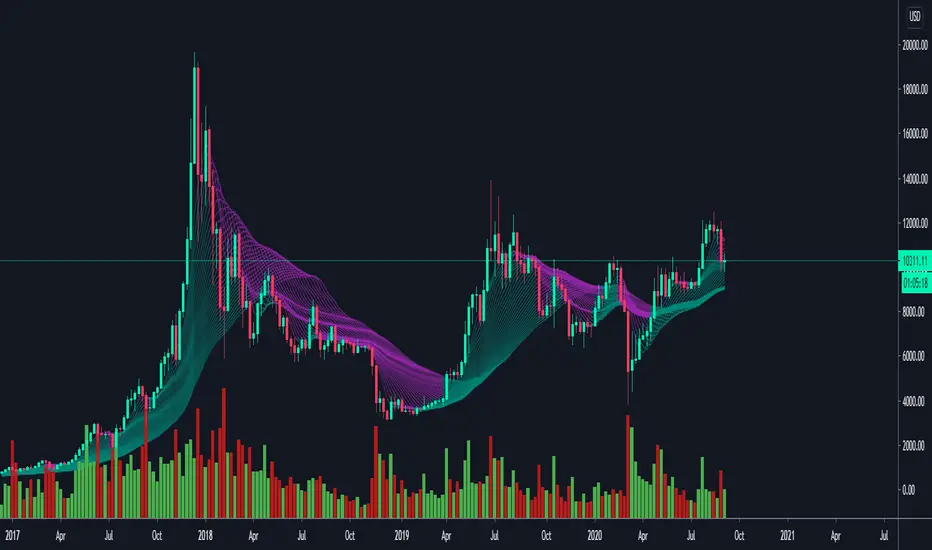
MACD & Mayer multpile Crypto-EmbassyThis is a combination of two indicators MACD & The Mayer Multiple.
MACD = Short for moving average convergence/divergence. It is designed to reveal changes in the strength, direction, momentum, and duration of a trend in a stock's price.
You will find the normal histogram and also a generated trend line (green = bullish , red = bearish )
The Mayer Multiple = The Mayer Multiple was created by Trace Mayer as a way to analyse the price of Bitcoin in a historical context. The Mayer Multiple is the multiple of the current price over the 200-days moving average.
"It does NOT tell whether to buy, sell or hold" but it gives you a pretty good idea of where we are at.
Basically
🔵Blue = Please buy🙏
🟢Light green = Looking for good entries 👀
🟢Green = Buy if you wish
🟡Yellow = This is starting to take off
🟠Orange = Looking for good exit 👀
🔴Red = You should get out of this
🔴Dark Red = You have balls, now please sell🙏

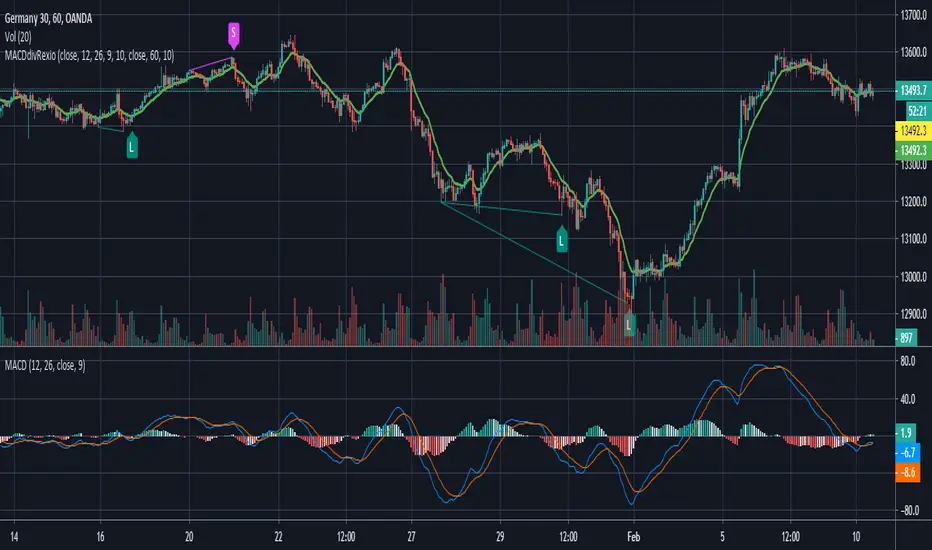
MACD divergence with line drawing by RexioAnother appoach to finding divergences at MACD. This time I think it is much smoother so I could check for divergences between two "peaks" at MACD.
I added my SL line which is last peak +- 1xATR. And the second line is peak between two points of divergence and most of the time it acts like an SR line.
If the higher timeframe trend backs up our divergence (for example: higher trend UP - divergence for L position) I can try to jump in after crossing EMA10.
This indicator is only sugestion for me. I always check price action, trend, SR line before I take any action.
Every people who will test this indicator need to know basics about divergences as THISE ARE NOT BUY/SELL SIGNALS.
If you want to help me and support my coding please contact me via private msg.