平滑異同移動平均線(MACD)
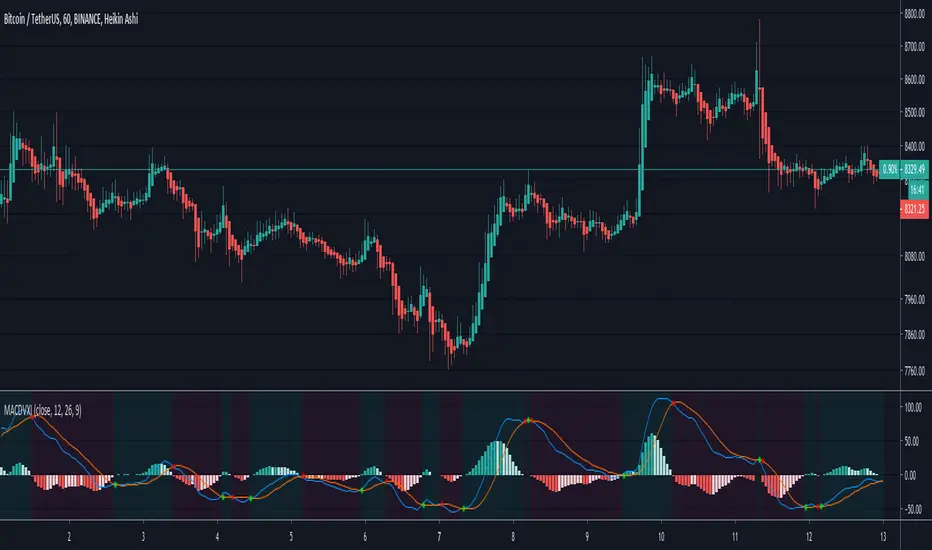
Schaff Trend Cycle [ChuckBanger]The Schaff Trend Cycle is a method, developed by Doug Schaff and based on the concept that trends also have repeating high and low patterns, or cycles. This is a modified MACD line, run through a modified stochastic algorithm and smoothed with Wilders’ smoothing in order to estimate the final Schaff Trend Cycle (STC) indicator. Its purpose is to identify the direction, in which a trend cycle is moving and possible peaks and bottoms within this cycle.
If this is interesting you should also take a look at MACD Leader:
For more info about Schaff Trend Cycle Indicator:
www.investopedia.com

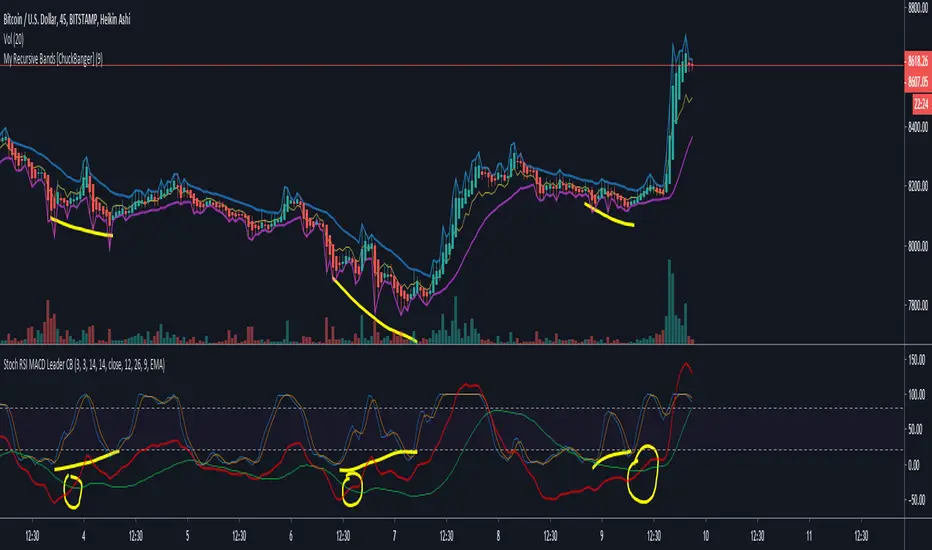
Stochastic RSI and MACD leader [ChuckBanger]Here I have combined Stochastic RSI with my MACD leader.
MACD leader and Stochastic RSI works well together and they are powerful in combination with My Recursive Bands. It is up to you to back test this properly before you use it in real life trades. But in my opinion it is very powerful.
Because of MACD nature it's a little messy when you turn on the MACD's histogram so I commented that out.
MACD Leader:
My Recursive Bands:
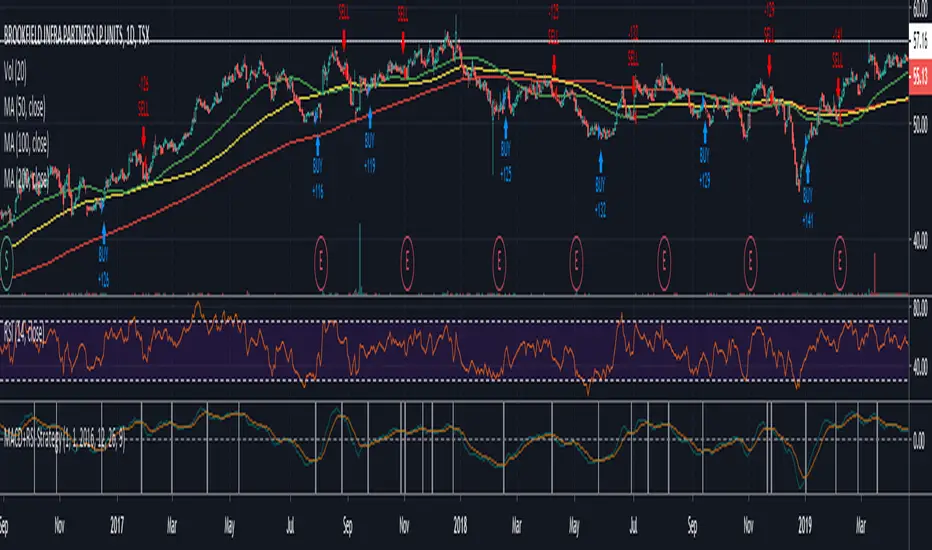
Easy to Use MACD+RSI Strategy
BEGINNERS REJOICE!
Easy to use strategy test using MACD with RSI as a confirming indicator. The code is structured to make it easy to manipulate the variables to your choosing.
EASY TO CHANGE CODE VARIABLES
LINE 2 = Change the amount you invest every trade and the currency
LINE 8/9/10 = Change the defval of each of these lines to backtest from a certain date
LINE 16/17/18 = Change the MACD sensitivity by changing the defval on each line
LINE 21 = Change the value after close toadjust the sensitivity of the RSI
LINE 37/39 = Change/remove the < and > variables for macdLine and rsivalue after the crossover/crossunder to adjust your buying point further.
As a beginner you may not feel comfortable with shorting stocks, therefore LINE 5 was added to only allows long positions.
Funny how a simple indicator can return such a high profitability. Couple this with some trend/exit strategies and you'll have something really special!
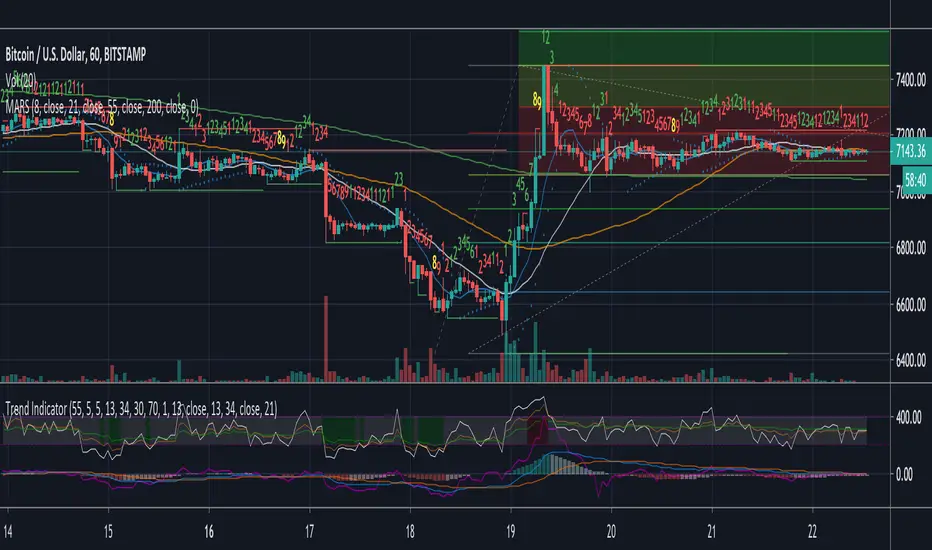
Trend Indicator
A Simple indicator combining 3 of the most popular Oscillators RSI, MacD and Momentum to help see reversals or the continuation of a trend. Designed with the COINBASE:BTCUSD chart in mind but there's not reason it shouldn't work on any other asset.
The indicator has two main parts:
- The gray area at the top between the purple dotted lines is 3 RSI's in one (5, 13, 34) These have been moved up from the RSI's original position to avoid cluttering the MacD and make the lines easier to read. Just like with the regular RSI the lower dotted line indicates oversold and the top dotted line indicates an overbought condition.
To identify this more easily the background changes to green when the middle (13 period) RSI is oversold and red when it's overbought.
*Note* On some very small timeframes the position may need to be adjusted in order to make them easier to see.
This section of the indicator is designed to give early warning signs of markets reversing by the faster white line with confirmation from the orange and green lines.
- The bottom section of the indicator has two parts. The first is a modified MacD which is slightly longer term than the original. This is to act as confirmation or entry/take profit points on divergence or if either of the lines within the MacD crossover or the histogram goes from one color to the other. The histogram is also helpful for trend-following as it lets you gauge if the momentum is gaining or losing strength.
The last part of the indicator is simply a momentum line to indicate in which direction the momentum is heading. It's designed as a confirmation of the other indicators and shouldn't be used on it's own.
All individual indicators that make up the trend indicator have been tweaked slightly to use numbers from the fibonacci sequence rather than the originals.
This indicator is best used in combination with volume and moving averages.
- Look for reversals on low volume near a moving average or key historical point.
- Look for breakouts on high volume if the oscillators line up.
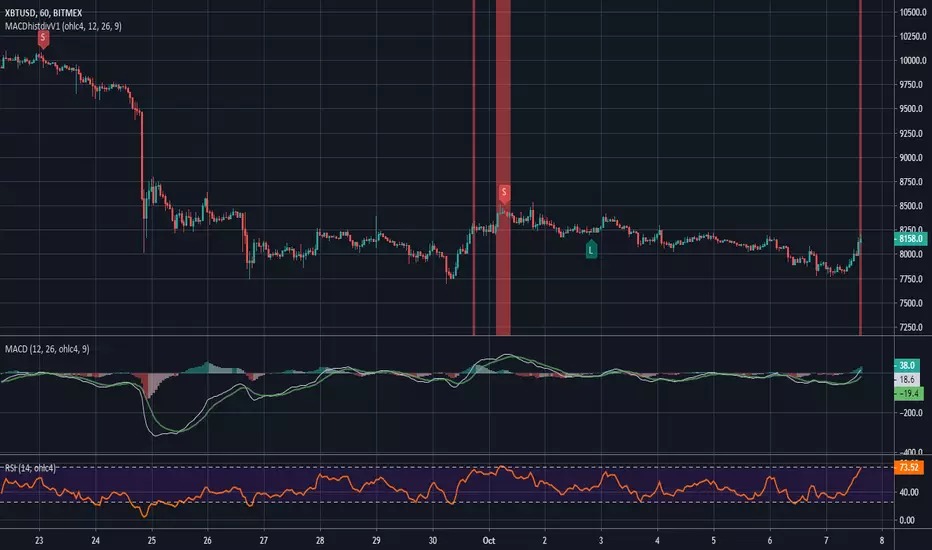
MACD and RSI divergence by Rexio v2Hi everyone!
I wrote this indicator for intraday trading and it cannot be use only by itself you need to at least draw some S/R lines to make it useful. It is based at MACD histogram and gives signal when it sees divergence on MACD/RSI/MACD's Histogram (or all at once - settings) when macd's histogram switchs trend. Im using it to playing with a trend most of the time looking for hidden divergence at higher time frame and after that looking for regular divergence at lower time frame.
Im not a computer programist nor professional trader so it is only for educational purposes only.

MACD histogram divergence by Rexio v1Hi everyone!
I wrote this indicator for intraday trading and it cannot be use only by itself you need to at least draw some S/R lines to make it useful. It is based at MACD histogram and gives signal when it sees divergence on MACD's Histogram when macd's histogram switchs trend. Im using it to playing with a trend most of the time looking. It highlights candles which can give good singnals to play with a trend (its based on ema200 and RSI overbought and oversold zones).
Im not a computer programist nor professional trader so it is only for educational purposes only.
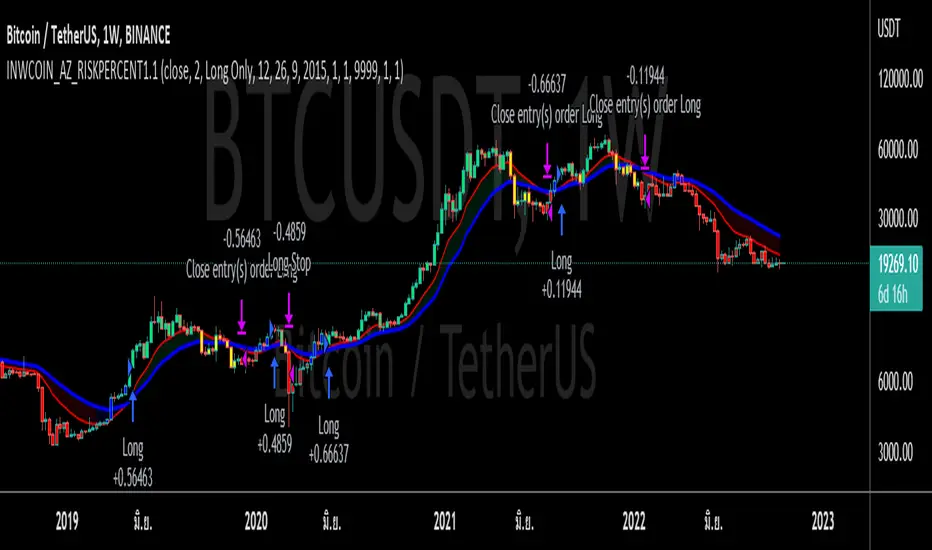
inwCoin ActionZone Risk% Strategy=========================
English
=========================
CDC Action Zone strategy with improved exit logic
Buy = Candle turn from blue to green
Sell = Price close below EMA 18
* Action Zone is just way to put MACD on chart for easily read
Original entry/exit logic is
Green = Buy
Red = Sell
Working great for BTC TF Daily.
==========================
Thai
==========================
"เทรดไรบ่อยๆ ปีนึงเทรดครั้งสองครั้งก็พอแล้ว -- มาเทรดเอาตัง ไม่ได้เอาเท่"
คำพูดสุดคลาสสิคของคุณลุงโฉลก ซึ่งเมื่อท่านเทรดไปบ่อยๆ ก็พบว่า ... เออ จริงของแก
เทรดไรบ่อยวะ นั่งทับมือ กันเฉยๆ น่ะเป็นไหม
ตัวนี้ผมเอา Action Zone เดิม มาปรับปรุง ให้เราสามารถเลือก Risk % ได้ จากเดิมที่เป็นการเข้าแบบทั้งก้อน ตอนนี้ก็ให้เข้าแบบ vary ได้แทน

MACD Leader [ChuckBanger]MACD makes use of moving averages and therefor usually lags behind the price. It is possible to eliminate lag completely but the work around of this is usually by adding a component of the price/MA difference back to MA. This technique is called Zero-lag. It is not zero lag but it is close enough. "MACD Leader" makes use of this to form a leading signal to MACD.
First proposed by Giorgos E. Siligardos, "Leader" leads normal MACD , especially when significant trend changes are about to take place. This has the following features:
- It is similar to MACD in smoothness.
- It can be plotted along with MACD in the same window using the same scaling.
- It has the ability to lead MACD at critical situations
For detailed discussion on the various divergence patterns, refer to the PDF here: drive.google.com
This script provide an option to plot MACD and MACD leader signal on the same pane. You can enable/disable them how you want via options page. It also has the option to change to different MA types.
Pullback easy to understand with GMMAWith this, you can easily understand the pullback!
GMMA is amazing!
Trends can be understood using GMMA.
You can also aim for pullback using RSI and MACD divergence.
Understand long-term trends with GMMA.
You can use the RSI and MACD divergence to find a short pullback.

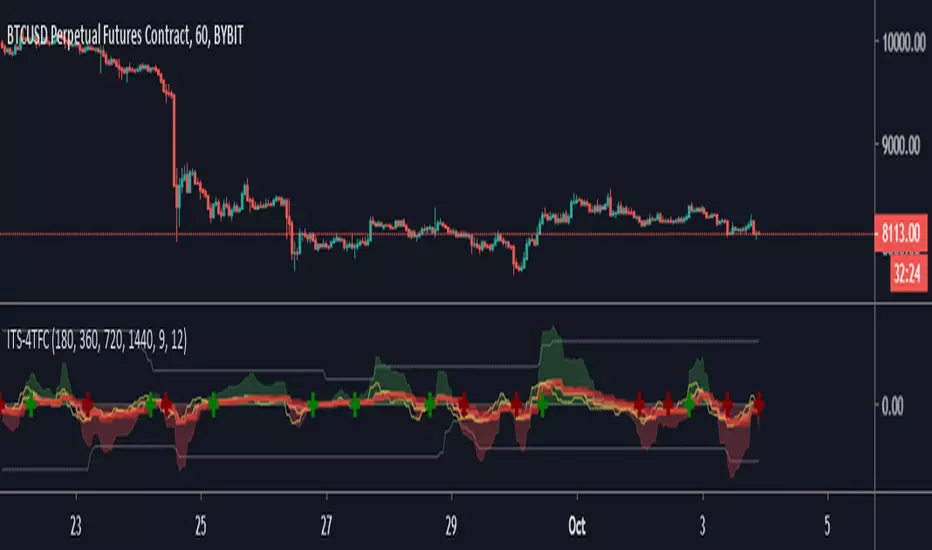
Iconik Trading Suite: 4 Time Frame ConfirmationThis indicator displays Iconik MACD bullish crosses (crossing above the 0-line) and bearish crosses (crossing below the 0-line) for 4 higher time frames. This provides a nice confirmation of time frames for a prevailing trend.
DM for a PowerPoint describing this indicator and the rest of Iconik in detail.
Iconik Trading Suite Indicator List:
ITS-OSC: Oscillators (v2)
ITS-PAA: Price Action Alerts (v2)
ITS-ASR: Auto Support/Resistance
-> Daily (v2)
-> 3 Day (v2)
-> Weekly (v2)
ITS-4TFC: 4 Time Frame Confirmation (v1)
ITS-DIV: Divergence Seeker (v1)
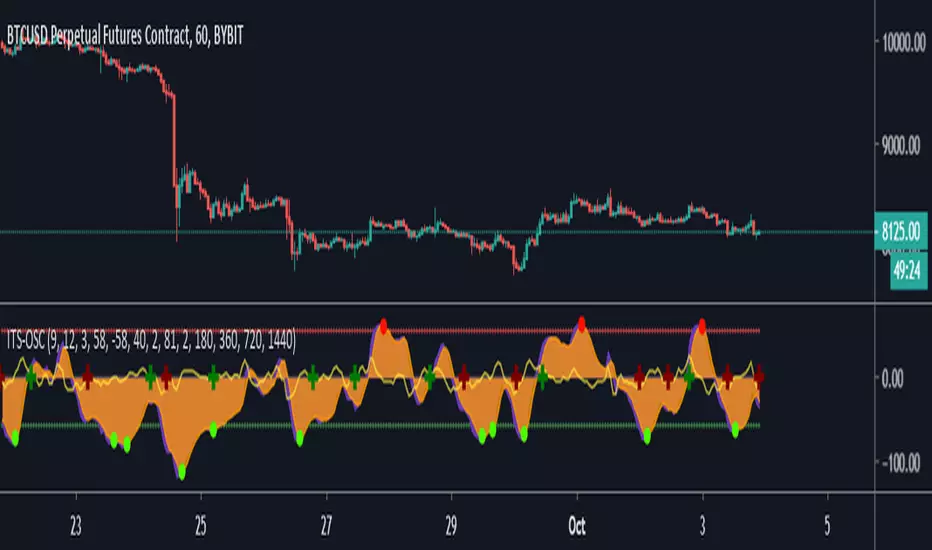
Iconik Trading Suite: OscillatorsAn upgraded MACD/Wave Trend Oscillator with bull/bear cross signals. 4TFC signals are plotted as well (see 4TFC indicator for explanation).
Iconik Trading Suite Indicator List:
ITS-OSC: Oscillators (v2)
ITS-PAA: Price Action Alerts (v2)
ITS-ASR: Auto Support/Resistance
-> Daily (v2)
-> 3 Day (v2)
-> Weekly (v2)
ITS-4TFC: 4 Time Frame Confirmation (v1)
ITS-DIV: Divergence Seeker (v1)
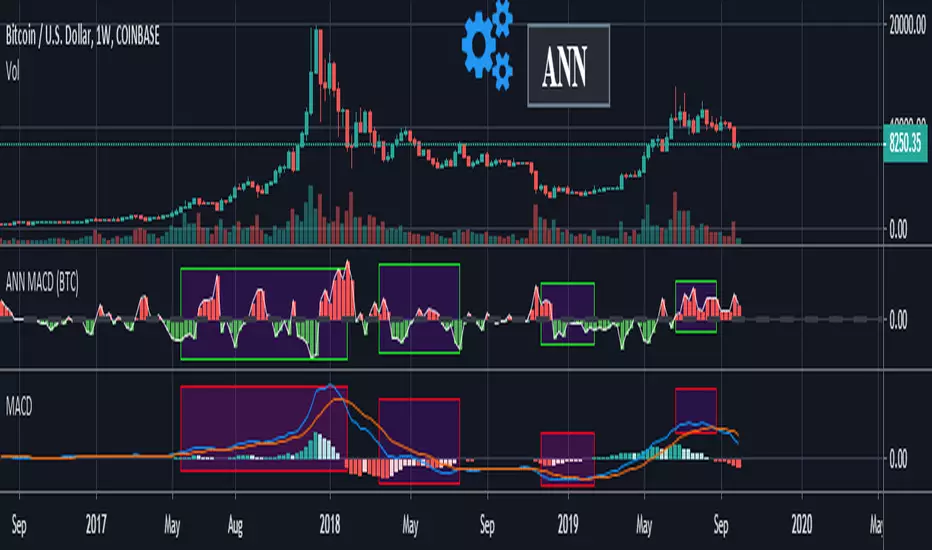
ANN MACD (BTC)
Logic is correct.
But I prefer to say experimental because the sample set is narrow. (300 columns)
Let's start:
6 inputs : Volume Change , Bollinger Low Band chg. , Bollinger Mid Band chg., Bollinger Up Band chg. , RSI change , MACD histogram change.
1 output : Future bar change (Historical)
Training timeframe : 15 mins (Analysis TF > 4 hours (My opinion))
Learning cycles : 337
Training error: 0.009999
Input columns: 6
Output columns: 1
Excluded columns: 0
Grid
Training example rows: 301
Validating example rows: 0
Querying example rows: 0
Excluded example rows: 0
Duplicated example rows: 0
Network
Input nodes connected: 6
Hidden layer 1 nodes: 8
Hidden layer 2 nodes: 0
Hidden layer 3 nodes: 0
Output nodes: 1
Learning rate : 0.6 Momentum : 0.8
More info :
EDIT : This code is open source under the MIT License. If you have any improvements or corrections to suggest, please send me a pull request via the github repository github.com
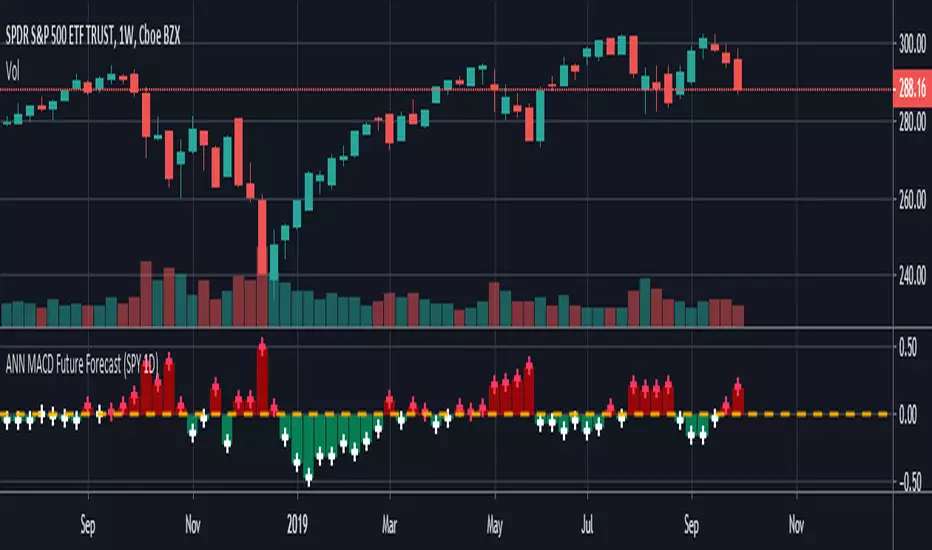
ANN MACD Future Forecast (SPY 1D) NOTE : Deep learning was conducted in a narrow sample set for testing purposes. So this script is Experimental .
This system is based on the following article and is inspired by an external program:
hackernoon.com
None of the artificial neural networks in Tradingview work and are not based on completely correct logic. Unlike others in this system:
IMPORTANT NOTE: If the tangent activation function is used, the input data must also have tangent values (compared to the previous values of 1 bar).
Inputs were prepared according to this judgment.
1. The tangent function which is the activation function is written correctly. (The tangent function in the article: ActivationFunctionTanh (v) => (1 - exp (-2 * v)) / (1 + exp (-2 * v)))
2. Missing bias parts in the formulas were added.
3. The output function is taken from the next day (historical), so that the next bar can be predicted, which is the truth.
4.The forecast value of the next bar is subtracted from the current bar change and the market direction is determined.
5.When the future forecast and the current close are added together, the resulting data is called seed.
The seed carries data both from the present and from yesterday and from the future.
6.And this seed was subjected to the MACD method.
Thus, due to exponential averages, more importance will be given to recent developments and
The acceleration situations will show us the direction.
However, a short position should be taken for crossover and a long position for crossunder .
Because the predicted values work in reverse.Even though we use the same period (9,12,26) it is much faster!
7. There is no future code that can cause Repaint.
However, the color after closing should be checked.
The system is completely correct.
However, a very narrow sample was selected.
100 data: Tangent diffs ; volume change, bollinger bands values changes (Upband , Midband , Lowband) and LazyBear's Squeeze Momentum Indicator (SQZMOM_LB) change and the next bar data (historical) price change were put into the deep learning test.
IMPORTANT NOTE : The larger the sample set and the more effective dependent variables, the higher the hit rate of the deep learning test!
EDIT : This code is open source under the MIT License. If you have any improvements or corrections to suggest, please send me a pull request via the github repository github.com
Stay tuned. Best regards!
iFish GravityThe Center of Gravity ( CG ) of a physical object is its balance point. For example, if you balance a 12 inch ruler on your finger, the CG will be at its 6 inch point. If you change the weight distribution of the ruler by putting a paper clip on one end, then the balance point (e.g. the CG ) shifts toward the paper clip. Moving from the physical world to the trading world, we can substitute the prices over our window of observation for the units of weight along the ruler. With this analogy, we see that the CG of the window moves to the right when prices increase sharply. Correspondingly, the CG of the window moves to the left when prices decrease. It is clear that every major price turning point is identified by the CG Oscillator and the crossovers formed by its trigger with zero lag. Since the CG Oscillator is filtered and smoothed, whipsaws of the crossovers are minimized.
This article describes a new oscillator that is unique because it is both smoothed and has essentially zero lag. The smoothing enables clear identification of turning points and the zero lag aspect enables action to be taken early in the move. This oscillator is the serendipitous result of my research into adaptive filters. While the filters have not yet produced the result I seek, this oscillator has substantial advantages over conventional oscillators used in technical analysis . The “CG” in the name of the oscillator stands for the Center of Gravity of the prices over the window of observation.
"J.Ehler"
For trading concept join me . DM
