Market SessionsMarket Sessions (Asian, London, NY, Pacific)
Summary
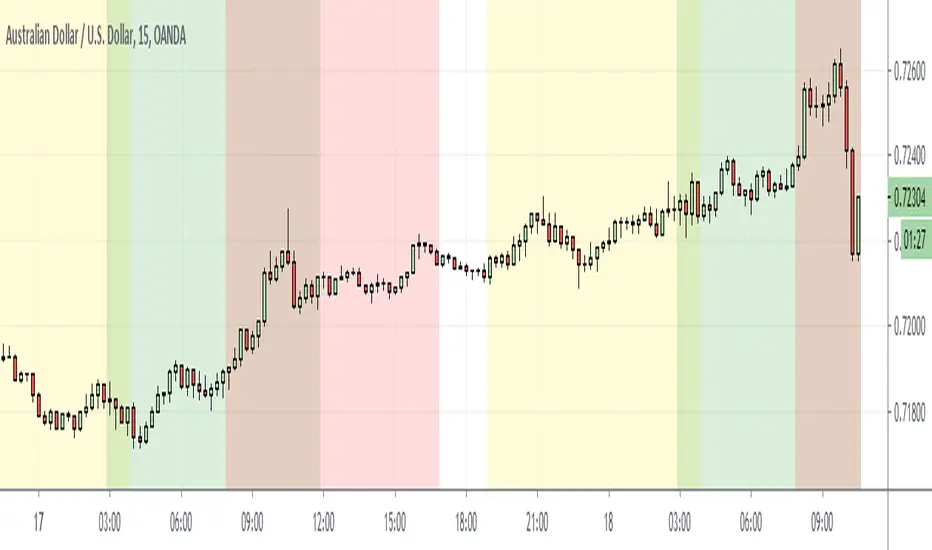
This indicator plots the main global market sessions (Asian, European, American, Pacific) as boxes on your chart, complete with dynamic high/low tracking.
It's an essential tool for intraday traders to track session-based volatility patterns and visualize key support/resistance levels (like the Asian Range) that often define price action for the rest of the day.
Who it’s for
Intraday traders, scalpers, and day traders who need to visualize market hours and session-based ranges. If your strategy depends on the London open, the New York close, or the Asian range, this script will map it out for you.
What it shows
Customizable Session Boxes: Four fully configurable boxes for the Asian, European (London), American (New York), and Pacific (Sydney) sessions.
Session High & Low: The script tracks and boxes the highest high and lowest low of each session, dynamically updating as the session progresses.
Session Labels: Clear labels (e.g., "AS", "EU") mark each session, anchored to the start time.
Key Features
Powerful Timezone Control: This is the core feature.
Use Exchange Timezone (Default): Simply enter session times (e.g., 8:00 for London) relative to the exchange's timezone (e.g., "NASDAQ" or "BINANCE").
Use UTC Offset: Uncheck the box and enter a UTC offset (e.g., +3 or -5). Now, all session times you enter are relative to that specific UTC offset. This gives you full control regardless of the chart you're on.
Fully Customizable: Toggle any session on/off.
Style Control: Change the fill color, border color, transparency, border width, and line style (Solid, Dashed, Dotted) for each session individually.
Smart Labels: Labels stay anchored to the start of the session (no "sliding") and float just above the session high.
Why this helps
Track Volatility & Market Behavior: Visually identify the "personality" of each session. Some sessions might consistently produce powerful pumps or dumps, while others are prone to sideways "chop" or accumulation. This indicator helps you see these repeating patterns.
Find Key Support/Resistance Levels: The High and Low of a session (e.g., the Asian Range) often become critical support and resistance levels for the next session (e.g., London). This script makes it easy to spot these "session-to-session" S/R flips and reactions.
Aid Statistical Analysis: The script provides the core visual data for your statistical research. You can easily track how often the London session breaks the Asian high, or which session is most likely to reverse the trend, helping you build a robust trading plan.
Context is King: Instantly see which market is active, which are overlapping (like the high-volume London-NY overlap), and which have closed.
Quick setup
Go to Timezone Settings.
Decide how you want to enter times:
Easy (Default): Leave Use Exchange Timezone checked. Enter session times based on the chart's native exchange (e.g., for BTC/USDT on Binance, use UTC+0 times).
Manual (Pro): Uncheck Use Exchange Timezone. Enter your UTC Offset (e.g., +2 for Berlin). Now, enter all session times as they appear on the clock in Berlin.
Go to each session tab (Asian, European...) to enable/disable it and set the correct start/end hours and minutes.
Style the colors to match your chart theme.
Disclaimer
For educational/informational purposes only; not financial advice. Trading involves risk—manage it responsibly.
Marketsessions

Session Status Table📌 Session Status Table
Session Status Table is an indicator that displays the real-time status of the four major trading sessions:
* 🇯🇵 Asia (Tokyo)
* 🇬🇧 London
* 🇺🇸 New York AM
* 🇺🇸 New York PM
It shows which sessions are currently open, how much time remains until they open or close, and optionally sends alerts in advance.
🧩 Features:
* Real-time session table — shows the status of each session on the chart.
* Color-coded statuses:
* 🟢 Green – Session is open
* 🔴 Red – Session is closed
* ⚪ Gray – Weekend
* Countdown timers until session open or close.
* User alerts — receive a notification a custom number of minutes before a session starts.
⚙️ Customization:
* Table position — fully configurable.
* Session colors — customizable for open, closed, and weekend states.
* Session labels — customizable with icons.
* Notifications:
* Enabled through TradingView's Alerts panel.
* User-defined lead time before session opens.
🕒 Time Zones:
All times are calculated in UTC to ensure consistency across different markets and regions, avoiding discrepancies from time zones and daylight saving time.
🚨 How to enable alerts:
1. Open the "Alerts" panel in TradingView.
2. Click "Create Alert".
3. In the condition dropdown, choose "Session Status Table".
4. Set to any alert() trigger.
5. Save — you'll be notified a set number of minutes before each session begins.
ℹ️ Technical Notes:
* Built with Pine Script version 6.
* Logically divided into clear sections: inputs, session calculations, table rendering, and alerts.
* Optimized for performance and reliability on all timeframes.
Ideal for traders who use session activity in their strategies — especially in Forex, crypto, and futures markets.

Market Sessions & Viewer Panel [By MUQWISHI]▋ INTRODUCTION :
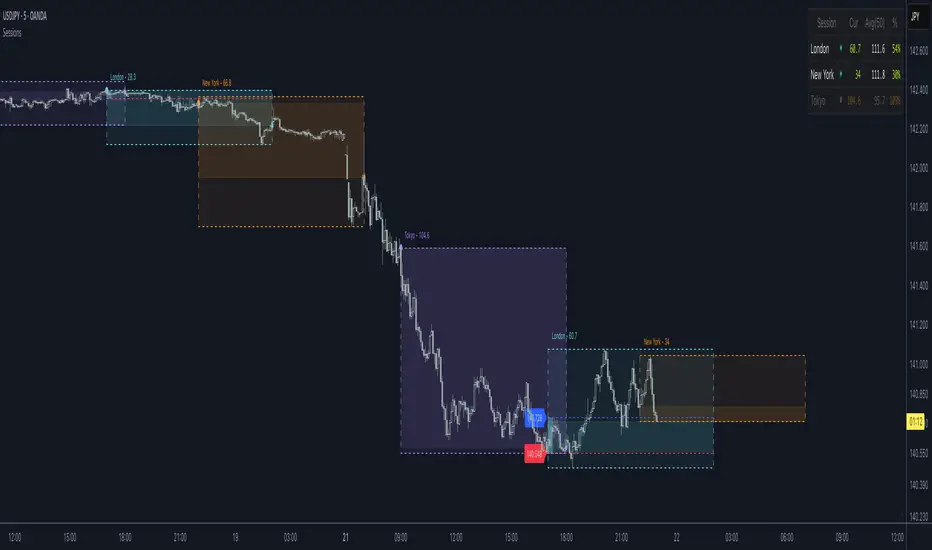
The “Market Sessions & Viewer Panel” is a clean and intuitive visual indicator tool that highlights up to four trading sessions directly on the chart. Each session is fully customizable with its name, session time, and color. It also generates a panel that provides a quick-glance summary of each session’s candle/bar shape, helping traders gain insight into the volatility across all trading sessions.
_______________________
▋ OVERVIEW:
_______________________
▋ CREDIT:
This indicator utilizes the “ Timezone — Library ”. A huge thanks to @n00btraders for effort and well-organized work.
_______________________
▋ SESSION PANEL:
The Session Panel allows traders to visually compare session volatility using a candlestick/bar pattern.
Each bar represents the price action during a session and includes the session status, session name, closing price, change(%) from open, and a tooltip that reveals detailed OHLC and volume when hovered over.
Chart Type:
It offers two styles Bar or Candle to display based on traders’ preference
Sorting:
Allowing to arrange session candles/bars based on…
—Left to Right: The most recently opened on the left, moving backward in time to the right.
—Right to Left: The most recently opened on the right, moving backward in time to the left.
—Default: Arrange sessions in the user-defined input order.
_______________________
▋ CHART VISUALIZATION:
The chart visualization highlights each trading session using color-coded backgrounds in two selectable drawing styles that span their respective active timeframes. Each session block provides session’s name, close price, and change from open.
Chart Type: Candle
Chart Type: Box
Extra Drawing Feature:
This feature may not exist in other indicators within the same category, it extends the session block drawing to the projected end of the session. This's done through estimation based on historical data; however, it doesn’t function fully on seconds-based timeframes due to drawing limitations.
_______________________
▋ INDICATOR SETTINGS:
Section(1): Sessions
(1) Universal Timezone.
(2) Each Session: Enable/Disable, Name, Color, and Time.
Section(2): Session Panel
(1) Show/Hide Session Panel.
(2) Chart Type: Candle/Bar.
(3) Bar’s Up/Down color.
(4) Width and Height of the bar.
(5) Location of Session Panel on chat.
(6) Sort: Left to Right (most recent session is placed on the left), Right to Left (most recent session is placed on the right), and Default (as input arrangement).
Section(3): Chart Visualization
(1) Show/Hide Chart Block Visualization.
(2) Draw Shape: Box/Candle.
(3) Border Style and Size.
(4) Label Styling includes location, size, and some essential selectable infos.
Please let me know if you have any questions

Market Session Boxes with Volume Delta [algo_aakash]This script highlights four key forex trading sessions — Tokyo, London, New York, and Sydney — by drawing color-coded boxes directly on the chart. For each session, it shows:
High and low of the session
Total volume traded
Volume delta (bullish vs bearish pressure)
Optional extension of session highs/lows into future candles
Cleanly labeled time range and stats
Users can:
Select which sessions to display
Customize session times (in UTC+0)
Choose colors per session
Toggle session labels and extension lines
Use Case: Designed to help intraday and short-term traders visualize market rhythm, liquidity zones, and session-based volatility. The volume delta metric adds an extra layer of sentiment analysis.
This tool works best on intraday timeframes like 15m, 30m, or 1H.
Disclaimer:
This indicator is for educational and visual analysis purposes. It does not constitute trading advice or guarantee results. Always conduct your own analysis before making trading decisions.

Sessions Full Markets [TradingFinder] Forex Stocks Index 7 Time🔵 Introduction
In global financial markets, particularly in FOREX and stocks, precise timing of trading sessions plays a crucial role in the success of traders. Each trading session—Asian, European, and American—has its own unique characteristics in terms of volatility and trading volume.
The Asian session (Tokyo), Sydney session, Shanghai session, European session (London and Frankfurt), and American session (New York AM and New York PM) are examples of these trading sessions, each of which opens and closes at specific times.
This session indicator also includes a Time Convertor, enabling users to view FOREX market hours based on GMT, UTC, EST, and local time. Another valuable feature of this indicator is the automatic detection of Daylight Saving Time (DST), which automatically applies time changes for the New York, London, and Sydney sessions.
🔵 How to Use
The indicator also displays session times based on the exact opening and closing times for each geographic region. Users can utilize this indicator to view trading hours either locally or in UTC time, and if needed, set their own custom trading times.
Additionally, the session information table includes the start and end times of each session and whether they are open or closed. This functionality helps traders make better trading decisions by using accurate and precise time data.
Key Features of the Session Indicator
The session indicator is a versatile and advanced tool that provides several unique features for traders.
Some of these features are :
• Automatic Daylight Saving Time (DST) Detection : This indicator dynamically detects Daylight Saving Time (DST) changes for various trading sessions, including New York, London, and Sydney, without requiring manual adjustments. This feature allows traders to manage their trades without worrying about time changes.
Below are the start and end dates for DST in the New York, London, and Sydney trading sessions :
1. New York :
Start of DST: Second Sunday of March, at 2:00 AM.
End of DST: First Sunday of November, at 2:00 AM
2. London :
Start of DST: Last Sunday of March, at 1:00 AM.
End of DST: Last Sunday of October, at 2:00 AM.
3. Sydney :
Start of DST: First Sunday of October, at 2:00 AM.
End of DST: First Sunday of April, at 3:00 AM.
• Session Display Based on Different Time Zones : The session indicator allows users to view trading times based on different time zones, such as UTC, the local time of each market, or the user’s local time. This feature is especially useful for traders operating in diverse geographic regions.
• Custom Trading Time Setup : Another notable feature of this indicator is the ability to set custom trading times. Traders can adjust their own trading times according to their personal strategies and benefit from this flexibility.
• Session Information Table : The session indicator provides a complete information table that includes the exact start and end times of each trading session and whether they are open or closed. This table helps users simultaneously and accurately monitor the status of all trading sessions and make better trading decisions.
🟣 Session Trading Hours Based on Market Mode and Time Zones
The session indicator provides precise information on the start and end times of trading sessions.
These times are adjusted based on different market modes (FOREX, stocks, and TFlab suggestions) and time zones (UTC and local time) :
🟣 (FOREX Session Time) Forex Market Mode
• Sessions in UTC (DST inactive) :
Sydney: 22:00 - 06:00
Tokyo: 23:00 - 07:00
Shanghai: 01:00 - 09:00
Asia: 22:00 - 07:00
Europe: 07:00 - 16:00
London: 08:00 - 16:00
New York: 13:00 - 21:00
• Sessions in UTC (DST active) :
Sydney: 21:00 - 05:00
Tokyo: 23:00 - 07:00
Shanghai: 01:00 - 09:00
Asia: 21:00 - 07:00
Europe: 06:00 - 15:00
London: 07:00 - 15:00
New York: 12:00 - 20:00
• Sessions in Local Time :
Sydney: 08:00 - 16:00
Tokyo: 08:00 - 16:00
Shanghai: 09:00 - 17:00
Asia: 22:00 - 07:00
Europe: 07:00 - 16:00
London: 08:00 - 16:00
New York: 08:00 - 16:00
🟣 Stock Market Trading Hours (Stock Market Mode)
• Sessions in UTC (DST inactive) :
Sydney: 00:00 - 06:00
Asia: 00:00 - 06:00
Europe: 07:00 - 16:30
London: 08:00 - 16:30
New York: 14:30 - 21:00
Tokyo: 00:00 - 06:00
Shanghai: 01:30 - 07:00
• Sessions in UTC (DST active) :
Sydney: 23:00 - 05:00
Asia: 23:00 - 06:00
Europe: 06:00 - 15:30
London: 07:00 - 15:30
New York: 13:30 - 20:00
Tokyo: 00:00 - 06:00
Shanghai: 01:30 - 07:00
• Sessions in Local Time:
Sydney: 10:00 - 16:00
Tokyo: 09:00 - 15:00
Shanghai: 09:30 - 15:00
Asia: 00:00 - 06:00
Europe: 07:00 - 16:30
London: 08:00 - 16:30
New York: 09:30 - 16:00
🟣 TFlab Suggestion Mode
• Sessions in UTC (DST inactive) :
Sydney: 23:00 - 05:00
Tokyo: 00:00 - 06:00
Shanghai: 01:00 - 09:00
Asia: 23:00 - 06:00
Europe: 07:00 - 16:00
London: 08:00 - 16:00
New York: 13:00 - 21:00
• Sessions in UTC (DST active) :
Sydney: 22:00 - 04:00
Tokyo: 00:00 - 06:00
Shanghai: 01:00 - 09:00
Asia: 22:00 - 06:00
Europe: 06:00 - 15:00
London: 07:00 - 15:00
New York: 12:00 - 20:00
• Sessions in Local Time :
Sydney: 09:00 - 16:00
Tokyo: 09:00 - 15:00
Shanghai: 09:00 - 17:00
Asia: 23:00 - 06:00
Europe: 07:00 - 16:00
London: 08:00 - 16:00
New York: 08:00 - 16:00
🔵 Setting
Using the session indicator is straightforward and practical. Users can add this indicator to their trading chart and take advantage of its features.
The usage steps are as follows :
Selecting Market Mode : The user can choose one of the three main modes.
Forex Market Mode: Displays the forex market trading hours.
oStock Market Mode: Displays the trading hours of stock exchanges.
Custom Mode: Allows the user to set trading hours based on their needs.
TFlab Suggestion Mode: Displays the higher volume hours of the forex market in Asia.
Setting the Time Zone : The indicator allows displaying sessions based on various time zones. The user can select one of the following options:
UTC (Coordinated Universal Time)
Local Time of the Session
User’s Local Time
Displaying Comprehensive Session Information : The session information table includes the opening and closing times of each session and whether they are open or closed. This table helps users monitor all sessions at a glance and precisely set the best time for entering and exiting trades.
🔵Conclusion
The session indicator is a highly efficient and essential tool for active traders in the FOREX and stock markets. With its unique features, such as automatic DST detection and the ability to display sessions based on different time zones, the session indicator helps traders to precisely and efficiently adjust their trading activities.
This indicator not only shows users the exact opening and closing times of sessions, but by providing a session status table, it helps traders identify the best times to enter and exit trades. Moreover, the ability to set custom trading times allows traders to easily personalize their trading schedules according to their strategies.
In conclusion, using the session indicator ensures that traders are continuously and accurately informed of time changes and the opening and closing hours of markets, eliminating the need for manual updates to align with DST changes. These features enable traders to optimize their trading strategies with greater confidence and up-to-date information, allowing them to capitalize on opportunities in the market.

10x Bull Vs. Bear VP Intraday Sessions [Kioseff Trading]Hello!
This script "10x Bull Vs. Bear VP Intraday Sessions" lets the user configure up to 10 session ranges for Bull Vs. Bear volume profiles!
Features
Up To 10 Fixed Ranges!
Volume Profile Anchored to Fixed Range
Delta Ladder Anchored to Range
Bull vs Bear Profiles!
Standard Poc and Value Area Lines, in Addition to Separated POCs and Value Area Lines for Bull Profiles and Bear Profiles
Configurable Value Area Target
Up to 2000 Profile Rows per Visible Range
Stylistic Options for Profiles
This script generates Bull vs. Bear volume profiles for up to 10 fixed ranges!
Up to 2000 volume profile levels (price levels) Can be calculated for each profile, thanks to the new polyline feature, allowing for less aggregation / more precision of volume at price and volume delta.
Bull vs Bear Profiles
The image above shows primary functionality!
Green profiles = buying volume
Red profiles = selling volume
All colors are configurable.
Bullish & bearish POC + value areas for each fixed range are displayable!
That’s about it :D
This indicator is part of a series titled “Bull vs. Bear”.
If you have any suggestions please feel free to share!

Market Sessions and TPO (+Forecast)This indicator "Market Sessions and TPO (+Forecast)" shows various market sessions alongside a TPO profile (presented as the traditional lettering system or as bars) and price forecast for the duration of the session.
Additionally, numerous statistics for the session are shown.
Features
Session open and close times presented in boxes
Session pre market and post market shown
TPO profile generated for each session (normal market hours only)
A forecast for the remained of the session is projected forward
Forecast can be augmented by ATR
Naked POCs remain on the chart until violated
Volume delta for the session shown
OI Change for the session shown (Binance sourced)
Total volume for the session shown
Price range for the session shown
The image above shows processes of the indicator.
Volume delta, OI change, total volume and session range are calculated and presented for each session.
Additionally, a TPO profile for the most recent session is shown, and a forecast for the remainder of the active session is shown.
The image above shows an alternative display method for the session forecast and TPO profile!
Additionally, the pre-market and post-market times are denoted by dashed boxes.
The image above exemplifies additional capabilities.
That's all for now; further updates to come and thank you for checking this out!
And a special thank you to @TradingView of course, for making all of this possible!

market sessions by sellstreetIndicator of trading sessions:
Indicator created to track the opening of trading sessions:
Asia, Frankfurt, London, New York.
Tracking the opening of these key levels
- Day Opening (DO), Week Opening (WO), Month Opening (MO).
- New York (NYM) openings display.
- Highs and lows of the previous day (PDH/PDL).
- Day of the week display.
- Formation of the Сentral Bank Dealers Range (CBDR).
Indicator settings.
The open source code will help traders to understand the technical part of the script.
Flexible visual and technical setup of the indicator:
- Ability to enable/disable the display of trading sessions on the history.
- Enabling/disabling the display of the key opening levels on the chart history for a convenient backtest.
- Automatically switch to summer/winter time.
To use this indicator, add it to your favorites after the chart
TradingView must be overloaded to work correctly.

FVG Sessions [LuxAlgo]The FVG Sessions indicator highlights the first fair value gap of the trading session as well as the session range. Detected fair value gaps extend to the end of the trading session.
Alerts are included on the formation of a session fair value gap, price being within a session fair value gap, mitigations, and price crossing session fair value gaps average.
🔶 USAGE
Trader ICT states that the first fair value gap of the trading session can attract the most significant reaction. Having only one FVG per session allows users to further focus on that precise imbalance as well as external elements.
The mitigation of a fair value gap is clearly indicated on the chart with a more transparent color allowing users to see inverse FVGs.
Extending the fair value gaps allows the imbalance area to provide potential support and resistance.
Do note that this script should be used on intraday charts.
🔶 ALERTS
The script includes the following alerts:
🔹 Bullish/Bearish FVG
Alerts on the formation of the first bullish or bearish FVG of the session.
🔹 Bullish/Bearish FVG Mitigation
Alerts when the first bullish or bearish FVG of the session is mitigated.
🔹 Price Within FVG
Alerts when price is within the first bullish or bearish FVG area of the session.
🔹 Price Cross FVG Average
Alerts when price cross the average level of the first bullish or bearish FVG of the session.

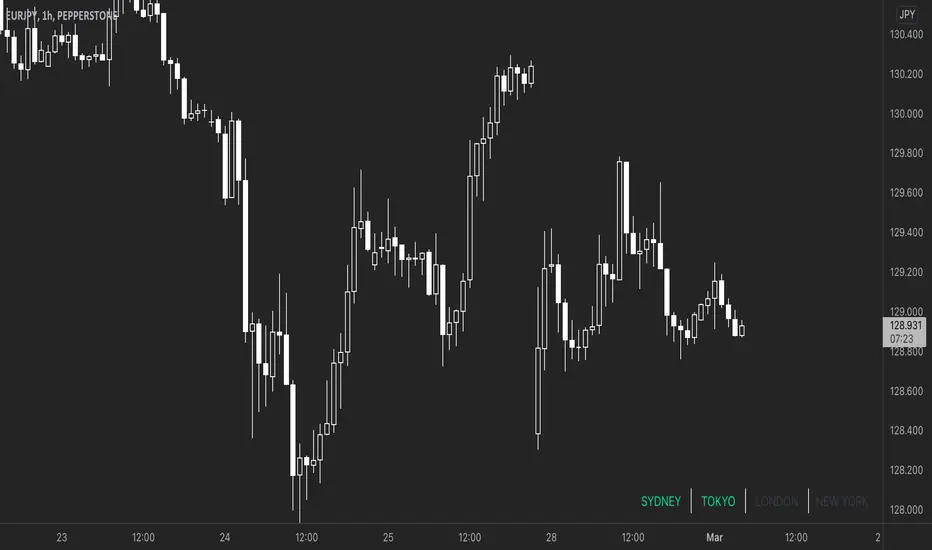
Market Sessions - By LeviathanA simple indicator to help you keep track of 4 market sessions (default: Tokyo, London, New York, Sydney) in 4 different visual forms (boxes, timeline, zones, colored candles) with many other useful tools.
You can choose between 4 different market sessions. The default ones are Tokyo, London, New York and Sydney but you can easily customize the times, names and colors to make the script plot any session you need. Sessions can be viewed in 4 different ways: boxes, zones, timelines, or just colored candles, all with customizable appearances. You can make your chart cleaner by merging sessions overlaps, choosing a custom lookback period and also picking between various additional settings such as viewing session High/Low or Open/Close change in % or pips, hiding weekends, viewing the Open/Close Line to identify session’s direction and 0.5 level to see session’s “Equilibrium” and much more. More updates with interesting tools will be added in the future.
Note: The script will plot the correct default Tokyo, London, New York and Sydney sessions automatically, your chart/Tradingview app timezone does not matter! If you wish to tweak the open/close times of sessions, just make sure you input them in UTC (but even this can be changed later in the settings)
Settings Overview
SESSIONS
- You can show/hide Tokyo Session, rename it, change the color and set up start/end time.
- You can show/hide London Session, rename it, change the color and set up start/end time.
- You can show/hide New York Session, rename it, change the color and set up start/end time.
- You can show/hide Sydney Session, rename it, change the color and set up start/end time.
* Keep in mind that you can fully change and customize these sessions and therefore create any other sessions or a zone you wish to display.
ADDITIONAL TOOLS AND SETTINGS
1. “Change (Pips)” - this will add the pip distance between Session High and Session Low or the pip distance between Session Open and Session Close to the session label.
2. “Change (%)” - this will add the percentage distance between Session High and Session Low or the percentage distance between Session Open and Session Close to the session label.
3. “Merge Overlaps” - this will merge the overlapping sessions and show only one at a time (end of Tokyo is moved to start of London, the end of London is moved to the start of New York, end of New York is moved to start of Sydney and end of Sydney is moved to start of Tokyo).
4. “Hide Weekends” - this will prevent the script from plotting sessions over the weekend when the markets are closed.
5. “Open/Close Line” - this will draw a line from the session open to the session close (or current price, if session is ongoing).
6. “Session 0.5 Level” - this will draw a horizontal line halfway between the session’s high and the session’s low.
7. “Color Candles” - this will color the bars/candlesticks with the color of the session in which they occurred.
8. Display Type” - Choose between three different ways of session visualization (Boxes, Zones and Candles).
9. “Lookback (Days)” - this input tells the script to only draw sessions for X days back (1 = one day).
10. “Change (%/Pips) Source) - this is where you choose the source of “Change (Pips)” and ”Change (%) ” labels. Picking “Session High/Low” will show you the change between Session High and Session Low and picking “Session Open/Close” will show you the change between Session Open and Session Close.
11. “Input Timezone” - this defines the timezone of the session start/end inputs (you don’t have to change this unless you know what you’re doing)
Make sure to read future update logs to keep track of the most recent additions and settings of this script.
Box generation code inspired by Jos(TradingCode), session box visuals inspired by @boitoki's FX Market Sessions

DR/IDR Candles [LuxAlgo]This indicator displays defining ranges (DR) and implied defining ranges (IDR) constructed from two user set sessions (RDR/ODR) as graphical candles on the chart. The script introduces additional graphical elements to the original DR/IDR concept and as such can be thought as a graphical method in addition to a technical indicator.
Additionally, this script can display various Fibonacci retracements from the constructed DR/IDR if enabled within the settings.
Settings
Regular Session: Enable/disable regular session's DR/IDR alongside setting the session time. By default, 09:30 - 10:30 am.
Overnight Session: Enable/disable overnight session's DR/IDR alongside setting the session time. By default, 03:00 - 04:00 am.
UTC Offset: UTC offset for the time zone, by default -5 (EST)
Retracements
Reverse: Inverts source range upper/lower value for constructing the retracements.
From: Source range used to construct the retracements, by default DR is used.
By default, the 0.5 retracement (average line) is displayed.
Usage
The used sessions are highlighted by a gray background. DRs are highlighted by dashed lines while IDRs are highlighted by solid ones. The maximum/minimum price between each user set session is highlighted by solid wicks.
The color of the DRs/IDRs/wicks are determined by the price position relative to the DR; if price is above the DR maximum, then a blue color is used. If price is below, then an orange color is used, and if price is within the DR range, then a gray color is used.
Additionally, the area of the DR range is used to highlight the number of time price is located within the DR, with a longer background highlighting a higher number of occurrences. This can help highlight if the DR levels were potentially useful as support/resistance.
When price is outside the IDR range, the area between the price and IDR is highlighted, in blue if price is above the IDR, and orange if it is under.
The original author of the DR/IDR concept describes 3 rules using the price position relative to the DR/IDR levels:
1.) If price on the 5-minute timeframe closes above the DR high after 10:30 AM or 04:00 AM then the DR low will likely be the low of the trading session.
2.) If price on the 5-minute timeframe closes below the DR low after 10:30 AM or 04:00 AM then the DR high will likely be the high of the trading session.
3.) If price closes above the IDR high after 10:30 AM or 04:00 AM it is an early indication that the low of the DR will be the low of the day and vice versa.
We can see that the above rules are cases of conditional probabilities.
There is no significant data supporting or regarding any statistical probability of the above rules to be true, which are more than uncertain given the stochastic nature of prices. The lack of precision of these rules is also a concern (time zone dependance, applicable markets, etc...).
Credits
Credits to trader TheMas7er who originally created the DR/IDR concept in November of 2022. This script was derived from his proposed session times & rules for trading.

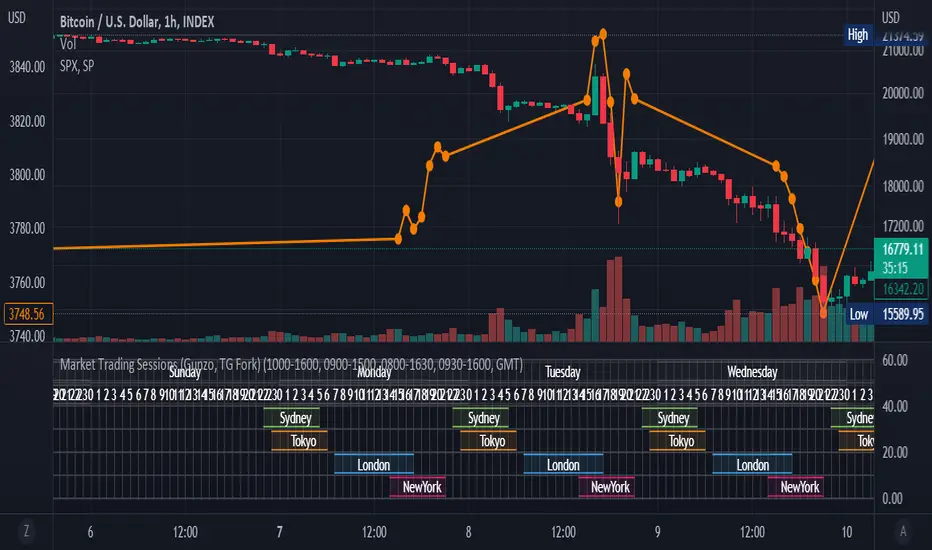
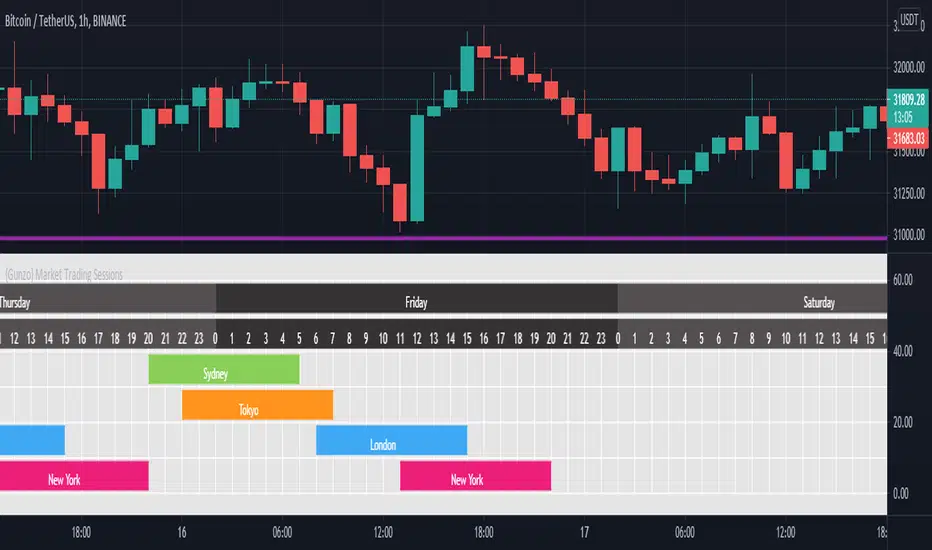
Market Trading Sessions (TG Fork)Visualize trading sessions opening hours of several international exchanges on a grid. Contrary to other indicators, this one automatically aligns the session with the current chart's timezone.
This is helpful for bar replay or manual backtesting, to spot patterns of correlations (this can also be used in conjunction with correlation indicators, see my other indicators).
Original indicator by Gunzo, if you like this indicator, please show the original author some love:
This indicator is also inspired by the following indicators:
ZenAndTheArtOfTrading with
UnknownUnicorn468659 with
This fork implements the following features:
Converted to PineScript v5.
Adapted default color palette to dark mode, as is the default in TradingView now.
Fix drawing issues, now the design shows as it was originally meant to be.
Fixed mistiming issue that made some sessions display with a delay compared to the real session, especially the first session was bar at the start of the session was not displayed.
Inputted the accurate timings for each session, instead of the default 0800-1600 in the original indicator.
Essentially, you can just add this indicator and it should work out of the box. If not, please let me know, and I'll try to fix it!
Simple FX Market Hours█ OVERVIEW
A simple market session indicator that show you what market is in session according to the timezone you configured. It will draw a table with 4 cells matching 4 market Sydney, Tokyo, London and New York. Whenever market is in session the matching text will change colour.
█ WHAT MAKE THIS DIFFERENT
All other indicator on the market are either bar colouring, background colouring, or some sort of box drawing on the chart which is very messy and cluttered your chart. This indicator is as simple as it gets. The label are positions by default at the top right corner (you can change this in the config). It doesn’t draw anything on your chart so you can get right into your price action without anything blocking you.
Also, these type of indicator on the market are not auto converting the market session time to your your configured timezone, you will have to manually entered in the market session hours in your local time. This indicator does! Or perhaps I didn’t look hard enough. Either way I think there aren’t any indicator that are this simple.
█ HOW IT WORKS
I’m using table function (available to pinescript version 4 and above) to position the market labels and change colour of them according to if the market is in session or not.
For timezone, I have predefined all the market hours in all of the timezone from GMT-12 to GMT+12. When you select your timezone it will convert it to the symbol’s exchange timezone. Feel free to update the timezone if I had it incorrectly.
This script doesn’t take into account the DST because DST doesn’t starts or ends on a fixed date.
I also put in a check for symbol type using: syminfo.type == "forex”. So that it will only display if you are on forex pairs. You don’t need to hide it while you are looking at crypto or other assets. For convenience purposes.
█ NOTES
If you like the script be sure to press the like button it will help shows other people that this is useful. Thank you very much!
{Gunzo} Market Trading Sessions (Tokyo, London, New York)Market Trading Sessions is a tool designed to help traders to find the best times of the day for price action trading. It displays non-overlapping visuals for the major trading sessions : Oceania, Asia, Europe, and USA.
OVERVIEW :
This tool has been designed to match all the following requirements that I needed for optimal usage :
Display opening and closing of main markets
See clearly market sessions (non-overlapping colors)
Display Sydney session if wanted
Display GMT hours and days
Visually pleasing design and colors
Highly configurable
As I had trouble finding a script matching all these criteria, I created this tool and I'm sharing it with the TradingView community, hoping you will find it useful too.
SETTINGS :
Display market sessions on weekends : Display theoretical market sessions times on the weekend which can be useful for non forex markets.
Display session for Oceania\Sydney : Display "Oceania\Sydney" trading session
Display session for Asia\Tokyo : Display "Asia\Tokyo" trading session
Display session for Europe\London : Display "Europe\London" trading session
Display session for USA\New York : Display "USA\New York" trading session
Display session names : Display names of the session on the visual
Oceania color : Configurable color for the "Oceania\Sydney" sessions
Asia color : Configurable color for the "Asia\Tokyo" sessions
Europe color : Configurable color for the "Europe\London" sessions
USA color : Configurable color for the "USA\New York" sessions
Background color : Configurable color for the table background
Border color : Configurable color for the table borders
Text color : Configurable color for the table text
Header color : Configurable color for the table header (even days)
Header color (alternate) : Configurable color for the table header (odd days)
Simple Market Session by GavThis is a simple script to highlight market sessions.
It highlights Sydney, Tokyo, London, and New York sessions with transparent background colors.
You are able to change session times, color, and transparency.