Renko Velocity Meter [Chris Chapman]Here is the comprehensive copy for your Renko Velocity Meter indicator. This is structured to be used in a TradingView description, a manual, or a product listing.
Renko Velocity Meter
What is this Indicator?
The Renko Velocity Meter is a specialized momentum dashboard designed strictly for Renko Charts. Unlike standard oscillators (like RSI or MACD) which often fail on Renko due to the lack of time-based data, this tool uses "Brick Physics" to measure the actual speed and efficiency of price movement.
It answers the most critical question in Renko trading: "Is this a real trend, or just a choppy consolidation?"
Instead of giving you lagging signals, it provides a real-time Velocity Score (0-100) displayed on a dashboard directly on your chart. It automatically filters out "fake" moves and highlights high-probability "TURBO" conditions when the market enters a powerful extension phase.
How It Is Calculated
The Velocity Score is derived from a proprietary blend of three distinct mathematical checks:
1. Trend Efficiency ("The Snake Logic") The script calculates the ratio between the Net Price Move and the Total Distance Traveled over a lookback period.
High Efficiency: Price is moving in a straight line (Strong Trend).
Low Efficiency: Price is winding back and forth (Chop/Range).
2. Momentum Deviation (Auto-Brick Detection) The indicator automatically detects your specific Renko brick size (whether 2 pips, 10 points, or custom) without manual input. It then measures how many "Bricks" the price has pulled away from the baseline Moving Average.
If price is 6+ bricks away from the average, it signals a high-momentum extension.
3. HTF Trend Lock (Multi-Timeframe Filter) It internally checks a Higher Timeframe (default: 15-minute) to ensure you are trading with the dominant trend.
HTF LOCK: The Renko trend and the 15m trend are aligned (Green).
HTF MIX: The trends are conflicting. The score is automatically capped at 60 to prevent false signals.
4. The "Counter-Trend" Penalty To prevent buying tops or selling bottoms, the script instantly penalizes the score if a "Retracement Brick" forms.
Example: If the trend is UP, but a RED brick forms, the score is forced down to the "Yellow/Neutral" zone until the trend resumes.
Requirements
To use this indicator effectively, you must meet the following chart conditions:
Chart Type: Renko (This is mandatory. The math relies on fixed-size bricks).
Timeframe: Works on all timeframes, but optimized for standard scalping setups (e.g., 2-pip fixed bricks on EURUSD/Gold).
Data Feed: High-quality data is recommended. For maximum precision, use a 1-second (1s) interval setting for your Renko box generation if your TradingView plan allows it.
The Inputs (Settings)
You can customize the sensitivity of the meter to fit your specific asset class:
Trend Efficiency Period (Default: 14):
The number of bricks used to calculate how "straight" the trend is. Lower numbers make the score faster; higher numbers make it smoother.
Momentum Baseline (Default: 20):
The length of the internal Moving Average used as the "mean" price.
Max Momentum in Bricks (Default: 6):
How many bricks of extension are required to hit a "100% Score"? Increase this for volatile assets like Gold or Bitcoin.
HTF Support (Default: 15):
The Higher Timeframe used for the Trend Lock filter.
Meter Position:
Choose where the dashboard appears on your screen (Top Right, Bottom Left, etc.).
Dashboard Legend
GREEN (Score > 70): TURBO – Strong trend alignment. High probability of continuation.
YELLOW (Score 50-70): TREND – Active trend, but potentially stalling or retracing.
RED (Score < 50): CHOP – No clear direction or conflicting signals. Stay flat.
POSITION: Shows the current logic state (LONG/SHORT/FLAT).
Meter

Price Heat Meter [ChartPrime]⯁ OVERVIEW
Price Heat Meter visualizes where price sits inside its recent range and turns that into an intuitive “temperature” read. Using rolling extremes, candles fade from ❄️ aqua (cold) near the lower bound to 🔥 red (hot) near the upper bound. The tool also trails recent extreme levels, tags unusually persistent extremes with a % “heat” label, and shows a bottom gauge (0–100%) with a live arrow so you can read market heat at a glance.
⯁ KEY FEATURES
Rolling Heat Map (0–100%):
The script measures where the close sits between the current Lowest Low and Highest High over the chosen Length (default 50).
Candles use a two-stage gradient: aqua → yellow (0–50%), then yellow → red (50–100%). This makes “how stretched are we?” instantly visible.
Dynamic Extremes with Time Decay:
When a new rolling High or Low is set, the script starts a faint horizontal trail at that price. Each bar that passes without a new extreme increases a counter; the line’s color gradually fades over time and fully disappears after ~100 bars, keeping the chart clean.
Persistent-Extreme Tags (Reversal Hints):
If an extreme persists for 40 bars (i.e., price hasn’t reclaimed or surpassed it), the tool stamps the original extreme pivot with its recorded Heat% at the moment the extreme formed.
• Upper extremes print a red % label (possible exhaustion/resistance context).
• Lower extremes print an aqua % label (possible exhaustion/support context).
Bottom Heat Gauge (0–100% Scale):
A compact, gradient bar renders at the bottom center showing the current Heat% with an arrow/label. ❄️ anchors the left (0%), 🔥 anchors the right (100%). The arrow adopts the same candle heat color for consistency.
Minimal Inputs, Clear Theme:
• Length (lookback window for H/L)
• Heat Color set (Cold / Mid / Hot)
The defaults give a balanced, legible gradient on most assets/timeframes.
Signal Hygiene by Design:
The meter doesn’t “call” reversals. Instead, it contextualizes price within its range and highlights the aging of extremes. That keeps it robust across regimes and assets, and ideal as a confluence layer with your existing triggers.
⯁ HOW IT WORKS (UNDER THE HOOD)
Range Model:
H = Highest(High, Length), L = Lowest(Low, Length). Heat% = 100 × (Close − L) / (H − L).
Extreme Tracking & Fade:
When High == H , we record/update the current upper extreme; same for Low == L on the lower side. If the extreme doesn’t change on the next bar, a counter increments and the plotted line’s opacity shifts along a 0→100 fade scale (visual decay).
40-Bar Persistence Labels:
On the bar after the extreme forms, the code stores the bar_index and the contemporaneous Heat% . If the extreme survives 40 bars, it places a % label at the original pivot price and index—flagging levels that were meaningfully “tested by time.”
Unified Color Logic:
Both candles and the gauge use the same two-stage gradient (Cold→Mid, then Mid→Hot), so your eye reads “heat” consistently across all elements.
⯁ USAGE
Treat >80% as “hot” and <20% as “cold” context; combine with your trigger (e.g., structure, OB, div, breakouts) instead of acting on heat alone.
Watch persistent extreme labels (40-bar marks) as reference zones for reaction or liquidity grabs.
Use the fading extreme lines as a memory map of where price last stretched—levels that slowly matter less as they decay.
Tighten Length for intraday sensitivity or increase it for swing stability.
⯁ WHY IT’S UNIQUE
Rather than another oscillator, Price Heat Meter translates simple market geometry (rolling extremes) into a readable temperature layer with time-aware extremes and a synchronized gauge . You get a continuously updated sense of stretch, persistence, and potential reversal context—without clutter or overfitting.

Normalized Oscillators Spider Chart [LuxAlgo]This indicator displays a spider chart overlaid on the user’s current chart allowing the visualization of information given by various normalized oscillators. It is possible to customize the spider chart by hiding certain oscillators from within the settings which removes their corresponding spokes from the chart.
Users can control the length settings of each oscillator individually or use a global length setting that applies to every oscillator. An additional meter element is displayed and aims to give the overall sentiment returned by the oscillators. This can also be used to gauge whether the market is trending or ranging.
This is a relatively simple application of a spider chart but can prove to be useful to some users.
1. Settings
RSI: Displays the Relative Strength Index spoke on the spider chart, includes the length setting on the right of the toggle.
%K: Displays the Stochastic Oscillator "%K" spoke on the spider chart, includes the length setting on the right of the toggle.
COR: Displays the Correlation Oscillator spoke on the spider chart, includes the length setting on the right of the toggle.
MFI: Displays the Money Flow Index oscillator spoke on the spider chart, includes the length setting on the right of the toggle.
WPR: Displays the Williams Percent Rank oscillator spoke on the spider chart, includes the length setting on the right of the toggle.
%UP: Displays the percentage of upward variations spoke on the spider chart, includes the length setting on the right of the toggle.
CMO: Displays the Chande Momentum Oscillator spoke on the spider chart, includes the length setting on the right of the toggle.
AOS: Displays the Aroon oscillator spoke on the spider chart, includes the length setting on the right of the toggle.
Global Oscillators Length: Determines whether all oscillators should use the same length settings, determined by the setting on the right of the toggle.
1.1 Style Settings
Spider Chart Length: Determines the horizontal width of the spider chart.
Spider Chart Offset: Offset between the most recent bar and the left extremity of the spider chart.
2. Usage
A spider chart can be a very useful visualization tool when it comes to seeing the individual characteristics of various variables at the same time.
Here, the tool can give a general sentiment on the direction of the trend without adding each indicator to your chart. It is also possible to determine when an oscillator is considered overbought or oversold with this indicator.
The dashed line represents the central value for each oscillator.
Disabling any of the oscillators from the settings will return a spider chart using fewer spokes.
The script also displays a meter that can be used to determine the overall sentiment given by all oscillators. This metric is based on the average value between each oscillator. An overall sentiment closer to 50 would indicate a ranging market.

Price/Volume Trend MeterAnother simple indicator from the sweet indicator series, This is a combination of the Volume and Price Trend Meter indicators combined (Links below) into one indicator called PVTM (Price Volume Trend Meter).
PVTM measures the strength of price and volume pressure on a histogram.
The indicator sums up all green candles price and volume and red candles price and volume over a specific period of bars and plots based on Price summed value. The result will look similar to Price Trend Meter with the benefit of trying to filter out more noise.
Use this indicator to identify the increasing asset of price and volume with the green candles (Close is higher than open) and decreasing of price and volume with the red candles (Close is lower than open).
======= Calculation ==========
Bright Green Color Column: Total summed up Price and Volume are higher than 0.
Bright Red Color Column: Total summed up Price and Volume are Lower than 0.
Weak Green Color Column: Conflict between Price and Volume (One positive and one negative) so we continue based on previous color .
Weak Red Color Column: Conflict between Price and Volume (One positive and one negative) so we continue based on previous color.
======= Price/Volume Trend Meter Colors =======
Green: Increasing buying pressure.
Weaker Green: Declining Buying pressure (Possible Sell Reversal).
Red: Increasing selling pressure.
Weaker Red: Declining Selling pressure (Possible Buy Reversal).
Other sweet indicators that this indicator is based on:
Volume Trend Meter:
Price Trend Meter:
Like if you Like and Follow me for upcoming indicators/strategies: www.tradingview.com

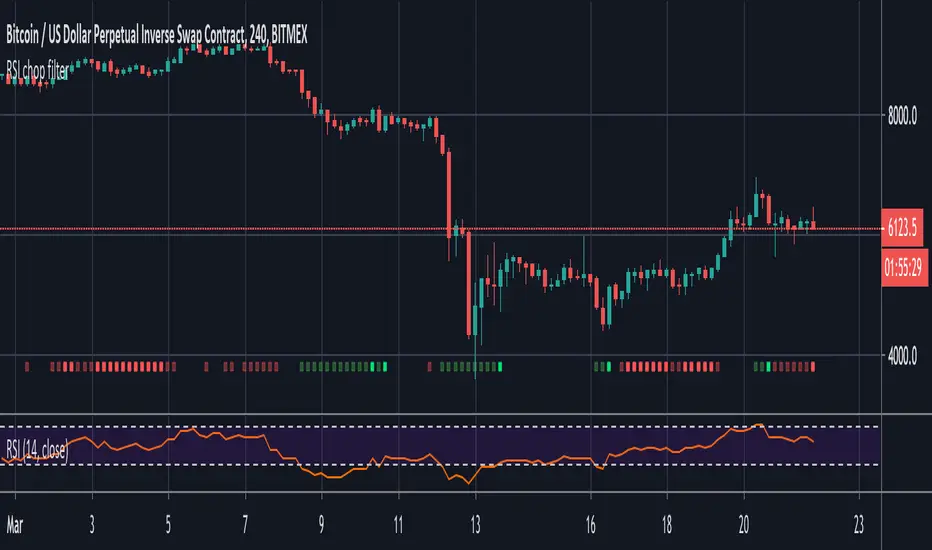
RSI chop filterThis demonstrates how you might filter your signals using RSI, but the same technique could be applied to Stochastic RSI and any other oscillator that has overbought and oversold conditions.
Use it as a visual indicator to determine when to enter a trade:
Red = Chop zone (no trade)
Bright red = Tight chop (dear god stay away)
Green = Overbought or oversold (signals permitted)
Bright green = Crossing up/down (take the trade)
To apply the filter, simply add 'and not chop' after your conditions as seen in the commented out example.
Trend MeterUse as a supplementary Indicator to confirm your entries, but it is as good on it's own.
When you first apply the indicator to your chart make sure you shrink it down It looks a lot better that way
The indicator consists of 3 different Trend Meters and a Trend Bar which are used to confirm trend
As a bonus Possible Momentum Setup entries based on Stochastics are marked as well, these are very Powerful however please use with caution
How to Use
The more Trend meters are lit up the better
Look for Support or Resistance Levels for price to be attracted to
Find confluence with other indicators
Enter Long above the Setup Bar
Enter Short Below the Setup Bar

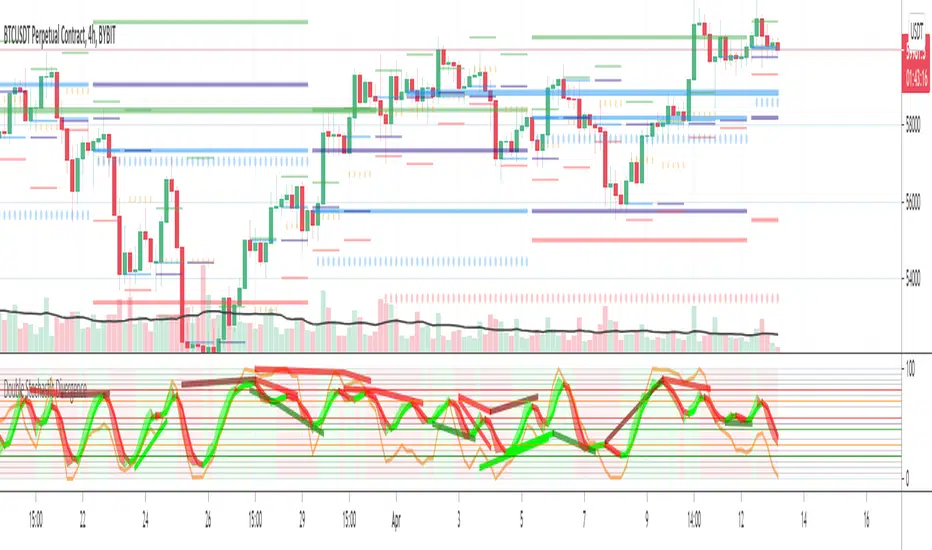
Double Stochastic DivergenceSame as my protected script but you can now see the code
This Study plots divergences and overlays a second %K as a fractal and changes the color of %D for the non fractal
Option to use Stochastic RSI for Fractal
Background Shading according to trend
Feel Free to change the indicator values to suit your style / system
The divergence script is thanks to @RicardoSantos, I've just adjusted it to suite my indicator
Remember that divergences work best when traded with the trend or very late in a trend when going against the trend
Common value for %K is 5, I have chosen 3 as it gives faster entries when using multiple time frames
If you are not using a momentum indicator as a trailing stop and using only cycle indicator
then I would recommended %K be 4 for exits