Williams %R & RSI with Multiple PeriodsDESCRIPTION
1. Calculates %R and RSI with multiple period lengths.
1 period length value is defined by User.
8 period length values follow User's selection of classic number sequences, e.g. Fibonacci, Leonardo, Lucas, Narayana, etc.
2. User selects which indicator and periods to display or hide.
DEFAULTS
%R default custom period: 10.
RSI default custom period: 14.
%R & RSI default number sequence periods: Lucas numbers 11, 18, 29, 47, 76, 123, 199, 322.
CALCULATIONS
%R = (period high - most recent period's close price)/(period high - period low)
RSI = 100 - 1 / (100 + RS), where RS = SMMA(up, period) / SMMA(down, period)
PURPOSE
1. Identify price trends.
CREDITS
1. Williams %R technical analysis momentum oscillator by Larry Williams.
2. Wilder's Relative Strength Index technical analysis momentum oscillator by J. Welles Wilder.
3. "Solarized" color scheme by Ethan Schoonover.
MFI
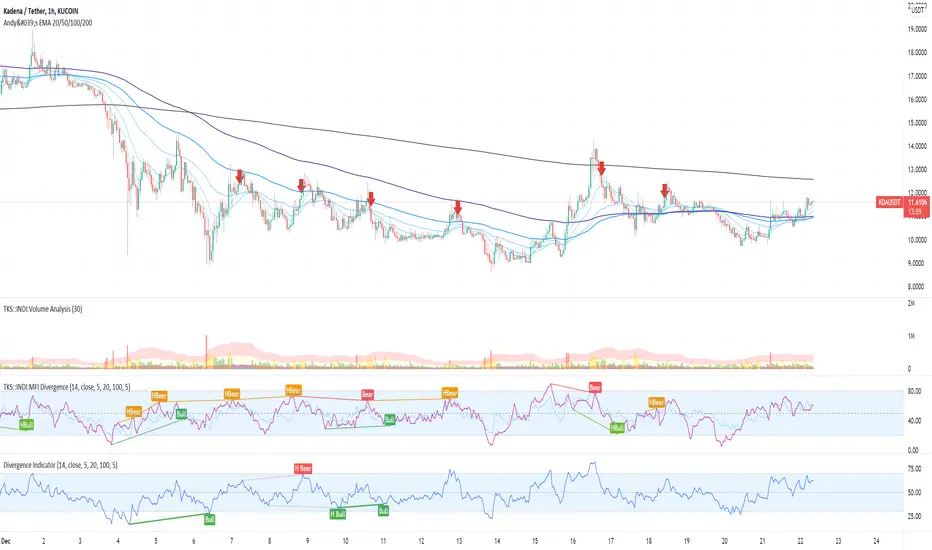
MFI Divergence Indicator Our Developer Malin converted the built-in RSI divergence indicator to MFI (Money Flow Index).
How to apply?
Notice 1: MFI, unlike the RSI, incorporates volume. It thus is an indicator of a higher precision when it comes to finding the the moment to sell - or - the moment to enter.
Notice 2: In Ranging Markets MFI (and RSI) is a solid momentum indicator to buy or sell. The asset displayed shows a slight markdown. Thus, we are looking primarily for short positions. Once can tell by us omitting the first 2 hidden bearish divergence signals and then entering the market.
Notice 3: Divergences depend on pivot points. The drawback with pivot points is that it is a lagging indication of a potential reversal. The more time (bars) one takes to confirm a reversal the less profitable is the trade - but less risky. In the charts one can tell that we enter the market 5 bars later. Usually that is not the tip of the reversal.
Notice 4: One must adapt the left and right periods of the indicator to risk/reward ratio, length of swing / frequency modulation and volatility of the price action.
Credits: Credits go to the Tradingview Team for delivering the original code. And Malin for the conversion. Please keep the copy right as a courtesy.
The Divergent (Pro) - Advanced Divergence IndicatorAutomated divergence detection with unparalleled customizability for any market on TradingView.
This is the Pro version of The Divergent - Advanced Divergence Indicator .
The Pro version contains everything that is in the Basic version, plus:
1. Access to a 2nd indicator, called "The Divergent's Companion"
By applying the companion indicator to the same chart you have The Divergent on, you will have the divergence lines and labels plotted on your price chart as well:
2. Hidden Divergences
While the Basic version can only detect Regular Divergences, the Pro version can detect both Regular and Hidden Divergences:
3. Seven more oscillators to detect divergences on
The Basic version comes with the two most popular oscillators, the MACD and the RSI.
With the Pro version you get access to 7 more oscillators:
- CMF (Chaikin Money Flow)
- Stochastic RSI
- MFI (Money Flow Index)
- TCI (Trading Channel Index), also known as WaveTrend
- Balance of Power
- CCI (Commodity Channel Index)
- Awesome Oscillator
4. Alerts
With the Pro version you can set up alerts on The Divergent indicator, allowing you to get alerted to one of the following events:
1. Regular Bullish Divergence
2. Hidden Bullish Divergence
3. Regular Bearish Divergence
4. Hidden Bearish Divergence
5. Pivot Low Confirmed
6. Pivot High Confirmed
5. Divergence Verification
The Pro version allows you to measure the quality of the detected divergences.
With divergence verification enabled, The Divergent will tell you how many times a particular divergence "played out", i.e. how many times a bullish or bearish divergence has actually resulted in the change in price in the direction predicted by the divergence. You can configure the price % levels which are used to categorise the divergences as valid or invalid (or unknown).
6. Use the signals in your own Pine Script strategy / indicator
The Pro version comes with access to a Pine Script Library called The Divergent Library .
Just add The Divergent onto the same chart you have your strategy on, link the two together using a "source" input, and use the functions in the library to process the signals from The Divergent :
You can think of The Divergent being a DaaS ( D ivergece a s a S ervice)!
7. Customise the look of the divergence lines and labels
The Pro version allows you to change the style of the divergence lines and labels:
---

Oversold / OverboughtMy first script. Based on RSI , CCI , RVI, and MFI . You can customize overbought or oversold thresholds for any indicator.
If you have any ideas - welcome.
Disclaimer
This is not financial advice. Trade on your own risk.

SMART4TRADER - Bill Williams Market Facilitation IndexThis indicator is written by 🔴 correct formula and for the correctness of the data is used by the Security function for the correct data request name from the open schedule, and not as usual with a similar ticker.
1️⃣ volume grows and MFI grows ➖ Green bar occurs when a growing volume and market dynamics. It signals us forward (down or up), that is, the number of transactions in the market is growing and they move the market in one specific side. Usually this bar is useless to enter the market, as the movement is already going, but it is very useful to determine the correctness of our entrance. In other words, if we are already in the market and see "green light" when a market hiking, for example, down, then we can be confident in the correctness of our entrance.
2️⃣ volume decreases and MFI decreases - Fuchsia (pink) ➖ "fading" bar appears in case of falling interest in the market in players, that is, the number of transactions (teak volume) decreases, and the market freezes (motion slows down). In trade, this bar is practically useless, although it often appears on the top of the first wave of Elliot.
3️⃣ volume decreases, and MFI grows - gray ➖ "fake" bar manifests when the activity of the market is growing with a decrease in volumes. This is an ambiguous bar and no sense from him. It is just necessary to understand that the market is moving, despite the decline in the activity of participants.
4️⃣ volume is growing, and MFI is reduced - blue ➖ "squatting" bar, perhaps the most interesting bar, since all movements end in a squatting bar, which may be, but not necessarily at the very bottom (vertex), and maybe near (one two bars). As stated in the book of Bill Williams, all the main trends end with the "squat" bar, which is among one of the three bars in the top or base.
--------------------------------
Этот индикатор написано по 🔴ПРАВИЛЬНОЙ ФОРМУЛЕ🔴 и для корректности данных используется функция SECURITY для правильного запроса данных имено с открытого графика, а не как обычно с похожего тикера.
1️⃣ Объем растет и MFI растет ➖ зеленый бар возникает при растущем объеме и динамике рынка. Он сигнализирует нам движение вперед (вниз или вверх), то есть количество сделок на рынке растет и они двигают рынок в одну определенную сторону. Обычно этот бар бесполезен для входа в рынок, так как движение уже идет, но он очень полезен для определения правильности нашего входа. Иными словами, если мы уже в рынке и видим «зеленый свет» при походе рынка, например, вниз, то мы можем быть уверенным в правильности нашего входа.
2️⃣ Объем снижается и MFI снижается – фуксия (розовый) ➖ «Увядающий» бар появляется в случае падения интереса к рынку у игроков, то есть количество сделок (тиковый объем) уменьшается, и рынок замирает (движение замедляется). В торговле этот бар практически бесполезен, хотя он часто появляется на вершине первой волны Эллиота.
3️⃣ Объем снижается, а MFI растет – серый ➖ «Фальшивый» бар проявляется, когда активность рынка растет при снижении объемов. Это неоднозначный бар и толку от него особо никакого нет. Просто надо понимать, что рынок движется, несмотря на снижение активности участников.
4️⃣ Объем растет, а MFI снижается – синий ➖ «Приседающий» бар, пожалуй, самый интересный бар, так как все движения заканчиваются приседающим баром, который может быть, но не обязательно в самом дне (вершине), а может быть рядом (один-два бара). Как говорится в книге Билла Вильямса, все основные тренды заканчиваются «приседающим» баром, который находится среди одного из трех баров в вершине или основании.

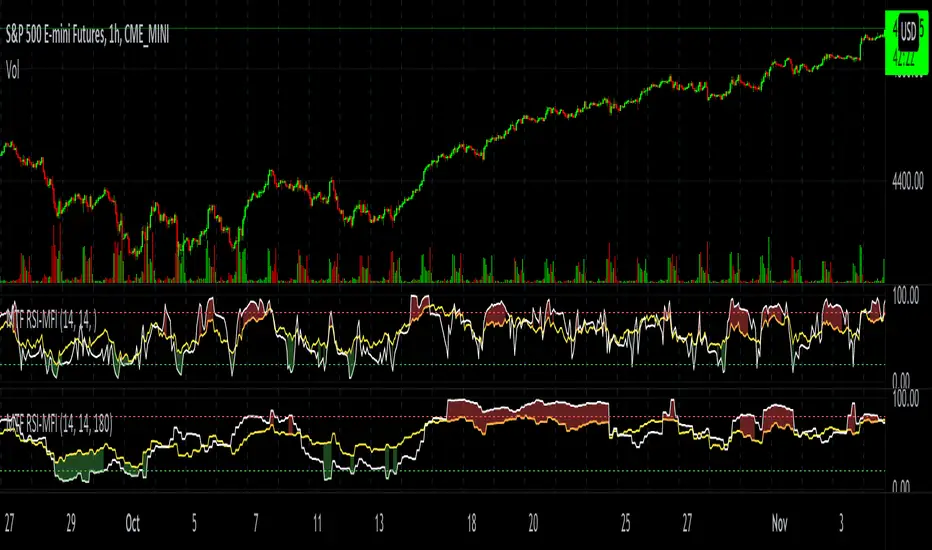
MTF RSI-MFIThe script plots both RSI and MFI of security, automatically highlights oversold and overbought conditions and allows for calculating indicators on timeframes other than the chart.
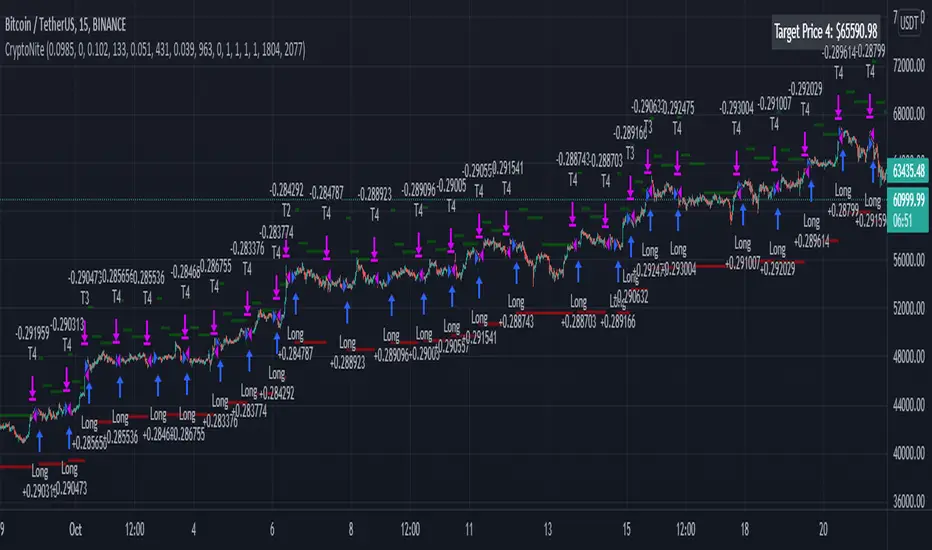
CryptoNite - Machine Learning Strategy (15Min Timeframe)Greeting Traders! I am back with another ML strategy. :D I kept my word with combining my machine learning algorithms from Python and integrating them into Tradingview. Thanks to Tradingview's new release of Pinescript v5 it is now possible. This strategy respects the Sortino Ratio and was created using 2 years of data for 50 different cryptocurrencies. That is a total of 100 years of data and 44,849 trades to create this strategy. Now let me tell you, my computer and I are exhausted. We both been at it non-stop for about two months everyday. I refine the strategy, and the computer runs 24/7 for a few days to spit out the best results into the terminal. It's been a good run so my computer will finally get some sleep tonight.
So let's talk a little about the features of the strategy. In the settings window, you'll see the Stoploss, Take Profit Parameters, and Date Range. You can change the Date Range, but I recommend to leave the SL/TP parameters how they are because the machine learning algo chose those input. If you wish to change them you are always welcome to do so but backtest results will change. For the Take Profit parameters you'll see on the left side you something labeled time duration(displayed in minutes) and on the right side you'll see take profit values. Let's talk a little bit how they work.
TP_values = {
"0": 0.102,
"133": 0.051,
"431": 0.039,
"963": 0
}
In python, the table looks like this but it is quite easy to understand in Tradingview.
From 0-133 minutes, the strategy is looking to the reach target point 1 at 10.2% profit.
From 133-431 minutes, the strategy is looking to the reach target point 2 at 5.1% profit.
From 431-963 minutes, the strategy is looking to the reach target point 3 at 3.9% profit.
From 963+ minutes, the strategy is looking to break even at 0% profit on target point 4.
Through each target point a sell trigger is active. It will look for the best time to sell even if TP has not been reached.
This helps the trade not stay open too long.
The last thing I need to mention is the textbox displayed on the right side of your chart. This textbox displays the current Take Profit value in dollar amount. So when you're in a trade you'll know what TP target has to be reached when the open trade is active. Throughout time, the target price changes depending how long the trade has been open. If you have any questions feel free to comment down below, and enjoy this strategy!
Ultimate Bullish Divergence for RSI MFI RVSI OBV w/ Buy SignalsThis strategy is based on the Indicator below and includes all of its features.
This version Includes the Strategy tester and a dynamic SL
The only drawdown of this version is that Alerts are not as customizable
Ultimate Bullish Divergence for RSI OBV RVSI MFI w/ Buy Alerts

Ultimate Bullish Divergence for RSI OBV RVSI MFI w/ Buy AlertsThis Indicator detects Divergence based on multiple Pivot points instead of just one.
- You can detect divergence on these Oscillators:
- RSI, RVSI, MFI, TRIX RSI, OBV and more soon
You can detect bullish and hidden bullish divergence:
- bullish divergence: Oscillator makes a higher low while price is making a lower low
- hidden bullish divergence: Oscillator makes a lower low while price is making a higher low
ranges where it should look for Divergence:
- To reduce false positives you are able to define and combine the following ranges:
- Manual Ranges: you’re able to type in the ranges that you came up with your manual technical analysis
- Auto Fib Ranges: option to only look for divergence below/above/within multiple Fibonacci levels
- Oversold limit: option to only look for divergence below a certain Oscillator Level
- EMA Ranges: Only look for divergence if below/above/within certain EMA's
- VWAP Ranges: option to only look for divergence below/above/within VWAP levels
Multiple options of waiting for confirmation:
- Waiting for X candle closes
- Wait for a price bounce
- Wait for an Oscillator to Oscillator EMA cross
- Wait for EMA cross (coming soon)
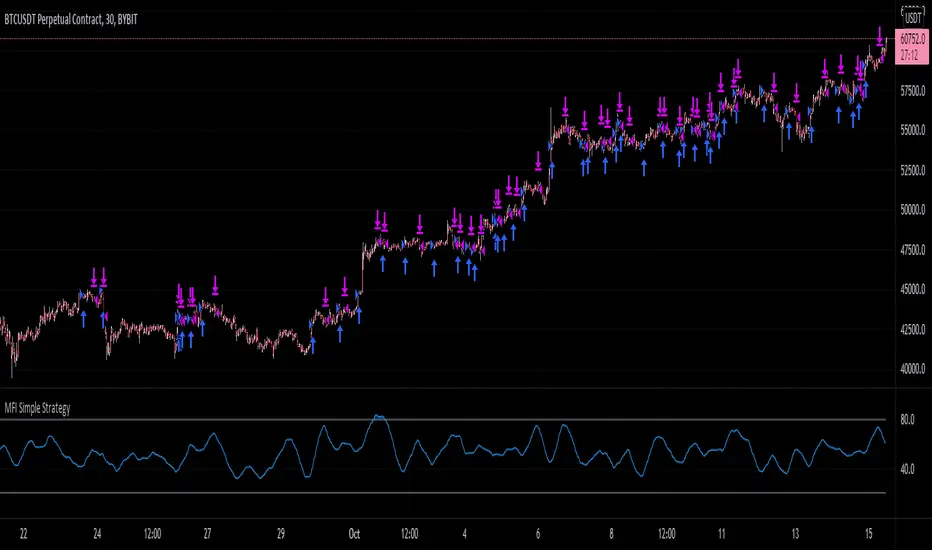
MFI Simple StrategyHere I've made a simple strategy based off a simple moving average of an MFI length.
Back tested on a BYBIT:BTCUSDT 30m chart.
Conditions:
---When the price is above the golden SMA of 200 bars---
- Buy: when MFI is moving up
- Sell: when MFI is moving down
- Stop: golden SMA of 200 bars
If you would like alerts:
1.) Add the strategy to your chart,
2.) Go to "Create Alert",
3.) Select "MFI Simple Strategy" in your alert creator,
4.) Select whatever notifications settings or message settings,
5.) Finally, click "Create" and you're good to go.
Disclaimer: Please do your own research before making any decisions financially. Past results do not guarantee future results.
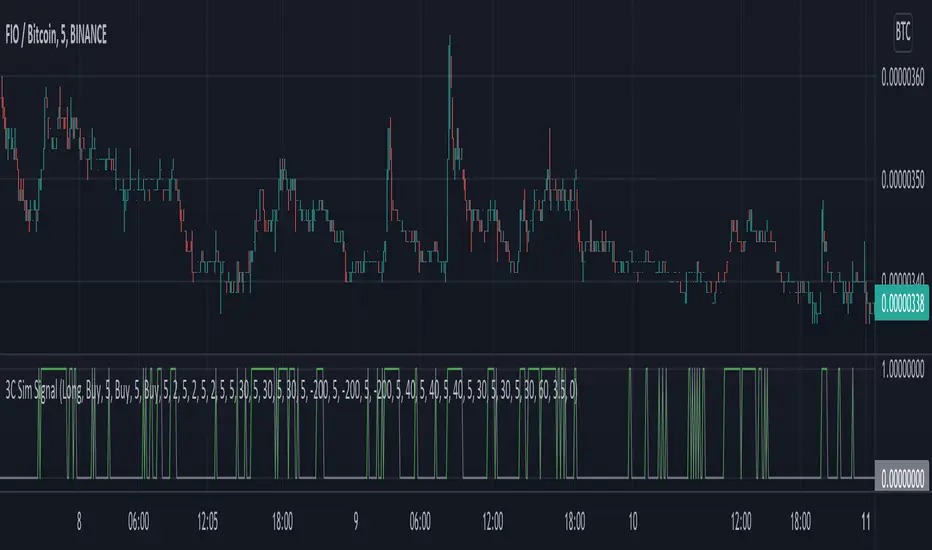
3C Sim SignalThis indicator offers the same deal start conditions available on Backtest script but now as an external signal so you can not only backtest but also set up alerts.
You can use the backtest script to backtest this indicator as an external signal and then once happy with the backtest results send directly tradingview alerts to your own bots on any exchange.
It supports most of the deal start conditions currently available for DCA bots on binance.com for example:
- TV technical ratings: buy, sell, strong buy, strong sell.
- RSI
- MFI
- CCI
- Ultimate Oscilator
- QFL
- min volume filter
Once added to the chart it will plot one when the deal start condition is true and zero when is not.
The conditions can be used in long or short strategy mode.
The biggest advantage compared to using it separately from the DSC already available in the backtest script is that because this is a separated study it will perform faster than the backtest and it resolves repainting issues. This two aspects make these indicator better suited for real time trading while still being able to connect to the backtest as an external indicator therefore still backtestable.
Now you can backtest symbols on any exchange and once your strategy is ready you then can send alerts directly to your bots.
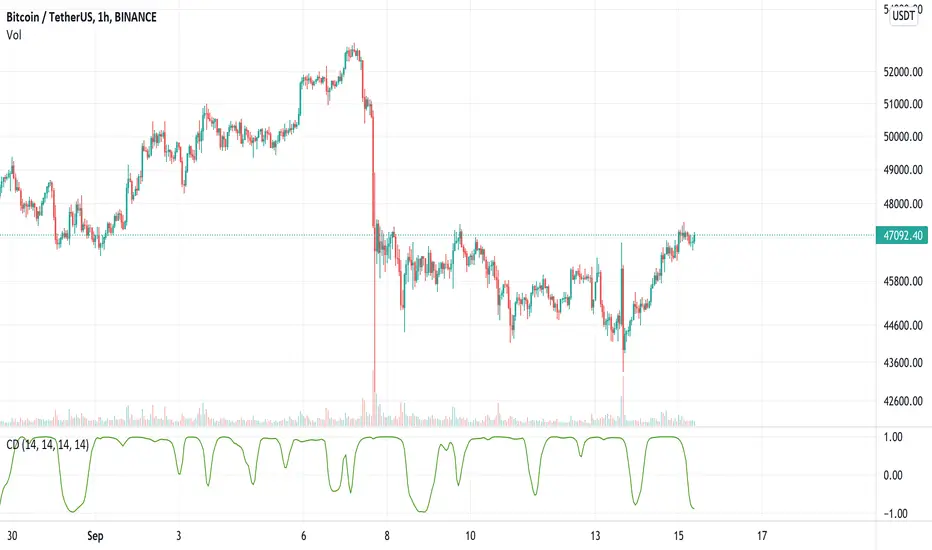
Continuous DivergenceDivergence is generally measured on the RSI and limited to finding either:
1. higher highs on the price and lower highs on the RSI (bearish divergence)
2. lower lows on the price and higher lows on the RSI (bullish divergence)
Continuous Divergence (CD) does two things differently. Firstly, it uses the MFI as its primary source of data, due to its volume component giving it higher accuracy. Secondly, it doesn't measure discrete divergence - i.e. between peaks and troughs - but rather a continuous divergence measurement.
Essentially it is measuring at any given time, the correlation between the price and the MFI. This is smoothed with a moving average (configurable) to get cleaner lines.
CD is used to detect both a slowing down of momentum on the current trend, and a reversal of trend due to changing momentum.
Kifier's MFI/STOCH Hidden Divergence/Trend BeaterMFI/STOCH Hidden Divergence/Trend Beater
General Idea:
My premise around this strategy was to make a general strategy for crypto that would help out with finding entry positions for when you’re bullish on a crypto and want to hold on for a while, and at the same time avoiding massive drops. Essentially a way to mix long term/ swing trading; I somewhat achieved my goal however it still requires a lot of logic tuning of the trend averages.
I’m a huge proponent of volume indicators and coupled with average closing price, I think this gives a really good idea of what is happening with the market. It gives an idea on the market and retail investor sentiment. This generally gives you logical entry positions (Although I don’t know how amazing that will work with all cryptos, there’s a fine line between a good strategy and one that just rides bubble market conditions, some would argue that’s still a success and others not)
How it works:
There are many components to the strategy that try to do different things:
First of all there are two types of entries, a MFI hidden divergence with a STOCH check, essentially it will only fire when a divergence is detected while STOCH is above 50%, however this might be changed in the future as due to the volatile nature of cryptos, the STOCH is not too effective. The second entry is a simple MFI/STOCH trend, if STOCH is above 50% and the trend is detected to be in a trending long, once a MFI crossover over the 50% line is detected an entry is placed, this is designed to get out profit where the divergence would otherwise be less accurate during strongly trending conditions.
-MFI is a great indicator, as a volume weighted momentum indicator I find it the most accurate of all, the STOCH however is a great indicator to get a general picture of simple market conditions and can filter out the emotional noise of retail investors.
-VWMA and an SMA (The bottom oscillator) gives an idea of the trend tacking into account of the volume, this serves as a more short term filter of the trend for filters.
-OBV checks are done between the OBV and an EMA of the OBV, to get the idea of a volume weighted long trend, which is important for crypto as there are massive rallies to go up due to retail greed, it’s great to jump onto it at the beginning, and get off before the stack of cards fall apart.
-ATR is used to detect when the market is relatively just ranging or moving sideways, which is where the hidden divergence entries are done, during predictable and profitable market conditions.
- Stop loss is based on the closest support of the entry, this is a nice medium of room to breath but also an actual stop loss.
Future plans and improvements:
Currently there’s a lot I want to improve, mostly the divergence detection and the overall sharpe ratio could be much better, but the current value of 0.5 gives me hope that the strategy is onto something. I also want to change TP from a percentage stop to something more dynamic but that might be too optimistic. The current plan is to paper trade test this either by manual or by a python bot, to see how it performs with some user input as well.

[MFI] Market Facilitation Index Written by Bruce-JSH
Implemented MFI(Market Facilitation Index) of Buff Dormeier
no license, no copyright.
There are no obligations or restrictions on you no matter how you do this script.
version 2021.07.11.a
1. First public release
2. G => Green(++), D => faDe bar(--), K => faKe bar(-+), S => Squat bar(+-)
Dynamic SMAThis script uses dynamic length to create a different sma type.
The length of the "Dynamic SMA" - "dSMA" can be:
'RSI', 'Stoch', 'ATR', 'MFI' or '%R'
For example 'RSI' -> the length of the sSMA will be the RSI itself
The biggest challenge was:
'Pine cannot determine the referencing length of a series. Try using max_bars_back' error
The writer of 'referencing length of a series' issue gave following solution:
bar_index == 0 ? 4999 : len
or in case of values which don't go above 100:
bar_index == 0 ? 100 : len
This assigns the necessary buffer to the function.
I'm most grateful for the given solution!
These dSMA's can give Support/Resistance levels, also crossovers of different dSMA's can give extra information
Examples:
RSI
ATR (close / atr(len)
Stoch
MFI
%R
"show regular SMA" will show the "SMA" with the same length (with default lighter color)

VWMA with kNN Machine Learning: MFI/ADXThis is an experimental strategy that uses a Volume-weighted MA (VWMA) crossing together with Machine Learning kNN filter that uses ADX and MFI to predict, whether the signal is useful. k-nearest neighbours (kNN) is one of the simplest Machine Learning classification algorithms: it puts input parameters in a multidimensional space, and then when a new set of parameters are given, it makes a prediction based on plurality vote of its k neighbours.
Money Flow Index (MFI) is an oscillator similar to RSI, but with volume taken into account. Average Directional Index (ADX) is an indicator of trend strength. By putting them together on two-dimensional space and checking, whether nearby values have indicated a strong uptrend or downtrend, we hope to filter out bad signals from the MA crossing strategy.
This is an experiment, so any feedback would be appreciated. It was tested on BTC/USDT pair on 5 minute timeframe. I am planning to expand this strategy in the future to include more moving averages and filters.

Chart OscillatorI present you the chart oscillator where an oscillator (Stoch or RSI) is plotted
on the chart itself (instead of below the chart)
It is inspired on an idea of @Kablamicus
Instead of having the lines between 0 and 100, here the '0-100' are
- lowest(low, len)
- highest(high, len)
An overbought/oversold and a middle line is derived from these lines
and the oscillator goes in between.
It resembles very much the 'normal' oscillator, with a few extra's:
- you can see the movement of the candles against the oscillator
- S/R levels of oscillator, 50 line, overbought/oversold line, 0-100 line
Stoch:
RSI:
Also a table is included with the Stoch/RSI values
Cheers!

CCI/MFI/VZO/RSI - HEATMAPHeatmap I made/reverse engineered.
Currently tracks the 4 following oscillators:
- CCI (Channel Commodity Index)
- MFI (Money Flow Index)
- VZO (Volume Zone Oscillator)
- RSI (Relative Strength Index)
Any feedback or suggestions highly appreciated.
/* Inspiration taken from @ByzantineGeneral (TradingView profile: /u/ByzantineGeneral, indicator: /script/keAGdnWO-Byzantium-Oscillator-Heatmap) */

RMIRMI is a combination of RSI and MFI oscillators which considers money flow and strength of supply or demand together.
It estimates that the money of which side is being ran out.
So the power of trends can be predictable approximately.
Where the green columns appear, it means demand is very high and it can fall because buyers may withdraw and sell their assets.
And when red columns appear, it means supply is very high and sellers or new buyers may enter into new deals which may increase the price of a asset.
I would be glad if I hear your feedbacks.
ModestPips RSI + Apirine Slow RSIThis script is composed of 4 elements:
EMA Cross Indicator
Money Flow Indicator Oversold/Overbought
RSI with divergence indicator
Apirine Slow RSI
EMA Cross:
The EMA Cross provides a rough idea of trend direction. The 50 horizontal line will flash green/red depending on the current EMA crossover status.
The EMA values can be changed depending on your preference.
This indicator is not used for entries. It only provides confluence for entries.
Money Flow Indicator:
The money flow indicator will flash green/red in the background when it is oversold/overbought. It could be referred as an early signal before a potential big move.
Not used for entries, just as a warning to get ready for a potential big move.
RSI Indicator:
Typical RSI that shows indicates when divergences are detected
Apirine Slow RSI:
Generates OB/OS signals & midline crossover signals and divergence
Configured with high smoothing to show trends in the markets (This value can be adjusted). When maxed out in either direction, can help to identify strong trends in the market.
Thanks to @Lazybear for providing the code for the slow RSI.

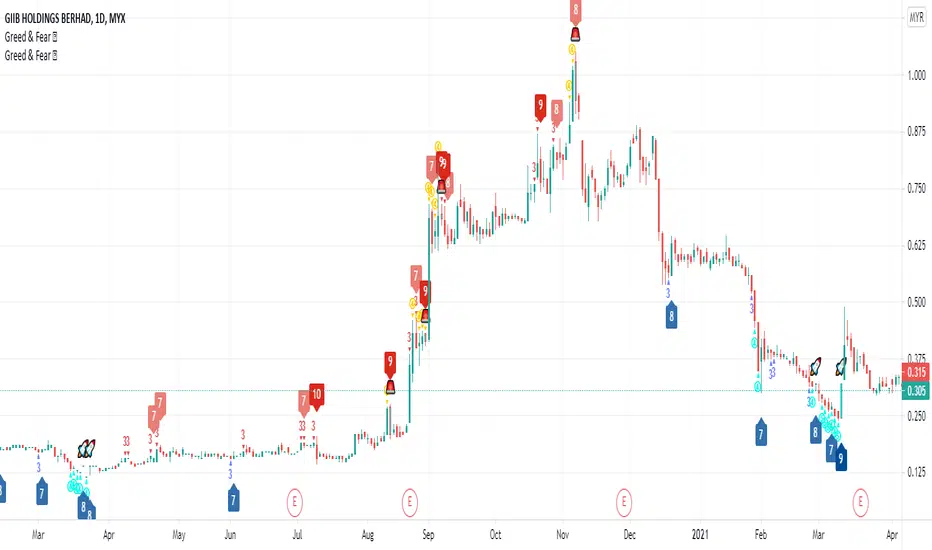
Greed and Fear ScoreHi All,
This is Greed and Fear Score script. The uses of this indicator is to let users know what is the state for each bar closed.
Warren Buffett once said that it is wise for investors to be “fearful when others are greedy, and greedy when others are fearful.
Greed & Fear Score (range from 1 - 5) has taken multiple measurements into consideration such as CCI, MFI, RSI, RVI and William %R.
The range of score is from 1 - 5 indicating weak to strong.
Red/Yellow represents Greed score.
Blue/Light Blue represents Fear score.
The Bull & Bear Transition Score (range from 1 - 10) is to measure how strong power needed to reverse the Greed or Fear State.
It is a powerful tool that incorporates CMF, MFI, CCI, MOMENTUM, OBV, RSI, RVI, WILLIAN %R, PRICE OSCILLATOR and Relative Volume.
How to use Bull & Bear Transition Score?
The higher the Bull & Bear Score, the more likely it will change from one state to another.
How to find BEST opportunity? Here comes the special symbol.
User can choose best fit combination by using filtering.