Max/Min Custom Sessions and Day Before - MarposIt takes the maximum and minimum session prices according to the entered time ranges and display them on the screen. When those values are reached, it marks them as taken.
Additionally, it displays the values and how much they moved in PIPs during those sessions in a table in the top left corner using the difference between max and min values.
Also, mark the background of the sessions on the chart according to the entered time ranges.
Furthermore, draw the D-1 highs and lows for each day to see the previous day's possible liquidity levels. It doesnt mark them as Taken when that happens because i couldnt realize how to do it, yet :).
Any questions or suggestions, feel free to contact me and ill do my best.
MIN

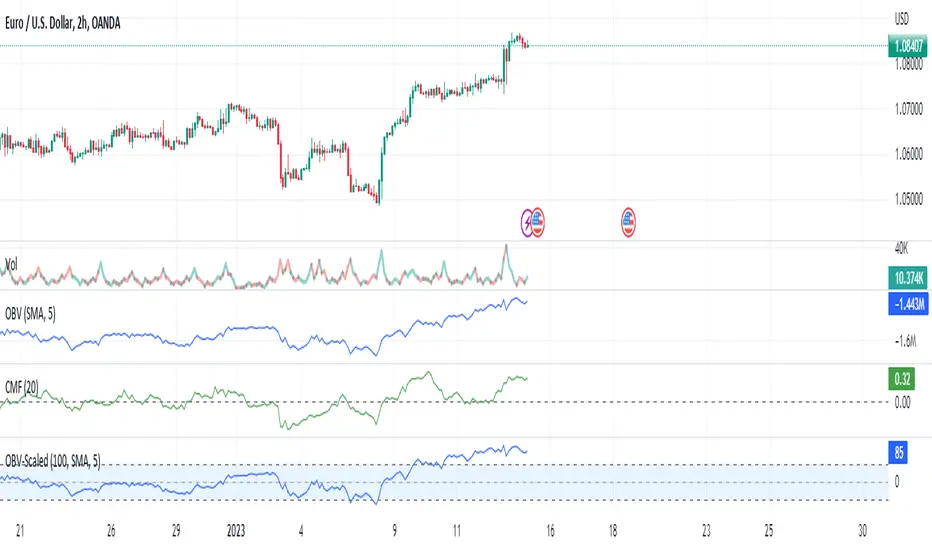
On Balance Volume Scaled - OBV ScaledThe main idea of this oscillator is to place the OBV oscillator and its oscillation around the range of 0 and around -50 to +50 and for this scaling of the "On Balance Volume" oscillator, I have used Min-max normalization.
Since this oscillator does not have a specific minimum and maximum, just setting the maximum and minimum does not seem the best thing to do. As in this case, we will constantly observe sudden changes and we will have problems such as volatility. On the one hand, we will constantly deal with sudden changes and problems such as volatility. Also on the other hand, the continuous collisions of the high/low(+50 & -50) and index and returning from that is another thing that we are going to deal with.
Therefore, to solve these problems and create more flexible maximum and minimum ranges, another similar method has been used. Choosing the maximum of our normalization to the size of the moving average of 100 candles of the index maximum and choosing the minimum of normalization to the size of the moving average of 100 candles of the minimums of the OBV index, and then normalizing the OBV index with the Min-max method with those ranges, is the recommended method ,which has been used to eliminate problems. In this case, we will not have any problem hitting 50 and returning or hitting -50 and returning. Also, our scaled OBV index will have the ability to touch and cross 50 and -50 and can fluctuate without problems.
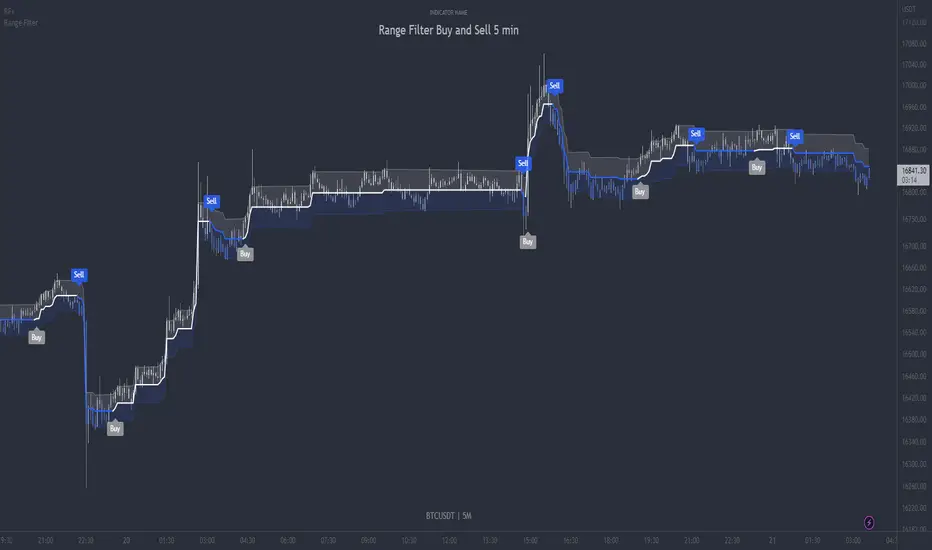
Range Filter Buy and Sell 5min - guikroth versionRange Filter Buy and Sell 5min - the @guikroth version, republished.
Since this popular version of the Range Filter is no longer available via the original author, I republish it here under the same name.
This version remains true to the guikroth version from the calculations to the default settings and comments in the code, with the exception of an update to the latest version of PineScript, minor styling adjustments and the addition of an all-in-one 'buy or sell' alert option.
The guikroth version was a simplified modification of the original Range Filter by @DonovanWall .
Including having just 3 bar colours based on the filtered price trend, different source input options to the original, and the addition of buy and sell signals and alerts based upon the Range Filter colour change. It consisted of just three inputs; source, sampling period, and range multipler. With the update to version 5, external indicators can also be used as inputs, for example using a VWAP or EMA loaded on your chart as the input on the Range Filter is now also possible.
What is the Range Filter?
As the author of the original Range Filter describes it:
"This is an experimental study designed to filter out minor price action for a clearer view of trends. Inspired by the QQE's volatility filter, this filter applies the process directly to price rather than to a smoothed RSI .
First, a smooth average price range is calculated for the basis of the filter and multiplied by a specified amount.
Next, the filter is calculated by gating price movements that do not exceed the specified range.
Lastly the target ranges are plotted to display the prices that will trigger filter movement.
Custom bar colors are included. The color scheme is based on the filtered price trend."
Popularity of the Range Filter
The Range Filter is a very popular and effective indicator in its own right, with adjustments to the few simple settings it is possible to use the Range Filter for helping filter price movement, whether helping to determine trend direction or ranges, to timing breakout or even reversal entries. Its practical versatility makes it ideal for integrating it's signals into a variety of trading strategies or even other indicators.
With many thanks to the authors of the previous and original versions; @guikroth and @DonovanWall .
Rets High/Low (2.0 Special Uncensored Edition)This script can be used as a visual aid in seeing the last highs and lows of price in a specific time period. It automatically updates the plots if new highs or lows are made within the given lookback period.
This is a fairly basic version currently, with new added features coming in future updates such as range between high/low and half and whole number detection.

Artharjan Volume AnalysisHi,
I have created Artharjan Volume Analysis indicator dashboard which gives following information about the volume to the traders.
It has two rows. The first row containing volume information is for the Daily Timeframe and the second row containing volume information for any other timeframe of your choice (Basically Chart timeframe)
It gives following information about volume to the traders.
1] Current Volume in Lakhs (Not in Millions) since this script was made keeping in mind Volumes of the Scripts traded in Indian Stock Exchanges. 1 Lakh = 1,00,000
2] Change from its previous Volume. If the change is positive it will be highlighted in Green else in Red.
3] 25 period SMA of the Volume (This period is a Long Term Moving Average and its a customizable parameter which can be changed in Indicator Settings)
4] Current Volume as a percentage of Long term SMA( Volume). If the percentage is positive it will be highlighted in Green else in Red.
5] High Volume during the Lookback period
6] Low Volume during the Lookback period
7] Is current Volume equal to Min Level or Max Level? Or its between Min Max Levels.
8] Is the current Volume rising over past 5 candles or is it falling over past 5 candles or its Swinging? (Short Term Period which is a customizable parameter and it can be changed in the Indicator Settings)
9] Current Volume as a percentage of Short term SMA( Volume). If the percentage is positive it will be highlighted in Green else in Red.
The 1st row will be shown only when the Chart Timeframe is a Daily Timeframe.
The 1st and the 2nd row will be shown only when the Chart Timeframe is not a Daily Timeframe.
With this information regarding volume, traders can identify whether the current volume is at its Highest Levels or at its Lowest Levels, can identify whether volume is rising or volume is falling in accordance to the price action and then take trading decisions.
I hope you would enjoy using this indicator in your day to day trading journey.
Regards
Rahul Desai
@Artharjan.

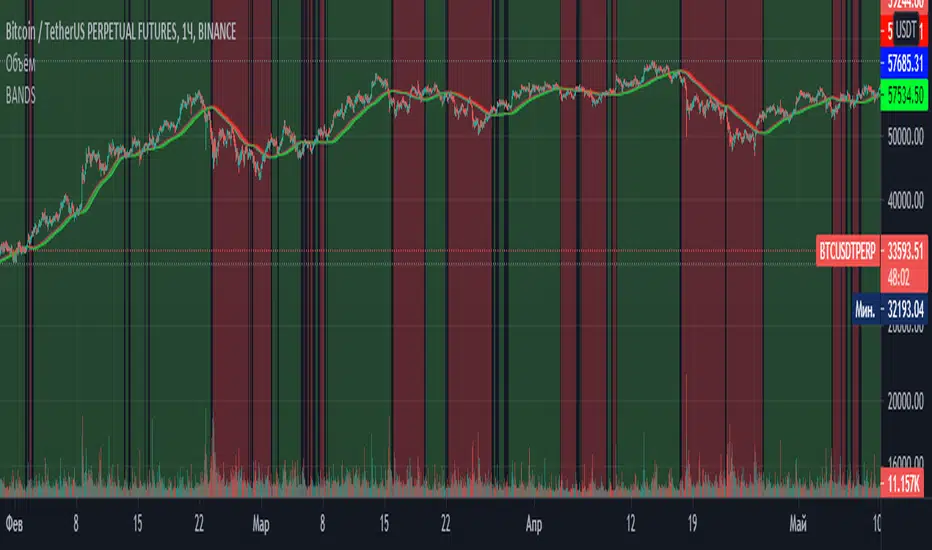
BANDSTrend indicator. It is based on a simple moving average, the maximum and minimum of this moving average for the period. When the moving average coincides with its maximum for the period , the trend is rising, when the moving average coincides with its minimum for the period, the trend is falling. The optimal periods should be selected for each timeframe and trading instrument.
Realtime All-Time High and All-Time Low Tracker [WIP]This is a study intended to port the work of /u/QuantNomad's "Kozlod - All-time high/low alerts" to pine version 4 without giving any alerts. It is intended to capture the most extreme points on any given price chart in real time, the absolute high and absolute low points. Ideally, the plotted lines would strictly diverge from one another in opposite directions and widen with new highs or lows on a hypothetical "all-time" resolution.
Most of the original code was replaced and I'm trying to resolve a bug where the script fails to register new highs or lows while at the same time making sure that earlier data is plotted correctly. If applied to an asset that has not yet recovered , is just too new, or has not achieved a lower low than its opening price, this indicator ceases to function correctly. This would not be an issue if pine script was more general purpose and had something similar to Python's max(list) function.
Any and all suggestions are welcome. This is simply to serve as a springboard for any programmers trying to design algorithms or strategies that use these variables on any price chart.
Happy Hunting!
- Patch Hemlock

CC - PVT CloudsReleasing this test script for PVT ratios using sub-interval harmonics at a 1D, 4H, 1H, 45M, 15M and 5M level.
It basically takes the PVT values for a rolling periodic interval and gets the (avg - min)/max for that interval (the ratio).
Then it colors it based on the subinterval next to it. Just think of it as rolling Ichimoku clouds, but in real-time using PVT.
I'm not saying much more than that, as this is an experimental indicator. Feel free to use it and give me feedback.
Drop a like if this helps you trade, but please do not use these indicators as a DIVINING ROD for your trades.
However, I will possibly release a paid version with TEXTUAL take profit/stoploss indicators.
*DISCLAIMER*
No amount of technical indicators will safe you from a lapse in Due Diligence or Market/Industry Judgement.
I am not responsible for lost equity due to trades caused my relying on this indicator.

clouded pastSearch indicators for "clouded" to find this one, and add to your chart.
Takes lowest(min) and highest(max) of several bars,
averages that over several bars,
shifts by half of the middle of those two bar numbers,
and colors the inbetween by candle color.
You can choose 3 parameters.
Please give feedback, or donation.
Thanks.

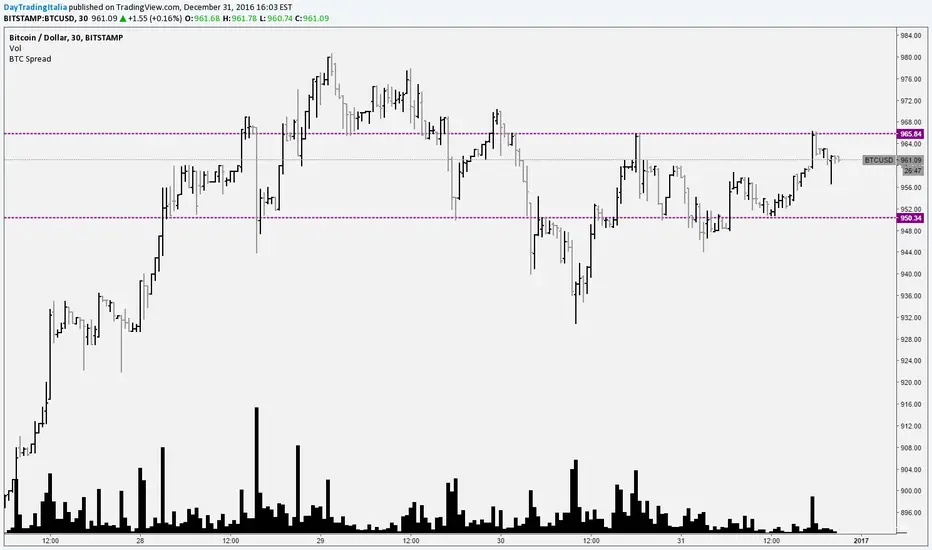
Bitcoin SpreadIt selects the min/max price for btc/usd from a set of exchanges and shows them on the chart. It is possible to add or remove exchanges by editing the source code
FIRST 5-MINUTES ZONE AND HI-LO BRKOUTS..!FIRST 5-MINUTES ZONE
--------------------------------
This script displays the first 5-Minutes high and low range zone and shades in gray color for identification of the zone.
HIGH - LOW BREAKOUT
----------------------------
As we all know that a stock's best breakout level is its previous day's high or low. Hence I designed the script to automatically draw a line when the LTP is near or crossing Previous day's high or Low price, so that we can be sure in taking trading decisions.
And added 30-EMA also
PR.HIGH BREAKOUT
------------------------
PR.LOW BREAKOUT
------------------------
- hope this may be a little help for you traders for taking decisions.
- HAPPY WEALTHY TRADING
cheers
SANJAY RAMANATHAN

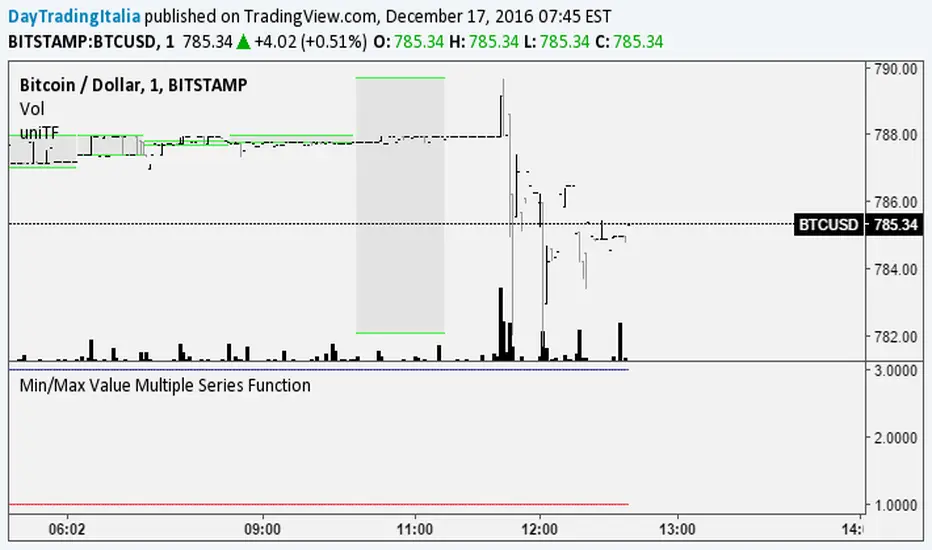
Min/Max Value Multiple Series FunctionTrying different solutions to find the minimum/maximum value in a set of predefined series
Adaptive Donchian ChannelThis indicator adds a level of adaptivity to the simple Donchian Channel by adjusting the sensitivity (lookback periods) of the channel's upper and lower bounds based on the amount of time that has elapsed since the price has hit/expanded the channel boundaries. Comparing the results of this indicator to the standard Donchian Channel, the readier level of responsiveness may prove self-evident.
METHODOLOGY:
Specifically, the more recently the channel was expanded in one direction, the longer the lookback period grows in that direction. Conversely, if the channel has not been expanded in a given direction, the lookback period will contract so as to allow for a tighter channel.
For example, let the initial lookback period be 20 bars and let the factor argument be 0.1 (or 2 bars to start, as 20*0.1 = 2). Now say the current bar sets a new 20-period high. Then the lookback period for the upper bound is expanded by 2 bars to 22, and the lookback period for the lower bound is contracted by 2 bars to 18, thereby making it simultaneously harder to set new highs and easier to set new lows (and vice versa for hitting new lows). If neither a new high nor a new low is formed, both periods contract by the given factor.
