Markov 3D Trend AnalyzerMarkov 3D Trend Analyzer
🔹 What Is a Markov State?
A Markov chain models systems as states with probabilities of transitioning from one state to another. The key property is memorylessness: the next state depends only on the current state, not the full past history. In financial markets, this allows us to study how conditions tend to persist or flip — for example, whether a green candle is more likely to be followed by another green or by a red.
🔹 How This Indicator Uses It
The Markov 3D Trend Analyzer tracks three independent Markov chains:
Direction Chain (short-term): Probability that a green/red candle continues or reverses.
Volatility Chain (mid-term): Probability of volatility staying Low/Medium/High or transitioning between them.
Momentum Chain (structural): Probability of momentum (Bullish, Neutral, Bearish) persisting or flipping.
Each chain is updated dynamically using exponentially weighted probabilities (EMA), which balance the law of large numbers (stability) with adaptivity to new market conditions.
The indicator then classifies each chain’s dominant state and combines them into an actionable summary at the bottom of the table (e.g. “📈 Bullish breakout,” “⚠️ Choppy bearish fakeouts,” “⏳ Trend squeeze / possible reversal”).
🔹 Settings
Direction Lookback / Volatility Lookback / Momentum Lookback
Control the rolling window length (sample size) for each chain. Larger = smoother but slower to adapt.
EMA Weight
Adjusts how much weight is given to recent transitions vs. older history. Lower values adapt faster, higher values stabilize.
Table Position
Choose where the table is displayed on your chart.
Table Size
Adjust the font size for readability.
🔹 How To Consider Using
Contextual tool: Use the summary row to understand the current market condition (trending, mean-reverting, expanding, compressing, continuation, fakeout risk).
Complementary filter: Combine with your existing strategies to confirm or filter signals. For example:
📈 If your breakout strategy fires and the summary says Bullish breakout, that’s confirmation.
⚠️ If it says Choppy fakeouts, be cautious of traps.
Visualization aid: The table lets you see how probabilities shift across direction, volatility, and momentum simultaneously.
⚠️ This indicator is not a signal generator. It is designed to help interpret market states probabilistically. Always use in conjunction with broader analysis and risk management.
🔹 Disclaimer
This script is for educational and informational purposes only. It does not constitute financial advice or a recommendation to buy or sell any security, cryptocurrency, or instrument. Trading involves risk, and past probabilities or behaviors do not guarantee future outcomes. Always conduct your own research and use proper risk management.
Momemtum

Aqua MTF Trend Oscillator——————————————————————————————————————————————————————————
The Aqua Multi-Timeframe (MTF) Trend Oscillator is a comprehensive momentum and trend analysis tool designed to synthesize
complex market dynamics into a single, intuitive oscillator. It moves beyond single-timeframe analysis by aggregating
trend information from up to five distinct, user-configurable sources—spanning different timeframes, symbols, and
moving average types.
--- CORE CONCEPT ---
The strength and direction of a trend are rarely uniform across all market perspectives. This indicator's core
principle is to quantify and weigh the trend's character from multiple angles simultaneously. By blending these
perspectives, it generates a composite score that reflects the overall "consensus" of trend momentum, providing
a more robust view than any single moving average could offer alone.
--- METHODOLOGY ---
The indicator's power lies in its sophisticated, multi-step normalization process for each analysis slot:
1. **MA Calculation:** A standard moving average (e.g., EMA, SMA) is calculated for the specified source, symbol, and timeframe.
2. **Volatility-Normalized Distance:** It first measures the deviation of price from its moving average in terms
of Average True Range (ATR) units. This volatility-normalization step is crucial for comparing trend strength
across different timeframes or instruments, as it measures distance in a context-aware manner.
3. **Magnitude Squashing:** This ATR-based distance is then passed through a hyperbolic tangent (`tanh`) squashing
function. This elegantly transforms the potentially unbounded measurement into a standardized score oscillating
between -1 (maximum bearish magnitude) and +1 (maximum bullish magnitude). This prevents extreme outliers in one
timeframe from disproportionately skewing the final result.
4. **Weighted Aggregation:** Each of these normalized (-1 to +1) scores is then combined based on a user-defined
weight. The weighted average of all enabled slots produces the final composite score.
5. **Final Scaling & Smoothing:** The composite score is scaled to oscillate between -100 and +100. An optional
final smoothing pass can be applied to this master line to reduce noise and clarify the overall trend.
All higher-timeframe calculations are performed correctly within their native context to ensure the indicator is
non-repainting and provides a stable, reliable output on the chart.
--- KEY FEATURES ---
• **Five Independent Analysis Slots:** Fully customize up to five sources, each with its own symbol, timeframe, MA type, period, and weight.
• **Advanced Normalization:** Utilizes ATR and the hyperbolic tangent function for robust, comparable trend magnitude scores.
• **Correct MTF Calculation:** Employs best practices for non-repainting data requests, ensuring historical and real-time results are consistent.
• **Weighted Composite Score:** Assign importance to different timeframes to tailor the oscillator to your specific analytical needs.
• **Optional Master Smoothing:** Apply a final MA to the composite score line for enhanced clarity and signal filtering.
• **Clear Visualization:** A simple, color-coded oscillator line shows the final trend score, while individual component trends can also be plotted.
--- HOW TO INTERPRET ---
• **Zero Line Cross:** A cross above 0 indicates that the weighted balance of trend components has shifted to bullish. A cross below 0 signals a shift to bearish.
• **Oscillator Magnitude:** Values approaching +100 suggest a strong, broad-based uptrend consensus. Values nearing -100 indicate a strong downtrend consensus.
• **Slope:** The slope of the oscillator line indicates the accelerating or decelerating nature of the aggregate trend momentum.
• **Divergence:** As with any oscillator, watch for divergences between price action and the oscillator, which can signal a potential exhaustion of the prevailing trend.
Author: Aquaritek
——————————————————————————————————————————————————————————

GOLDEN RSI by @thejamiulGOLDEN RSI thejamiul is a versatile Relative Strength Index (RSI)-based tool designed to provide enhanced visualization and additional insights into market trends and potential reversal points. This indicator improves upon the traditional RSI by integrating gradient fills for overbought/oversold zones and divergence detection features, making it an excellent choice for traders who seek precise and actionable signals.
Source of this indicator : This indicator is based on @TradingView original RSI indicator with a little bit of customisation to enhance overbought and oversold identification.
Key Features
1. Customizable RSI Settings:
RSI Length: Adjust the RSI calculation period to suit your trading style (default: 14).
Source Selection: Choose the price source (e.g., close, open, high, low) for RSI calculation.
2. Gradient-Filled RSI Zones:
Overbought Zone (80-100): Gradient fill with shades of green to indicate strong bullish conditions.
Oversold Zone (0-20): Gradient fill with shades of red to highlight strong bearish conditions.
3. Support and Resistance Levels:
Upper Band: 80
Middle Bands: 60 (bullish) and 40 (bearish)
Lower Band: 20
These levels help identify overbought, oversold, and neutral zones.
4. Divergence Detection:
Bullish Divergence: Detects lower lows in price with corresponding higher lows in RSI, signaling potential upward reversals.
Bearish Divergence: Detects higher highs in price with corresponding lower highs in RSI, indicating potential downward reversals.
Visual Indicators:
Bullish divergence is marked with green labels and line plots.
Bearish divergence is marked with red labels and line plots.
5. Alert Functionality:
Custom Alerts: Set up alerts for bullish or bearish divergences to stay notified of potential trading opportunities without constant chart monitoring.
6. Enhanced Chart Visualization:
RSI Plot: A smooth and visually appealing RSI curve.
Color Coding: Gradient and fills for better distinction of trading zones.
Pivot Labels: Clear identification of divergence points on the RSI plot.

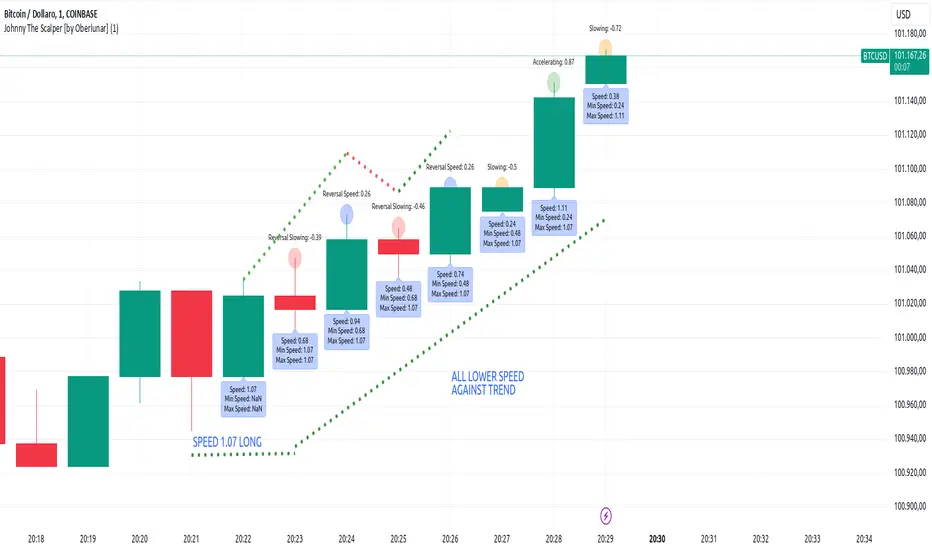
Johnny The Scalper - Momentum/Speed [by Oberlunar]The Johnny The Scalper indicator is designed to provide scalpers with insights into market momentum and speed dynamics by analyzing the price movement within candles. It calculates the "candle speed," defined as the range of a candle (high minus low) divided by the elapsed time in seconds since the candle opened. Users can customize the distance for comparison by specifying how many candles back the indicator should look when calculating the speed difference (`Diff`).
The script retrieves the speed of the specified candle from the past (`candle_speed_x`) and compares it to the speed of the current candle, calculating the difference (`speed_difference`). The indicator also identifies whether the current candle and the candle from the past are bullish (green) or bearish (red), using this information to interpret the dynamics of the difference.
If the difference is negative, it means the current candle's speed is slower than the reference candle's speed. A negative difference combined with candles of the same direction suggests a slowdown, while candles of opposite directions indicate a slowing reversal. A positive difference suggests that the current candle is faster. If the candles have the same direction, it signifies an acceleration in the current trend; if their directions differ, it indicates a faster reversal.
The results are displayed graphically as labels on the chart. Labels above the candles show the difference Diff with color-coded backgrounds based on the calculated dynamics:
orange for a slowdown in the same direction,
red for a slowing reversal,
green for acceleration in the same direction,
and blue for a faster reversal.
An additional label below the candle optionally displays the current candle's speed in real time. This indicator helps scalpers identify momentum shifts and potential reversals in a highly customizable manner, adapting to different trading strategies and timeframes.
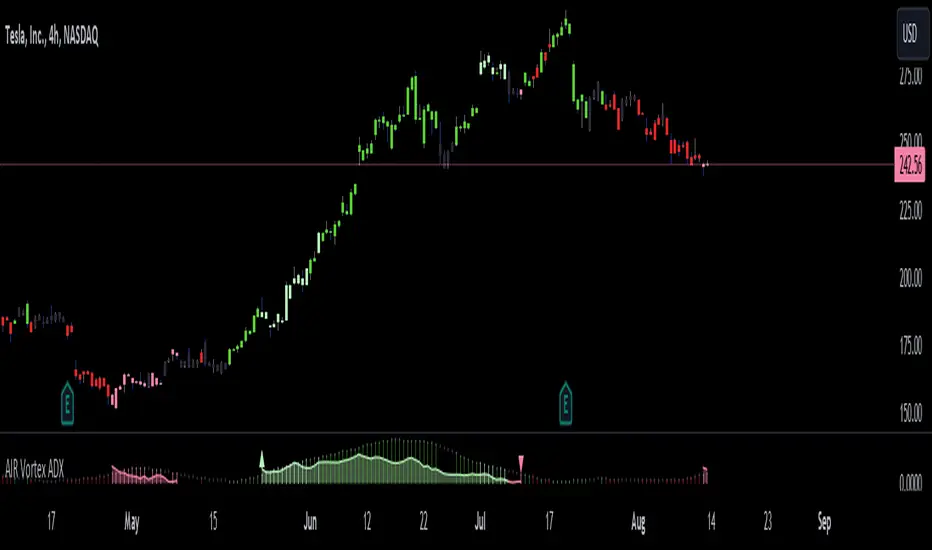
AIR Vortex ADXThis project started as an effort to improve the user interface of the hybrid indicator ADX of Vortex, which is, as per the name, a blend of ADX and Vortex Indicator. Plotting both indicators on the same polarity and normalising the vortex, a better interpretation of the interaction between the two is possible, and trend becomes apparent.
Basically, the Vortex provides the bright punch and ADX the continuation of the trend and momentum.
A range mixer has been added to the vortex, comprising both true and interpercentile ranges (see my previous script for a desrciption of interpercentile range). Users can activate and add amounts of each as they see fit.
Finally, there is an RSI filter, the idea of which is to filter out ranging (flat) markets, where no distinct direction is yet emerging.
SPX-Sectors % PMO Above Zero [bluesky]█ OVERVIEW
The "Subsector-11 % PMO Above Zero" script analyzes market breadth based on the percentage of 11 user-adjustable subsector ETFs of the S&P 500 with a Positive Momentum Oscillator (PMO) value greater than or equal to zero. It provides insights into the strength and breadth of positive momentum signals within specific subsectors, aiding traders in making informed decisions.
█ CONCEPTS
This script utilizes the PMO values of the 11 user-adjustable subsector ETFs of the S&P 500 to assess market breadth. By calculating the percentage of subsector ETFs with a PMO value above zero, it identifies periods of broad positive momentum and potential trading opportunities within those specific sectors.
█ PMO (Positive Momentum Oscillator)
Developed by Carl Swenlin, the PMO is an oscillator based on a Rate of Change (ROC) calculation that is smoothed twice with exponential moving averages using a custom smoothing process. The PMO is normalized, allowing it to be used as a relative strength tool. Traders can rank subsector ETFs based on their PMO values as an expression of relative strength.
█ CALCULATION
The script calculates the percentage of subsector ETFs with a PMO value above zero based on the provided PMO values of the 11 user-adjustable subsector ETFs. It uses custom smoothing functions similar to Exponential Moving Averages (EMAs) to derive the PMO values.
█ HOW TO USE IT
- Timeframe: Optimize the script for different timeframes to analyze market breadth effectively within specific subsectors.
- Subsector Analysis: The script displays the percentage of subsector ETFs within the 11 user-adjustable subsectors of the S&P 500 with a PMO value above zero, indicating the strength of positive momentum signals within those subsectors.
- Trend Identification: Monitor changes in the percentage of subsector ETFs above zero to identify shifts in market breadth and trends.
- Risk Management: Consider the breadth of positive momentum signals within specific subsectors when setting stop-loss levels or evaluating overall market conditions.
█ ADDITIONAL OPTIONS
This script offers additional options to enhance analysis and customization:
- Candle Style: Choose from different candle styles such as Heikin Ashi, Three Line Break, Candles, or Line for chart visualization.
- PMO Settings: Adjust the lengths of the PMO calculation and signal length according to your trading preferences.
- Moving Average Settings: Incorporate the usage of fast and slow exponential moving averages (EMAs) for additional insights into momentum trends.
█ FLEXIBILITY AND ADAPTABILITY
The script allows traders to adjust the subsector ETF names according to their specific requirements. Please review and update the list of subsector ETFs periodically to reflect the desired sectors for analysis and ensure the script's relevance and accuracy.
█ DISCLAIMER
Trading involves risks, and past performance is not indicative of future results. The "Subsector-11 % PMO Above Zero" script is a tool designed to assist traders in analyzing market breadth and positive momentum signals within specific subsectors. It should be used in conjunction with sound risk management practices and a comprehensive trading strategy. Traders are encouraged to perform their due diligence, exercise caution, and adapt the script to their individual trading preferences and requirements.
Please note that this script does not make any claims of guaranteed profitability or provide investment advice. Always consult with a qualified financial professional before making any investment decisions.

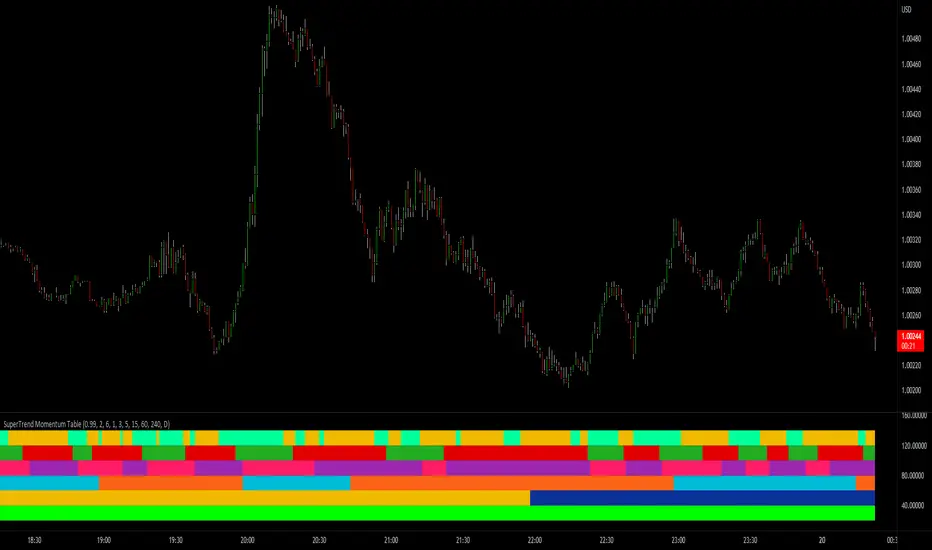
SuperTrend Momentum TableMy goal creating this indicator : Provide a way to see the Past and Current Momentum of multiple different timeframes without using multiple charts.
The Underlying Concept / What is Momentum?
The Momentum shown is derived from a Mathematical Formula, SUPERTREND. When price closes above Supertrend Its bullish Momentum when its below Supertrend its Bearish Momentum.This indicator scans for bullish & bearish Momentum on the Timeframes selected by the user and when there is a shift in momentum on any of those time frames (price closes below or above SUPERTREND ) it notifies the trader with a color change on the Momentum Table.
Back Testing: This indicator will be key for back testing with the SuperTrend-Support-Resistance indicator
since the SuperTrend Momentum Table shows you the visual shift in momentum. Giving the Trader a Clear visual on how Each Support and Resistance Level was made .
Technical Inputs
- If you want to optimize the rate of signals to better fit your trading plan you would change the Factor input and ATR Length input. Increase factor and ATR Length to decrease the frequency of signals and decrease the Factor and ATR Length to increase the frequency of signals.
Quick TIP! : You can Sync all VFX SuperTrend Indicators together! All VFX SuperTrend indicators display unique information but its all derived from that same Momentum Formula. Keep the Factor input and ATR Length the same on other VFX SuperTrend indicators to have them operating on the same data.
Timeframe Inputs
- The indicator has 7 Time frame Displays where you can choose which Time Frames you would like to monitor.
- You can limit the amount of time frames being displayed by changing the Time Frame Amount
Display Inputs
- The trader can specify the bullish and bearish color of all 7 Timeframes
- You can toggle (on or off) the Momentum Switch if you want to highlight the exact candle where momentum switched from bullish to bearish and from bearish to bullish .
How it can be Used ? Check the momentum of other Timeframes and use that information as a variable to structure your trading plan.
- Use Momentum information to track the trend
- Plan and limit trades based on the current Momentum of multiple timeframes
- See if you have higher momentum to fuel your trades
- See breakouts on Multiple Time Frames
SuperTrend Momentum Chart(My goal creating this indicator) : Provide a quick way to check the current momentum of multiple timeframes. The Smart Momentum Chart was intended to be a live trading tool that should be used when a trader has already defined his edge and no longer needs the past Momentum data.
The Underlying Concept
What is Momentum ?
The Momentum shown is derived from a Mathematical Formula SUPERTREND , when price is above SUPERTREND its bullish Momentum and when its below SUPERTREND its Bearish Momentum. This indicator scans for candle closes on the timeframes you've selected and when there is a shift in momentum it notifies the trader with a color change and an alert if one was set up.
Technical inputs
- If you want to optimize the rate of signals to better fit your trading plan you would change the Factor input and ATR Length input. Increase factor and ATR Length to decrease the frequency of signals and decrease the Factor and ATR Length to increase the frequency of signals.
Quick TIP! : You can Sync all VFX SuperTrend Indicators together! All VFX SuperTrend indicators display unique information but its all derived from that same Momentum Formula. Keep the Factor input and ATR Length the same on other VFX SuperTrend indicators to have them operating on the same data.
Time Frame Inputs
- Your able to fill the chart with up to 8 timeframes
- If You don't need all 8 you can limit the amount to display by changing the "Time Frame Amount"
Display Inputs
- You can change the size of the chart and the color of the text
- You can toggle ON if you want to be signaled when a momentum switch occurs ( bullish to bearish or bearish to bullish )
- Your able to pick the Bullish and Bearish Colors of the Momentum switch
How it can be used ?
- Easily check the momentum of other Timeframes and use that information as a variable in your trading plan.
- quickly glance and know the momentum of any time frame before you enter any trade
- always know the momentum of the higher time frames
- Eliminate the need to switch from current chart
- Get an abundance of information in one location
- Have clear variables to structure your trades around

SuperTrend Entry(My goal creating this indicator) : Provide a way to enter the market systematically, automatically create Stop Loss Levels and Take Profit Levels, and provide the position size of each entry based on a fix Percentage of the traders account.
The Underlying Concept :
What is Momentum?
The Momentum shown is derived from a Mathematical Formula, SUPERTREND. When price closes above Supertrend Its bullish Momentum when its below Supertrend its Bearish Momentum. This indicator scans for candle closes on the current chart and when there is a shift in momentum (price closes below or above SUPERTREND) it notifies the trader with a Bar Color change.
Technical Inputs
- If you want to optimize the rate of signals to better fit your trading plan you would change the Factor input and ATR Length input. Increase factor and ATR Length to decrease the frequency of signals and decrease the Factor and ATR Length to increase the frequency of signals.
Quick TIP! : You can Sync all VFX SuperTrend Indicators together! All VFX SuperTrend indicators display unique information but its all derived from that same Momentum Formula. Keep the Factor input and ATR Length the same on other VFX SuperTrend indicators to have them operating on the same data.
Display Inputs
- The indicator has a candle overlay option you can toggle ON or OFF. If toggled ON the candles color will represent the momentum of your current chart ( bullish or bearish Momentum)
your able to change the colors that represent bullish or bearish to your preference
- You can toggle on which shows the exact candle momentum switched sides
your able to change the colors that represent a bullish switch or bearish switch to your preference
- The trader can specify which point you would like your stop loss to reference. (Low and High) Which uses the Low of the Momentum signal as the reference for your Stop Loss during buy signals and the High as the reference during sell signals. Or (Lowest Close and Highest Close) which uses the Lowest Close of the Momentum signal as the reference for your Stop Loss during buys and the Highest Close as the reference during sells.
- The colors that represent your Stop Loses and Take Profits can also be changed
Risk Management Inputs
- Your Risk MANAGMENT section is used to set up how your Stop Loss and Take Profit are calculated
- You have the option to take in account Volatility when calculating your Stop Loss. A adjusted ATR formula is used to achieve this. Increase Stop Loss Multiplier from 0 to widen stops.
- Increase Take Profit Multiplier from 0 to access visual Take Profit Levels based on your Stop Loss. This will be important for traders that Prefer trading using risk rewards. For Example: If the the Take Profit Multiplier is 3 a Take Profit level 3 times the size or your stop loss from your entry will be shown and a price number corresponding to that Take Profit Level becomes available.
- Enter your current Account size, Bet Percentage and Fixed Spread to get your Position Size for each trade
-Toggle on the Current Trade Chart and easily get the size of your Position and the exact price of your Take Profit and Stop Loss.
You can increase the Size of the Current Trade Chart= Tiny, Small, Normal, Large, Huge and change the Position of the Current
trade Chart to your preference, (Top- Right, Center, Left) (Middle- Right, Center, Left) (Bottom- Right, Center, Left).
How it can be used ?
- Enter Trades and always know where your stop is going to be
- Eliminate the need to manual calculate Position Size
- Get a consistent view of the current charts momentum
- Systematical enter trades
- Reduce information overload

Stacked EMAsStacked Daily & Weekly EMAs + Labels
Pretty much self-explanatory indicator that shows the current momentum based on the key exponential moving averages.
Three stages of the EMAs:
1. Stacked Positively (Bullish) - EMAs are stacked on top of each other which represents a healthy bullish uptrend (green Label).
2. Stacked Negatively (Bearish) - EMAs are stacked below each other meaning the trend is bearish (red label).
3. Stacked Neutral (Neutral) - EMAs are crossing each other without any clear direction = chop (yellow label).
Hope it helps.

Delta-RSI OscillatorIntroducing the Delta-RSI Oscillator.
This oscillator is a time derivative of the RSI, plotted as a histogram and serving as a momentum indicator. The derivative is calculated explicitly by means of local polynomial regression. It is designed to provide minimum false and premature buy/sell signals compared to many traditional momentum indicators such as Momentum, RSI, Rate of Change.
Application:
Potential trading signals provided by the Delta-RSI Oscillator include:
- zero crossing (negative-to-positive as a bullish sign and positive-to-negative sign as a bearish signal),
- change of direction (consider going long if the oscillator starts to advance, and short otherwise).
In addition, the strength of a particular trend can be estimated by looking at the Delta-RSI value (positive D-RSI in case of the uptrend, and negative in case of the downtrend).
Choosing the model Parameters:
-RSI Length: The timeframe of the RSI that is being differentiated.
- Frame Length: The length of the lookback frame used for local regression.
- Polynomial Order: The order of the local polynomial function.
Longer frames and lower order of polynomials will result in a " smoother " D-RSI, but at the expense of greater lag. Increasing the polynomial order while maintaining the frame length will reduce lag while producing more variance. The values set as default (Length=18, Order=2) were found to provide optimum the variance/lag tradeoff. However, other options (e.g., Length=35, Order=3) can also work well.
Relationship with other methods:
When developing this indicator, I was inspired by Connie Brown’s Derivative Oscillator. The latter pursues the same goal but evaluates the RSI derivative by means of triple smoothing. This paves the way for more clear interpretation and easier tuning of model parameters.

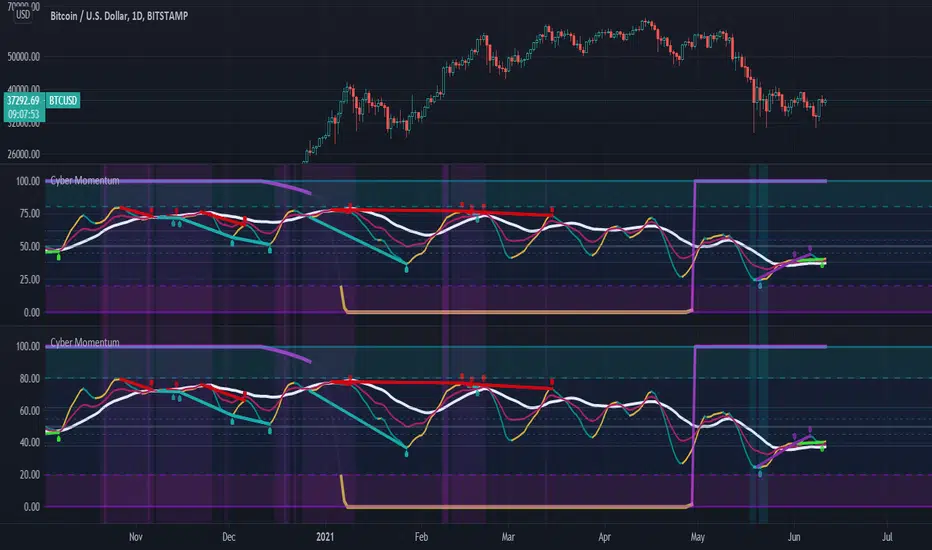
Cyber MomentumThis oscillator is the combination of different settings RSI , RSX , STOCHRSI , MSI ,... in a Stochastic function that can help traders to understand the weakness and strength of momentum in candle sticks in different time frames.
This oscillator organized by three Line , control zone and Divergence Line
1:) Fast Line
2:) Slow Line
3:) Heavy Line
4:) Neutral Zone between Fibo 38.2% & 61.8%
5:) Bullish Control Zone
6:) Bearish Control Zone
7:) Divergence Line
And there are two theories of finding tradable signals behind those parts .
The first and the most simplest theory is the situation that the Fast Line has the possibility to be supported by Slow or Heavy Lines and basically reverse its slope !!
But there are some rules and notes for this theory ... First of all the accuracy and rate of that is variable in three main categories of situation
1:) with or without price action reversal structure like reversal pattern (Head&Shoulder , Quasimodo , .... )
2:) with or without regular divergence
3:) in which control zone ?
So basically the most powerful setup occurs when price action is already in the reversal structure and the potential to have at least one drive of regular divergence exist and also the Fast Line is in the opposite control zone of the current time frame trend .... so obviously if one of those rules will not be satisfied so the signal will be the less value
The second theory is the signals that occur after the reversal, obviously a sign of trend continuation. there are two type of that you can use with this oscillator
The first one happens when price reverses its trend and this oscillator is moving to the neutral zone ... so if at least one drive of hidden divergence exist the neutral zone will have good possibility to reverse the slope of the oscillator obviously this would happen usually after hidden divergence confirmed .
and the second one is basically the first type but after the reversal Subsequently in the outside of the bullish/bearish control zone ... those kinds of signals are NOT the reversal potency signal at all !! they designed for trend continuation... be careful of them and try trade with your old friend trend ! .... also The existence of hidden divergences will be better for trade in this kind of signals .
The idea of this oscillator was inspired by @mrhashem Borjas Tarh Momentum.
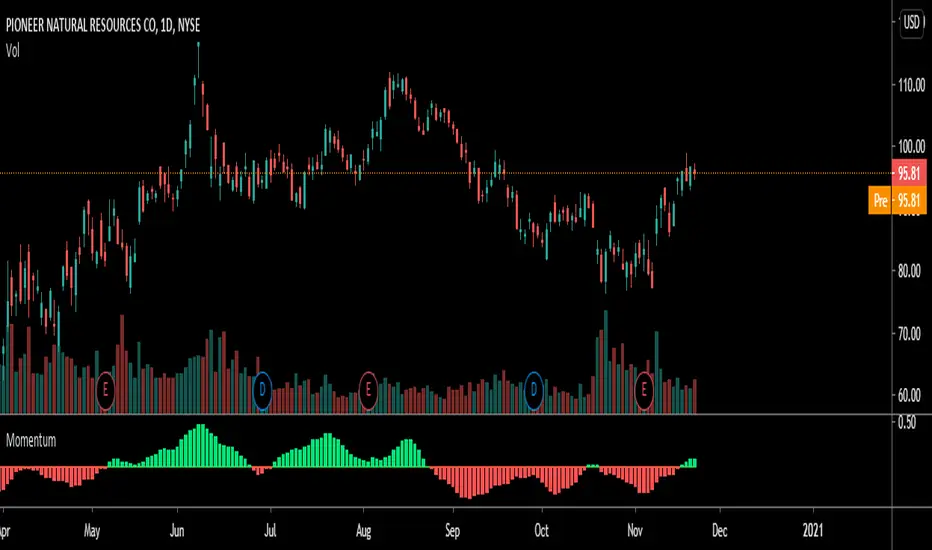
Price/Volume momentumThis indicator will help you measure when to keep adding on your longs and when to get out.
What you want to see is increasing price with increasing volume to keep adding.
You can also begin to enter a position that has changing momemtum, meaning the volume/price pair has stop going down and it's reversing.
I use this indicator with my volatility indicator and my Matrix indicator on the daily
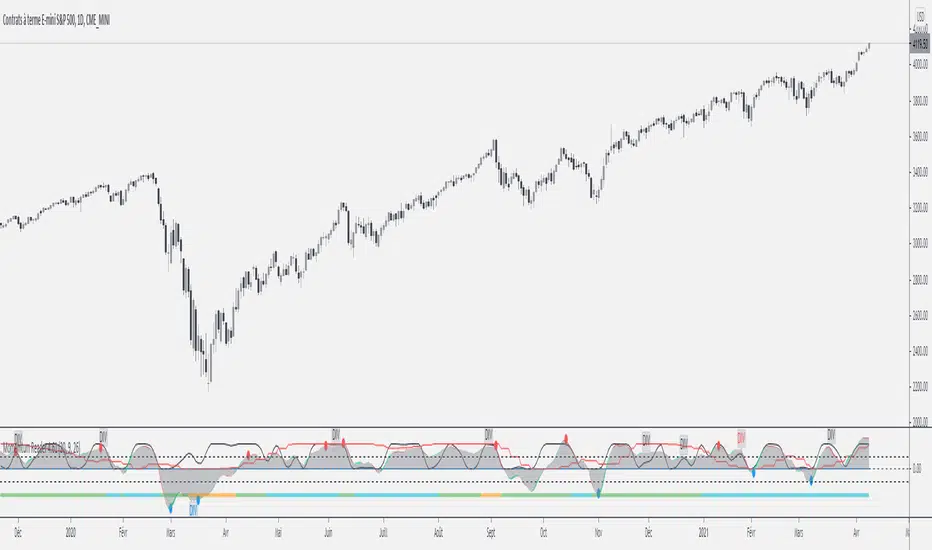
MOMEMTUM READER ULTIMATEMomemtum Reader is the complement of Market Reader it will help you to find market Top and Bottom.