WVF - OscillatorAnother attempt on making use of CM-Williams-Vix-Fix-Finds-Market-Bottoms from Chris Moody - which is arguably one of the best indicator available on pine and tradingview platform. Every time I revisit this, I get new ideas on applying this method.
I have slightly altered formula to
highest(source)-source/highest(source)
from the original formula
highest(close)-low/highest(close)
Process is simple:
Calculate WVF for OHLC values separately
Calculate momentum on each of the WVF values based on distance from moving average
Plot the candles based on OHLC momentum.
Candle color depends on whether close, open and previous close. If close is higher than open and previous close, we get green coloured candles. If close is lower than previous close and open then we get red coloured candles. In all other cases, we will have silver candles.
High/Low bands are calculated based on median of highest and lowest values of VixFix. We also plot median of close which can be used in some cases.
How to use this to find market bottom. Look for one of the below conditions:
First red candle above high band - which signals momentum of vix fix is about to fall.
First red candle above median line - can be used only if upward momentum of wvf candles are trending well.
Crossunder of wvf candles under high band.
Possible exit scenarios
Green WVF candle formed above WVF high line
Entry is taken on first red candle above median line - but, candles turned green before WVF crossing under median line - may signal our thesis is wrong and price may drop further.
Some examples.
動量指標(MOM)

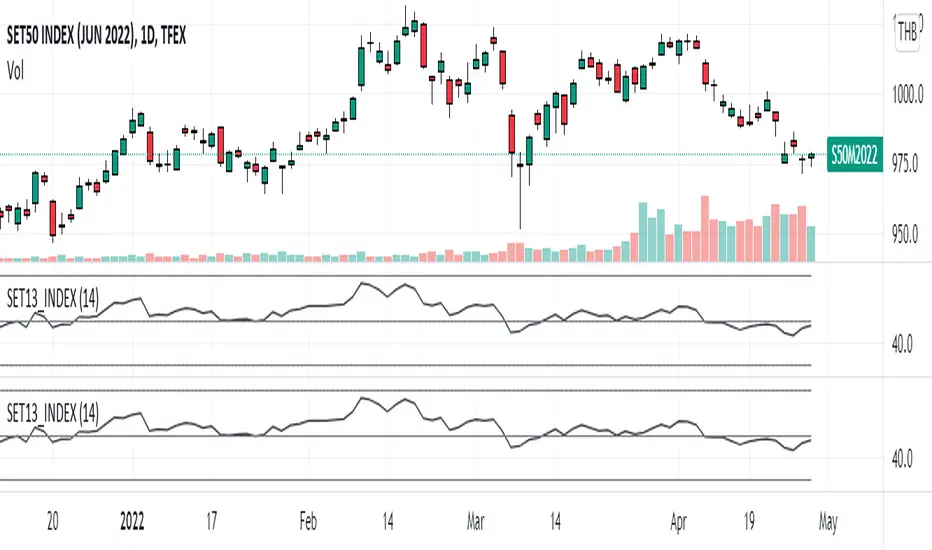
SET13_INDEXThe average RSI of top 13 marketcaptilization in SET50, as list by below.
1. PTT
2. AOT
3. ADVANC
4. CPALL
5. GULF
6. PTTEP
7. SCC
8. SCB
9. KBANK
10. BDMS
11. EA
12. OR
13. SCGP
Note that OR started trading on February 2021 so that the indicator will not appear before that period and
the top 13 marketcapiliation ranked on 22 February 2022 so pls becareful about look ahead bias.
SARCThis indicator aims to indicate the correlation between two assets(Current and Base), it does NOT show entries or help your chart analysis directly.
The main features of this Correlation indicator is :
Correlation type : Direct Correlation | Inverse Correlation | No Correlation
Correlation Percentage : as its name, it calculate the Correlation Percentage between Current and base assets if exist
Correlation Leader : If there is a correlation , it indicates which asset follows the other (Current Asset Follows Base | Base Follows Current Asset)
Correlation bars : if the box (Show Correlation Candles) on the settings was True, it will show GREEN lines above candles which have direct correlation and RED lines above candles which have inverse correlation
How to use: Chose the base asset (default: bitcoin) and open any other chart to be the other -Current- asset
inputs:
Max Lookback length : how many candles will be included in the scan.
Correlation Factor : how stronger the correlation should be to include the candle(E.g. if set to 50, if any candle correlation was less than 50 it will be ignored), If you are confused leave it as its default.
Base Asset : The base asset to calculate the current asset correlation with.
Show Correlation Candles : (True | false) explained above on the main features.
Note: this indicator uses every single candle and compare it to the base same time candle, after some time I will post another similar indicator, BUT the new one will use the whole direction of the assets instead of each candle alone, I hope one of them can help you.
For any notes on the indicator to be edited, or for another indicator ideas please comment.

Coppock Curve with Pivot Points and Divergence The Coppock Curve is a long-term price momentum indicator used primarily to recognize major downturns and upturns in a stock market index. It is calculated as a 10-month weighted moving average of the sum of the 14-month rate of change and the 11-month rate of change for the index. It is also known as the "Coppock Guide."
The Coppock formula was introduced in Barron's in 1962 by Edwin Coppock.
The Coppock Curve is a technical indicator that provides long-term buy and sell signals for major stock indexes and related ETFs based on shifts in momentum.
What Does the Coppock Curve Tell You?
The Coppock Curve was originally implemented as a long-term buy and sell indicator for major indices such as the S&P 500 and the Wilshire 5000. Often, it is used with long-term time series such as a candlestick chart, but where each candle contains a month's worth of price information.
The Difference Between the Coppock Curve and Rate of Relative Strength Index (RSI)?
The relative strength index looks at how the current price compares to prior prices, though it is calculated differently than the rate of change (ROC) indicator used in the Coppock Curve calculation. Therefore, these indicators will provide different trade signals and information.
What are those circles?
-These are Divergences. Red for Regular-Bearish. Orange for Hidden-Bearish. Green for Regular-Bullish. Aqua for Hidden-Bullish.
What are those triangles?
- These are Pivots . They show when the VPT oscillator might reverse, this is important to know because many times the price action follows this move.
Please keep in mind that this indicator is a tool and not a strategy, do not blindly trade signals, do your own research first! Use this indicator in conjunction with other indicators to get multiple confirmations.

Momentum ScoreMomentum is the tendency of assets that have gone up in price to continue going up in price - and for assets that have gone down in price to continue going down in price. The reasons behind it are not well understood by academics, but momentum is a property that exists across geographies and asset classes.
The Momentum Score is a system that scores companies based on their one year total returns, excluding the last month of returns. In other words, a momentum score for today will be based on the total returns of a stock from 12 months ago today to one month ago today.
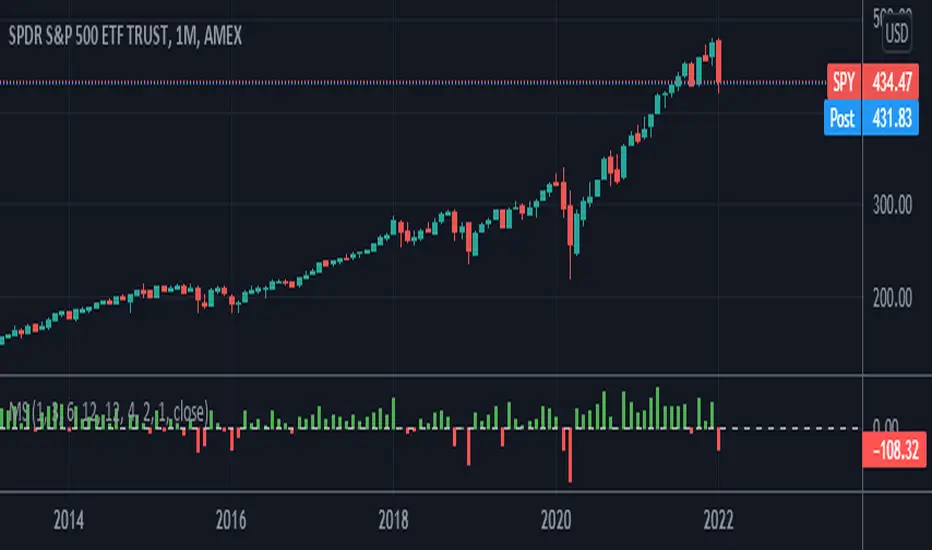
Our Momentum Score 13612W has the following composition:
MS 13612W = 12 * Roc(1) + 4 * Roc(3) + 2 * Roc(6) + 1 * Roc(12)
with ROC = (p0/pt) - 1, where pt equals price p with a t-month lag
Closing MomentumClosing momentum calculates the moving averages of closes and highs vs previous highs plus those of closes and lows vs previous lows to create momentum moving averages. Closes above/below previous highs/lows are weighted more strongly than new high or low wicks above/below a previous highs or lows.
If momentum is up, the background will shade green; brighter is stronger. If momentum is down, likewise with red.
Shifts in momentum are indicated by symbols: triangles indicate a minor shifts, arrows moderate, big arrows major. Likewise, the shade of the symbols indicates strength (darker is stronger).
Using the indicator: long continuous stretches of the same color indicate trend - deeper is stronger. If the shade is lightening or clears and/or if symbols of the other color start appearing, the trend is weakening.

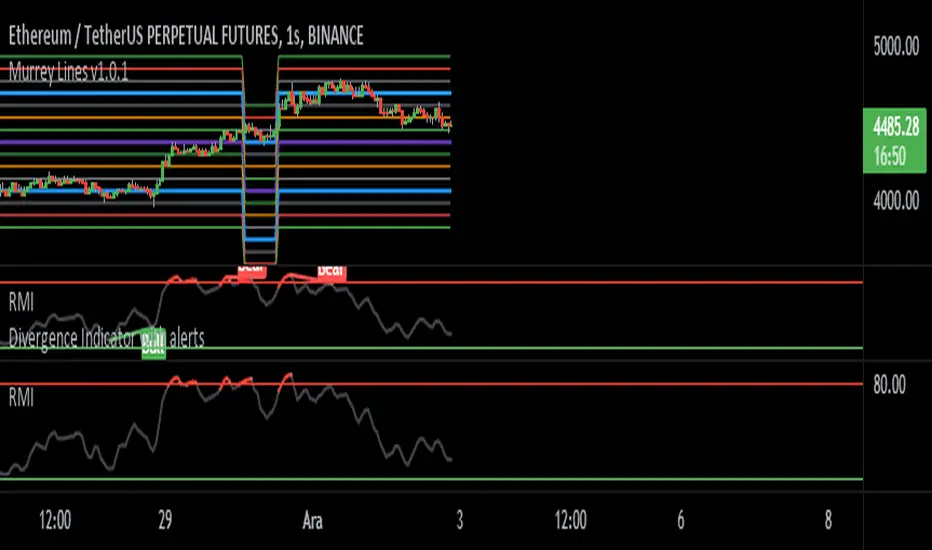
Relative Momentum Index- Fatih Küst alt 80-20 ayarlanmış momentum
Usage:
Add your favorite oscillator, RSI , Klinger , TSI, CMF , or anything else to a chart.
Click the little ... (More) on the oscillator.
Then add this indicator "Divergence Indicator (any oscillator)" on your oscillator of choice.
Click the settings on this indicator and make sure the source is set to the right plot from your oscillator.
Watch for it to plot divergences...
Add this indicator a second time on the price chart (and select the same oscillator plot), but check the box "plot on price (rather than on indicator)""
See you divergence plotted on price (as well as on the oscillator)
Jigga - Relative Strength - SectorsHi All !!
I came across relative strength concept from below indicator.
Indicator Name: (Relative-Strength by modhelius)
Note: Sorry !! Could not add indicator url here.
Formula:
RelativeStrength = (sectorValue / sectorValue ) / (indexValue / indexValue ) - 1 * 100
I used same concept and combine all sector's relative strength against Nifty50 index.
How to use:
You can change length based on your convenience and show/hide sectors.
Indicator will show strength line for that sector.
you can use this to identify momentum stocks.

Momentum Oscillator - Column PlotThis script is based on the existing Momentum Indicator which shows whether the underlying percentage change in closing price is positive or negative.
This script however uses columns to plot the change and shows this as green for >0 change, and red for <0.

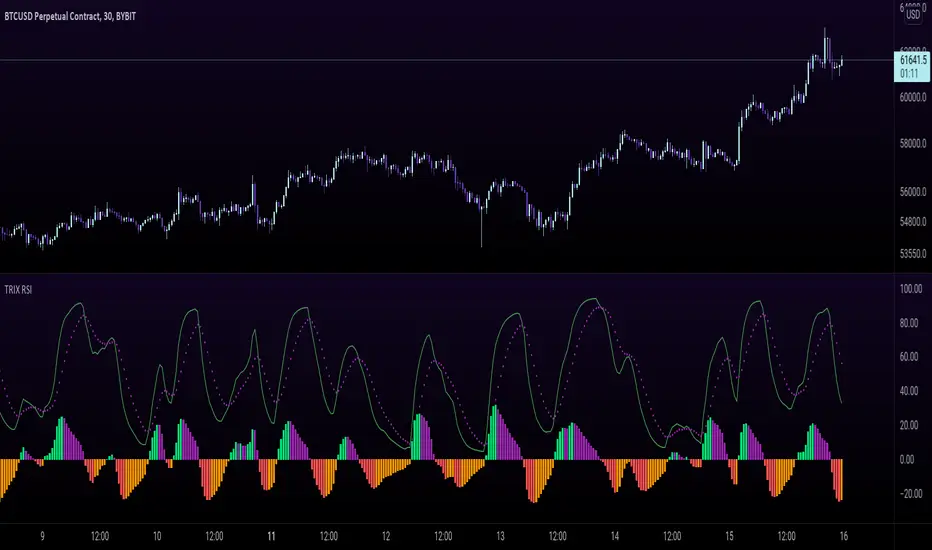
TRIX RSI - Tripple Exponetial Relative Strength (TRSI) This indicator applies the RSI formula over the TRIX indicator to get the TRIX RSI.
The EMA and the TRIX RSA cross gives you an indication for a trend change
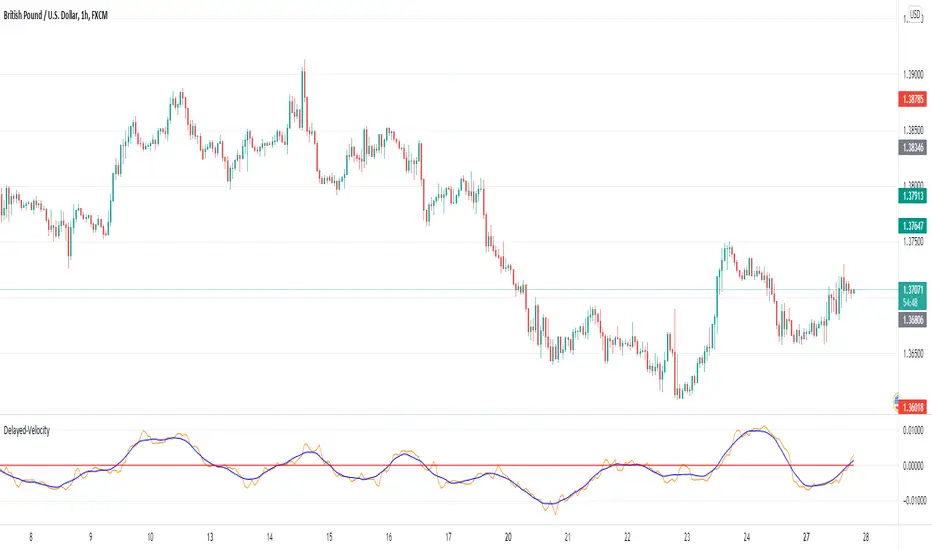
Delayed-VelocityThis indicator shows the delayed velocity and it's moving average (delayed further) of the price pattern
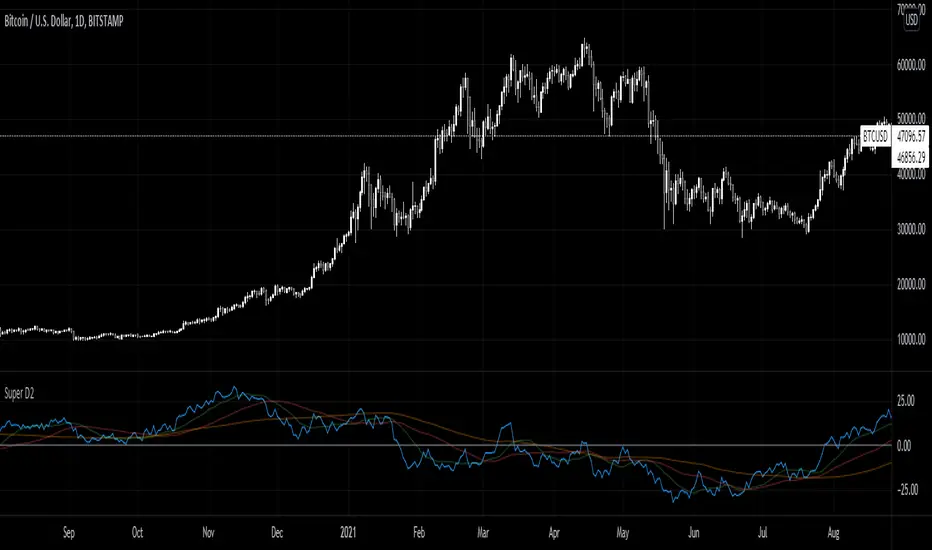
Super D2Momentum Indicator based on previous candle structure over past 40 periods
- Blue is momentum score
- Green = 15 ema
- Red = 50 sma
- orange = 100 sma
The indicator looks at the previous candles differences between open, close, high, and low to determine momentum. A high close relative to open or low indicates very strong momentum for example.

Trend Strength Directional IndicatorThis study was inspired by two famous Trading View contributors. Shout out to Lazy Bear and Crypto Face!
In this study you have a live view of the strength of direction the market is heading. The indicator that looks like a black wave is showing us the momentum of price action. When a green dot appears under the lower level it is a indication that we should consider buying, and if the red dot appears over the upper level we should sell. The custom MFI indicator determines how much money is flowing into the market. If it is green that means money is flowing into the market and if it shows red it means that money is flowing out of the market.

Ehlers Relative Vigor Index [CC]The Relative Vigor Index was created by John Ehlers (Cybernetic Analysis For Stocks And Futures pg 58) and this is a momentum indicator that is similar to the Accumulation Distribution Oscillator created by Jim Waters and Larry Williams. He uses digital signal processing to smooth the indicator to provide clear buy and sell signals. The idea behind this indicator is that during uptrends, prices tend to close near the high and during downtrends, prices tend to close near the low. I have included strong buy and sell signals in addition to normal ones so strong signals are darker in color and normal ones are lighter in color. Buy when the line turns green and sell when it turns red. Usually the best signals I have found for this indicator is when the indicator is below the 0 line and turns green then it is usually a sign of a strong uptrend.
Let me know if there are any other scripts you would like to see me publish!

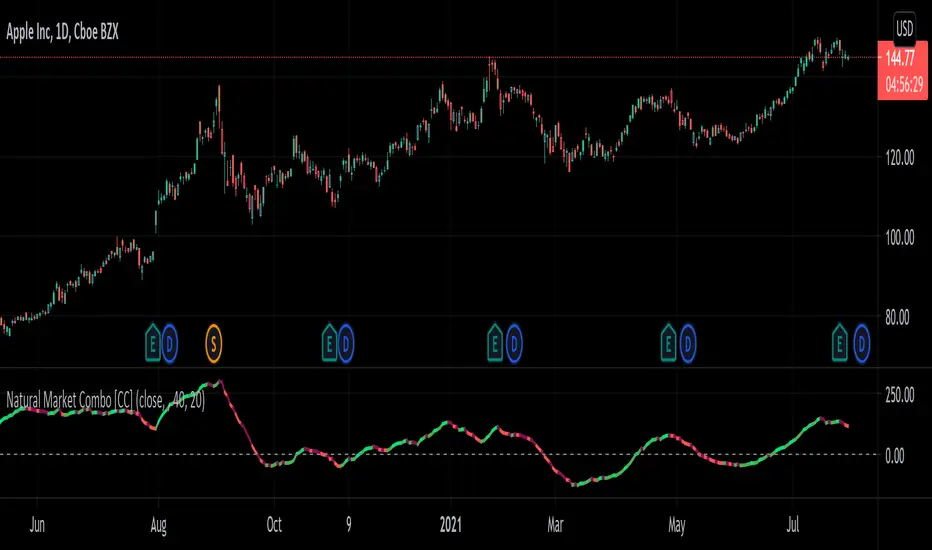
Natural Market Combo [CC]The Natural Market Combo was created by Jim Sloman and this is another one of my Ocean series of indicators to provide his full life's work free of charge to everyone. Just as the name implies, this is a combination of his two market indicators ( Natural Market River and Natural Market Mirror ) and this is a momentum indicator like the others. Big thanks to @altcoinz and @tmac87 for providing me the full source code and documentation to be able to publish all of Jim's work. This indicator is very simple to understand in that it takes the 2 market indicators and creates his own average of both indicators then smooths the result. I did fix an error that he didn't account for in his original script so the results are much more accurate. I have included strong buy and sell signals as darker colors and normal buy and sell signals as normal colors. Buy when the line turns green and sell when it turns red.
Let me know if there are any other indicators or scripts you would like to see me publish!
Natural Market Slope [CC]The Natural Market Slope was created by Jim Sloman and this is one of his many Ocean Indicators which I'm publishing thanks to receiving source materials from @altcoinz and @tmac87. I did completely rewrite the formula for this indicator but I commented out the original calculation so you can compare or just for study purposes. I like this version better because it is very smooth and the original formula is a bit faster with response but is very choppy in comparison.
This indicator was the basis for his Natural Market Combo which I will be publishing very soon so stay tuned for that. The idea behind all of his Natural indicators was to use the natural log of the current price in different ways. This indicator obviously focuses on the slope and it essentially becomes another momentum indicator which peaks when the upward momentum is gone and vice versa. Buy when the line turns green and sell when it turns red. I have added strong buy and sell signals in addition to the normal ones and strong signals are darker in color in comparison to the original lighter colors.
Let me know if there are any other indicators you would like to see me publish!

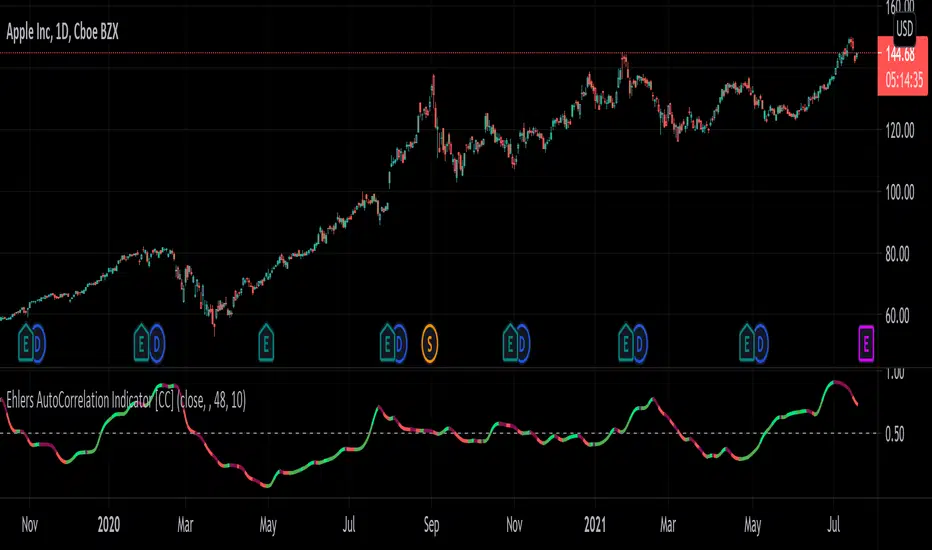
Ehlers AutoCorrelation Indicator [CC]The AutoCorrelation Indicator was created by John Ehlers (Cycle Analytics pgs 94-98) and this can be viewed as both a momentum indicator and a trend indicator. This was his basis for several other indicators that he created which I will be publishing soon but essentially as this indicator goes up then the stock is in an uptrend and also has upward momentum. You will notice that this indicator starts to go down even during an uptrend showing that the underlying trend is going to have an upcoming reversal. He also warns that the halfway mark is a possible reversal point so keep an eye out for that.
Generally speaking a good signal is to enter a long position when the indicator is under the midline and is starting to go up (or when the line is green) and to exit the position when the indicator goes over the midline. I have included strong buy and sell signals in addition to normal ones so darker colors mean strong signals and lighter colors mean normal signals.
Let me know if there are any other indicators you would like me to publish!
Natural Market River [CC]The Natural Market River was created by Jim Sloman (Ocean Theory pgs 59-62) and this is another momentum indicator that is extremely similar to the previous indicator I published, the Natural Market Mirror . This has almost identical buy and sell signals but different way to handle calculations so I'm going to leave it up to you which one you will prefer. Since this is almost identical, the buy and sell signals work in the same way with both strong signals and normal ones. Buy when the line turns green and sell when it turns red.
Let me know what other indicators you would like to see me publish!

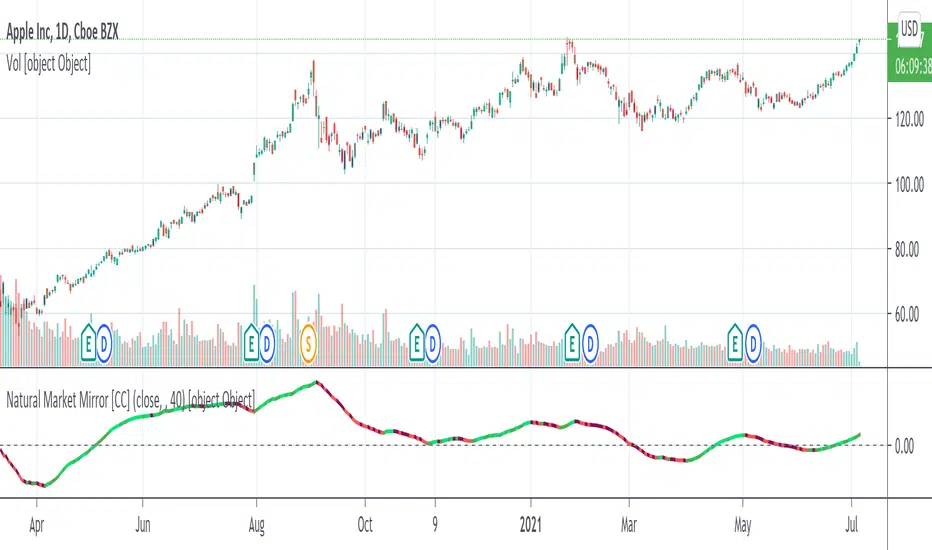
Natural Market Mirror [CC]The Natural Market Mirror was created by Jim Sloman (Ocean Theory pgs 49-57) and this is a continuation of my series from Jim Sloman's indicators. This indicator is also a momentum indicator and is very similar to the previous indicator I published, the Ocean Indicator and of course this indicator is built using ideas from the Ocean indicator. It may just be my opinion but I feel like this indicator provides better buy and sell signals in comparison. I built this using strong buy and sell indicators in addition to normal ones so darker colors are the strong signals and lighter colors are the normal signals. Buy when the line turns green and sell when it turns red.
Let me know what other indicators you would like me to publish!
Momentum Performance This Indicator displays the momentum (performance) of the symbol in percent.
You can compare the performance with other symbols.
The default benchmarks are the S&P 500, the MSCI World and the FTSE All World EX US.
The default length corresponds to one year in the timeframes monthly, weekly and daily.
In intraday the default length is 200, but you can also set your own setting.
You have also the opportunity to display a average momentum performance of the main symbol.

Imbalance FinderImbalance Finder
I struggled to always see it visually this marks whether there is or isn't imbalance
Very quick way of finding imbalance between bars

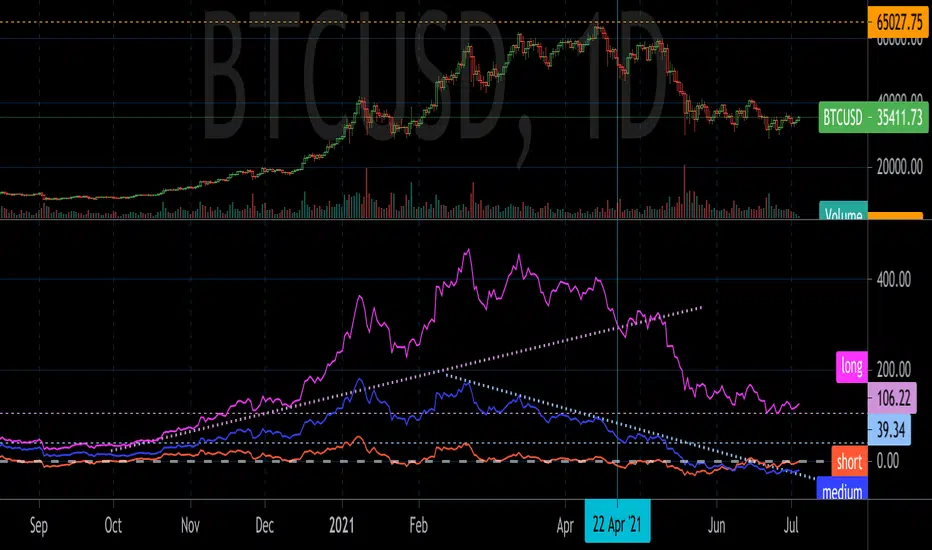
GD MomentumGD Momentum plots short, medium, and long term momentum indicators. The indicators are inspired by momentum structural analysis techniques, and are the % above or below different moving averages. The short term plot is the % above or below the 30 unit moving average, medium is 200 units, and long is 1000 units.
Draw trend lines and horizontal lines to identify the momentum structure and detect trend changes before they show up in price action.