Dziwne MFI Overlay (with highlight)It is simply your traditional MFI , except that your 50 line became the actual price.
Why and how could it be useful? This indicator helps to spot more easily and efficiently divergences .
You could also use it for trend reversals as you usually do with your 50 line, but I would suggest to set a higher length for the MFI, like 155 or something like that.
Money

Fixed price Stop Loss [Takazudo]This strategy is a demo for fixed price stop loss.
This strategy enables you to specify fixed price stop loss. Let's say your deposit is USD. When you trade EURCAD, you need to specify the quantity for trade. Here comes three chances for trade.
A: SL pips: 500
B: SL pips: 200
C: SL pips: 100
In these trade, the risk is different for each. ABC risk ratio is 5:2:1. And, you cannot know how much to lose if the price hits the stop loss. This is a huge problem.
With this strategy, You can specify the fixed risk price for each trade. If you specify 100 USD for the risk, this strategy calculates how much quantity to buy or sell for each entry. In the case above, this strategy guides you how much quantity to buy or sell like below.
A: 2,000 qty (SL: 500pips)
B: 5,000 qty (SL: 200pips)
C: 10,000 qty (SL: 100pips)
If you make entries with those quantity and the price hits the stop loss, You will lose the money like below.
A: 100 USD
B: 100 USD
C: 100 USD
This is what this script does. Fixed price SL.
I tested this caliculation for OANDA's main 28 currency pairs forex listed below.
AUDUSD, EURUSD, GBPUSD, NZDUSD, USDCAD, USDCHF, USDJPY, AUDCAD, AUDCHF, AUDJPY, AUDNZD, CADCHF, CADJPY, CHFJPY, EURAUD, EURCAD, EURCHF, EURGBP, EURJPY, EURNZD, GBPAUD, GBPCAD, GBPCHF, GBPJPY, GBPNZD, NZDCAD, NZDCHF, NZDJPY
I may add more pairs later.
Note: The entry strategy in this script is not intented to win. Check the result. Be careful.

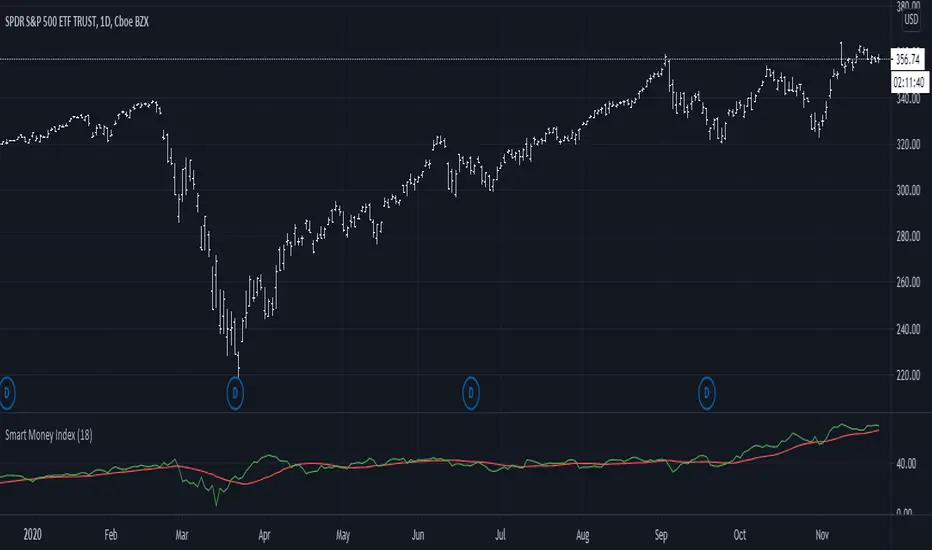
Smart Money Index (SMI)It came to my attention that one very common implementation of SMI was incorrect; rather than subtracting the first hour delta and adding the last hour delta it subtracts the whole day delta and adds the last 30m delta. While this indicator might have had some use, it is not what I understand to be the actual Smart Money Index and so I post this as a correction for use in other scripts.
Total Inflation ModelMeasure of the total economy wide inflation of the US Dollar.
Total Inflation = growth rate of money supply / economic output

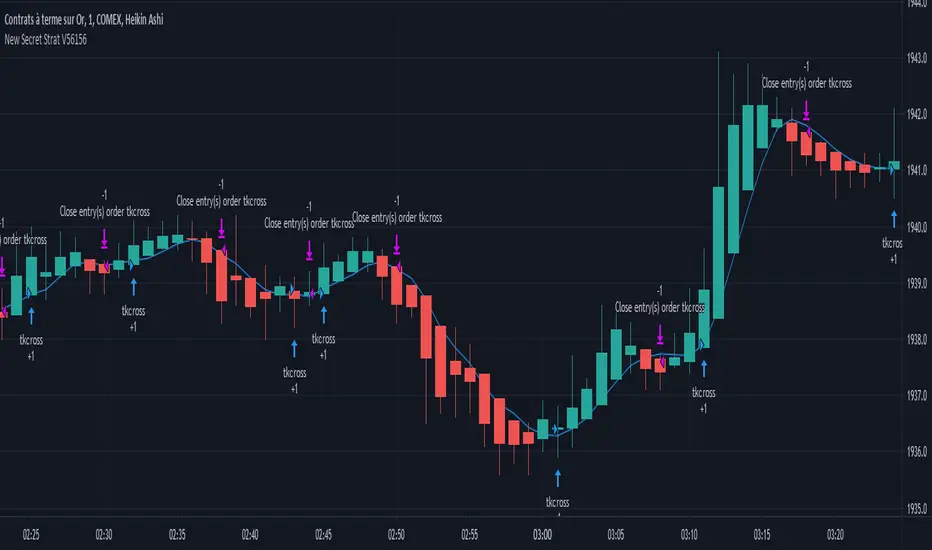
New Secret Strat V56156After years of resserch and development, I finally finished created the best strategy ever made.
It works on every security you can think of: futures, forex, bitcoin, and so on.
It will adapt the pattern of every chart to make the most money possible.
This is the masterpieace I was hopping to produce one day, and now it is.
Right before you.
Enjoy the best strategy that has ever been created.
Good luck !

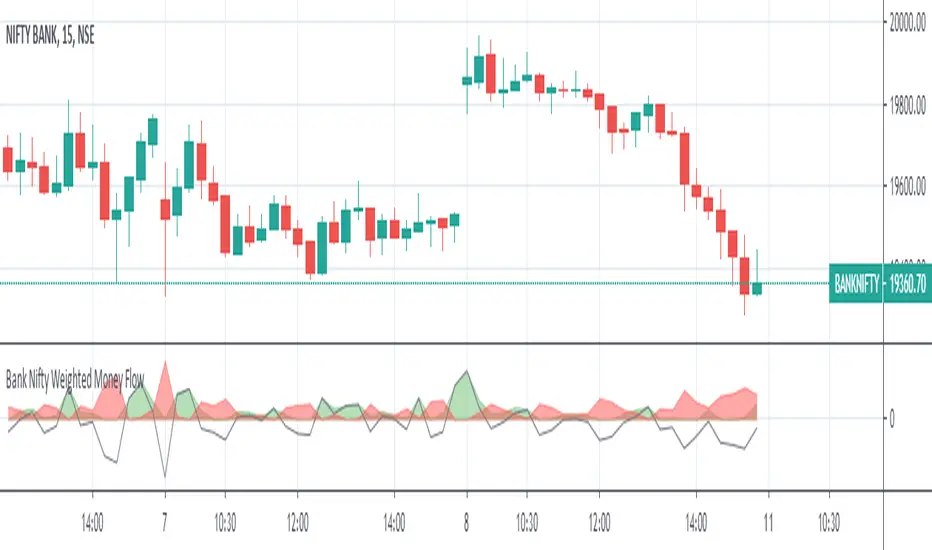
Bank Nifty Weighted Money FlowThe indicator comprises of 2 areas ( one in green and another in red ) that depict the money flowing in and out the underlying 12 banks under BANK NIFTY index
The money flowing in and flowing out is calculated by identifying the buying pressure and selling pressure of each of 12 underlying banks within a 15 minute period ( which is internally further broken down by 15 one minute candles ), there by identifying the buy volume and sell volume multiplied by the price of the stock for the given minute aggregated for 15 minutes
The derived value for each bank is further weighted as per their weight in the index ( as of May 2nd 2020 ) and then summed up separately for both money flowing in and flowing out and plotted which shall help traders take decision based on the magnitude of money flowing in and out ( the weights shall be updated as and when the same changes in the index calculations )
The green color area represents the money flown in and the red color area represents the money that has flown out
A gradually increasing green area along with the decrease in the red area can be considered as the market is more into buying and less into selling and vice versa ( this can be observed in the chart before the rally begins , there should be an increasing green area which could potentially signifies money has started to flow in )
An equal or almost equal areas could signify a sideways market and the black line moving across shows the difference of money flowing and flowing out
Comments and feedback are welcome
Should you have any doubts or wish to access the script then please feel free to DM me.
***** The indicator works only in 15 minutes time frame *****
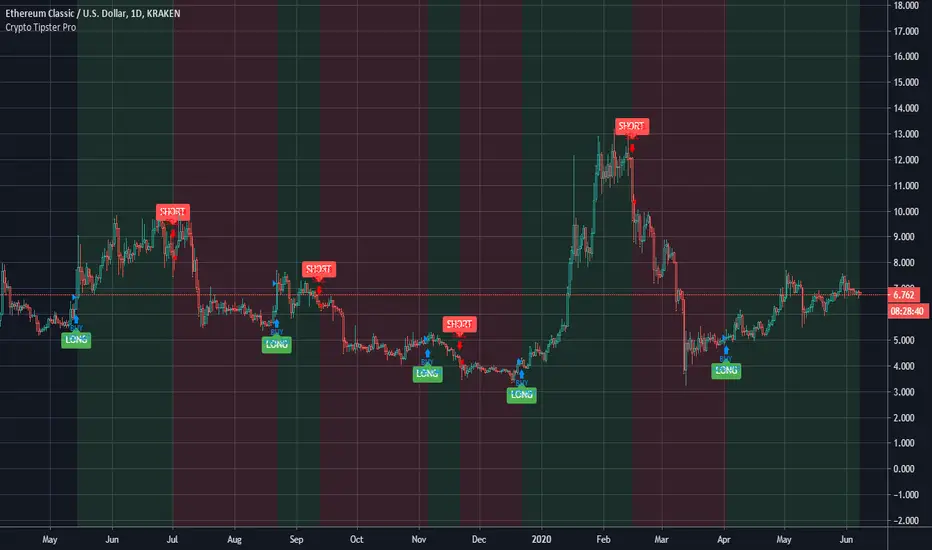
Crypto Tipster Pro===========
Crypto Tipster Pro Strategy
===========
Crypto Tipster Pro is a trading strategy with indicators based on Technical Analysis , Price Action and Momentum Swings for TradingView's charting platform.
We've compiled and continue to maintain a trading strategy that adapts to changes in the market; with custom indicator settings, fixed SL/TP, Trailing Stop, Safe Mode, Heikin Ashi Confirmation, Multi-Time Frame Analysis and more!
Our efforts have been focused towards the 1D time frame - using a larger time frame benefits most part-time or evening traders in multiple ways, catching bigger swings and earning a higher percentage per trade, the ability to reduce or remove any leverage associated with the trade, and only having to place a trade or move a stop loss ONCE per day ~ Meaning you are still able to go to work, tidy the house, play with the kids AND be a successful trader.
-----------
What's Included?
Crypto Tipster Pro comes with a host of features and is being continually updated, these features include (but are not limited to):
- Date Range Settings
Setting custom Start/End dates can help hone your strategy to suit the current times, or get a general overview of the market over the years.
- Heikin Ashi Confirmation
We added HA confirmation for both Entry & Exit of trades. This started as a form of "Safe Mode", we have since adapted this mode beyond Heikin Ashi; but kept this confirmation as an added extra.
- Variable Indicator Settings
As well as our Fixed Indicators and Price Action analysis going on in the background of the strategy, we've also included some Variable Indicators that you have access to edit.
Trend Detection Length for detecting trend over a given length! Higher numbers detect longer trends, but will inevitably make fewer trades and possibly miss the start of a new trend; a lower length will create more opportunities to trade but may get confused when in choppy markets.
Range Short/Long Lengths are used for detecting percentage price movements over a given number of bars back. This enables you to effectively "zoom in" on market data and catch trends within trends.
- Safe Mode
Enabling Safe Mode will add a couple more confirmation indicators to the strategy - the aim of Safe Mode is, in essence, to remove any trading signals that would end of being false/bad moves. Usually resulting in less Overall Trades, a higher Net Profit, higher % Profitable, higher Profit Factor AND a lower Drawdown. Use Safe Mode to help eliminate orders that would otherwise be placed in choppy markets.
- Stop Loss/Take Profit Settings
This is where Crypto Tipster Pro really proves itself, Money Management. We have an editable Fixed SL/TP, as well as Trailing Stops for Long or Short orders, all of which you can use on their own, or combined with each other. Playing with these settings can turn an un-profitable system into a very-profitable trading plan!
- Custom Stop Loss Indicator
This is a little extra indicator that we have found very useful over the years of trading markets, a custom Stop Loss Indicator. Simply turn it on, enter the price you want to calculate from, tick Long or Short, enter a % movement and see your new stop loss level plotted on the chart. This is especially useful for when the strategy doesn't marry up with the prices you've actually obtained (for better or for worse!)
We've tried to make this strategy as comprehensive and as accurate as possible, it works consistently over many trading pairs on many time frames. We would however Love your assistance! -please forward any notes or helpful tips to us either by commenting below, on Twitter or a direct message through our website.
-----------
For more information and a FREE 7-Day Trial with the Crypto Tipster Pro Strategy visit the link in our signature.
Good Luck and Happy Trading!
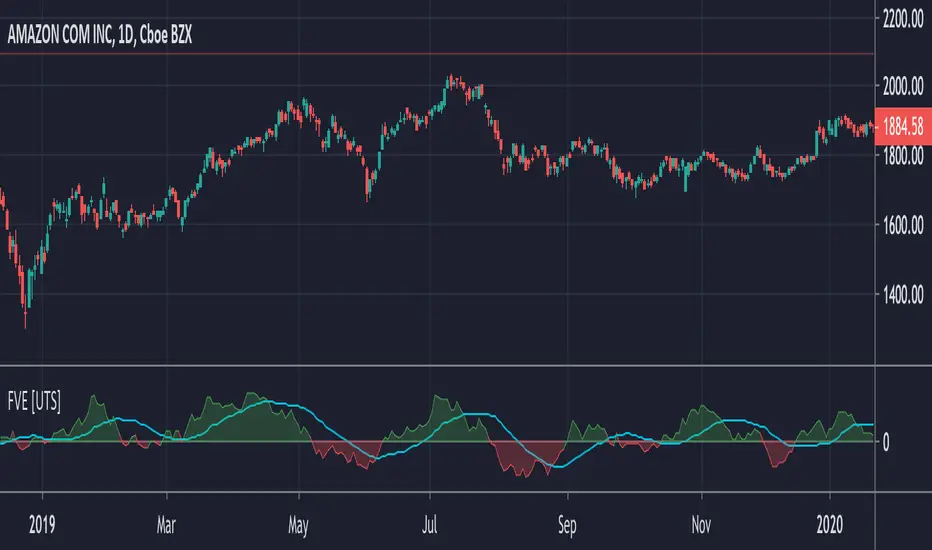
FVE - Finite Volume Elements [UTS]FVE is a money flow indicator but with two important differences from existing money flow indicators:
It resolves contradictions between intraday money flow indicators (such as Chaikin’s money flow) and interday money flow indicators (like On Balance Volume) by taking into account both intra- and interday price action.
Unlike other money flow indicators which add or subtract all volume even if the security closed just 1 cent higher than the previous close, FVE uses a volatility threshold to take into account minimal price changes.
General Usage
The FVE provides 3 types of signals:
The strongest signal is divergence between price and the indicator. Divergence can provide leading signals of breakouts or warnings of impending corrections. The classic method for detecting divergence is for FVE to make lower highs while price makes higher highs (negative divergence). An alternative method is to draw the linear regression line on both charts, and compare the slopes. A logical buy signal would be for FVE, diverging from price, to rise sharply and make a series higher highs and/or higher lows.
The most obvious and coincident signal is the slope of the FVE line. An upward slope indicates that the bulls are in control and the opposite for downward.
This is a unique and very important property of this indicator. Values above zero are bullish and indicate accumulation while values below zero indicate distribution. FVE crossing the zero line indicates that the short to intermediate balance of power is changing from the bulls to the bears or vice versa. The best scenario is when a stock is in the process of building a base, and FVE diverges from price and rises to cross the zero line from below, at a sharp angle. Conversely the crossing of the zero line from above is a bearish signal to liquidate positions or initiate a short trade.
Trend Visualisation
Optional: If the trend direction is DOWN the moving average is painted red. If the trend direction is UP the moving average is painted in green.
If the movement is FLAT then the color is grey.
Moving Averages
Five different types of Moving Averages are available for both FVE and the optional moving average of the FVE.
ALMA (Arnaud Legoux Moving Average)
Average Value
EMA (Exponential Moving Average)
SMA (Simple Moving Average)
WMA (Weighted Moving Average)
Calculation Methods
Since Markos Katsanos presented the first version of the FVE in April 2003.
Since then there have been various adaptions and improvements on this indicator.
The following are choosable for calculating the FVE:
Thinkscript usethinkscript.com
Linnsoft www.linnsoft.com
Volatility Adapted traders.com
CMF Osc - Chaikin Money Flow Oscillator [UTS]The well known Chaikin Money Flow Indicator as oscillator version.
General Usage
The indicator runs both above and below zero, made to denote whether an asset is in a bullish (above zero) or bearish (below zero) trend.
It can be used to confirm trends, as well as spot possible trading signals due to divergences.
A benefit of the oscillator version is that it can produce LONG or SHORT signals on zero line cross.
Moving Averages
4 different Moving Averages are available:
EMA (Exponential Moving Average)
SMA (Simple Moving Average)
VWMA (Volume Weighted Moving Average)
WMA (Weighted Moving Average)

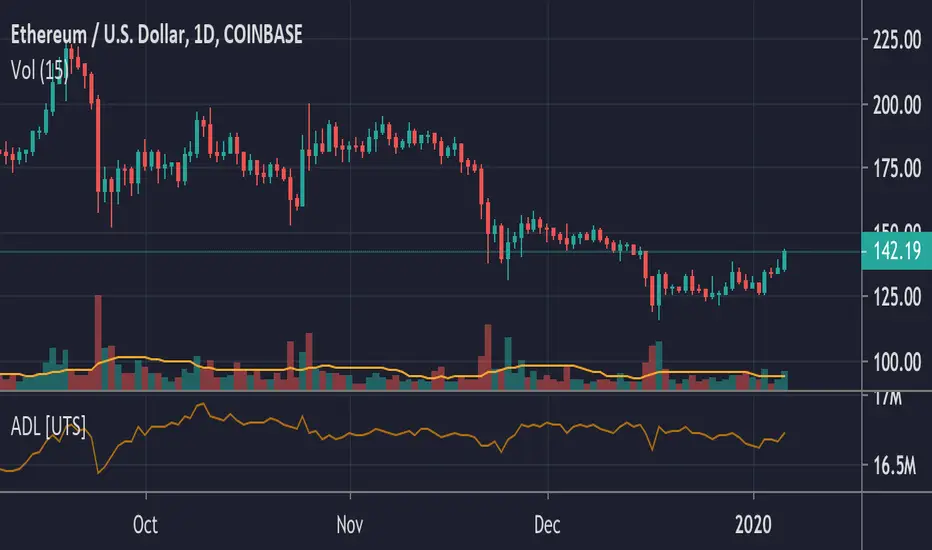
ADL - Accumulation Distribution Line [UTS]an underlying asset.
It is determined by the changes in price and volume. The volume acts as a weighting coefficient at the change of price — the higher the coefficient (the volume) is the greater the contribution of the price change (for this period of time) will be in the value of the indicator. The indicator is also known as Accumulation / Distribution Index.
Common known variants of this type of indicator are the On Balance Volume, Chaikin Oscillator or Chaikin Money Flow.
Based on www.metatrader5.com
MS MONEY CCI SQUEEZEAbout
I have used this indicator to find many lucrative opportunities. This indicator takes the moving average of CCI in custom, volatility-specific conditions. CCI measures "overbought" in the red-shaded region and "Oversold" in the green-shaded region. The shaded regions do not constitute a buy/sell signal alone, the MS CCI Squeeze is best used when market conditions agree and is best used when the user has fundamental reasoning for "reversal-like" situations to align. The MS CCI Squeeze will soon have a synergistic partner called "MS RSI Squeeze" indicator that will look similar to help better measure volatility and strength trend.
About the Commodity Channel Index (CCI)
The commodity channel index (CCI) is an oscillator originally introduced by Donald Lambert in 1980. Since its introduction, the indicator has grown in popularity and is now a very common tool for traders in identifying cyclical trends not only in commodities, but also equities (stocks) and currency trading.
How to set an Alert
If the user wants to set an alert , click on one of the support/ resistance lines (black-dashed) near the zero mark. Clicking on the horizontal line above or below the zero line will populate a yellow arrow which will allow you to set alerts when wanted.
Please Read For Better Efficiency
When using this indicator, keep an eye out for harmonic patterns, both bullish and bearish head and shoulders patterns for "HIDDEN" breakout opportunities.
Please like, follow and share and I will continue building better indicators.

MPI‴ | Money Pressure IndexThe MPI‴ or Money Pressure Index is a great indicator to measure the buy/sell money pressure over the asset once it allows you to have a better understanding and interpretation of its behavior once you are able to see it through an histrogram. Using its histogram, will allow you to have a gradual view of its force over the asset and the end of the line oscilation will allow you to see the most up to date indicator behaviour.
What is the best is that you can use it with any kind of graphic that it will always considere the real open, close, high and low trading values.
To have access to this indicator, please contact me at: contato @ moneywise . com . br
Believe me, this indicator will make your life much easier!

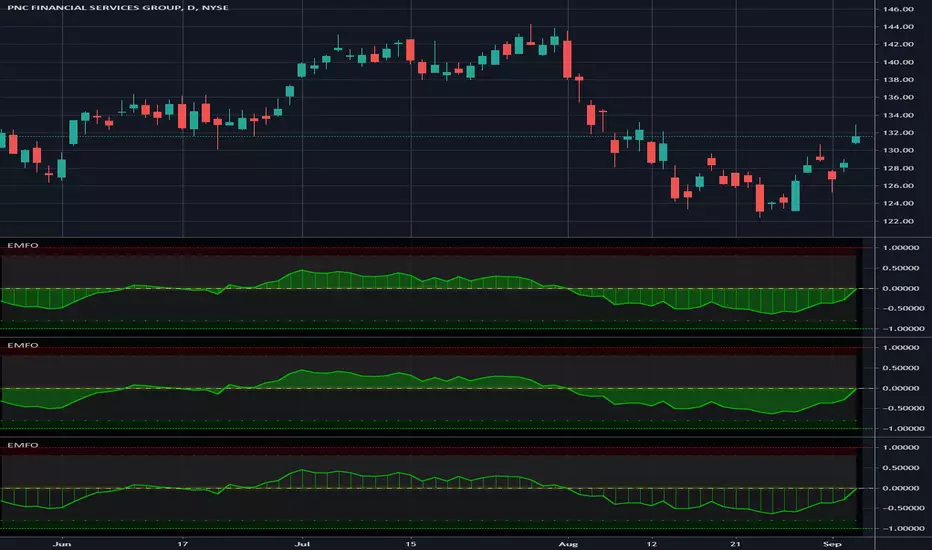
Enhanced Money Flow Oscillator - Vitali ApirineThis is my "Enhanced Money Flow Oscillator" indicator using Pine Script version 4.0, freely available to ALL! This originates from an October 2015 TASC magazine article written by Vitali Apirine. While the original was simplistically designed, I enhanced it by adding a multitude of features listed below.
Note: This script has volume detection built-in. When no volume is available, the background color will be overwhelmingly red AND the indicator will cease to function. At a minimal, this script can used to detect when volume is available in an asset or when it is not.
Features List Includes:
I.P.O.C.S.(Initial Public Offering Clean Start) Technology
Enable/disable dark background for enhanced visibility
"Period" adjustment
"Line Width" adjustment
"Display Area" selection for visual mutations displayed above
Ranges and thresholds are enable/disable capable
Upper threshold adjustment
Red/green secondary range that adjusts +/- from the upper/lower thresholds
Lower threshold adjustment
Adjustable centered medial zone
The comments section below is solely just for commenting and other remarks, ideas, compliments, etc... regarding only this indicator, not others. If you do have any questions or comments regarding this indicator, I will consider your inquiries, thoughts, and ideas presented below in the comments section, when time provides it. When my indicators achieve more prevalent use by TV members, I will implement more ideas when they present themselves as worthy additions. As always, "Like" it if you simply just like it with a proper thumbs up, and also return to my scripts list occasionally for additional postings. Have a profitable future everyone!
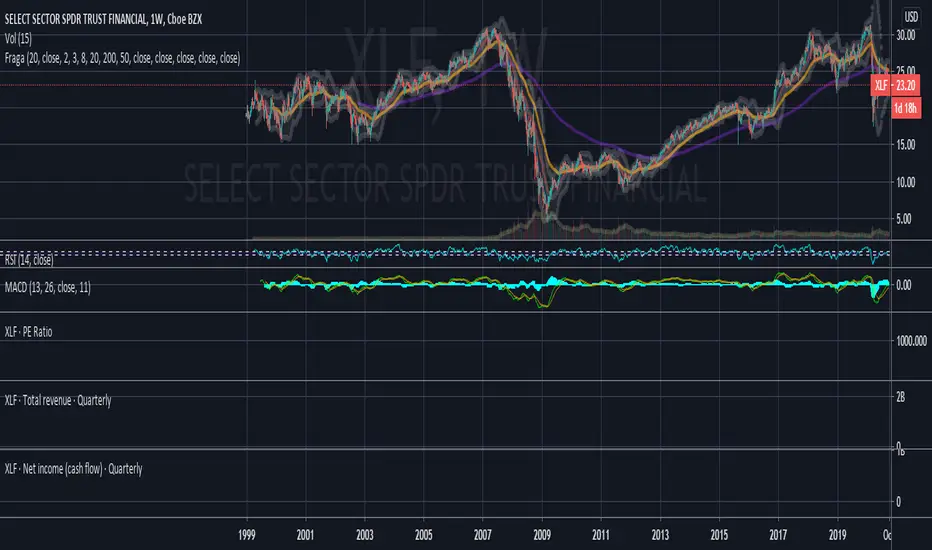
Didi+EMA200+Bollinger Bands-FRAGAHelps those are using Basic Account / limited indicators
by Will Fraga
@traderzonebr
Smart Money Index (50)Added MA50 to help interpret Smart Money Flow Index. Original SMI script by HPotter, idea of MA50 gotten from Troy Bombardia.

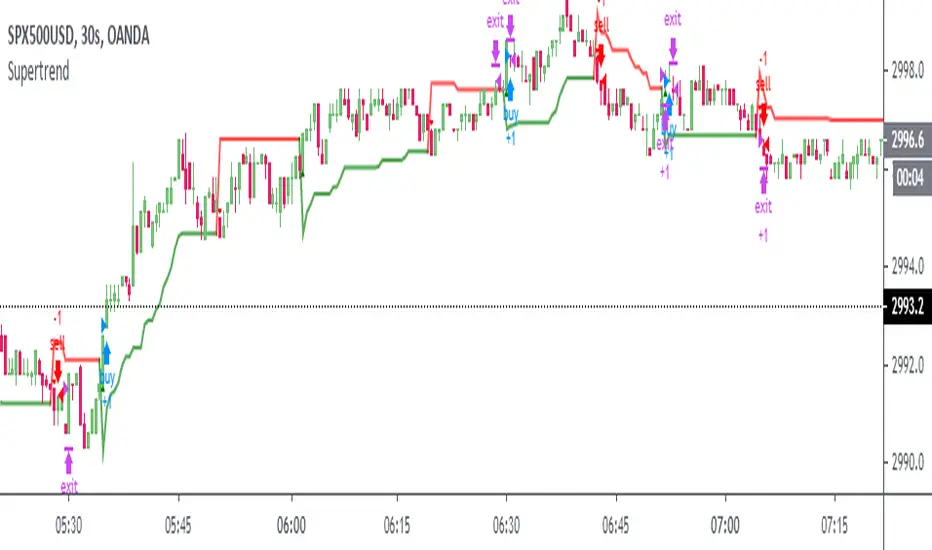
Boring Indicator [ALERTS] [Pretty cool tho]Umm, it's pretty boring indicator, you just buy/long when you see buy and you sell/short when you see sell.
Kinda it's like Market God indicator except that it's better and it took me like 10 minutes to figure it out.
Does it repaints?
I mean... kinda yes and kinda not, signal may start blinking but usually it stays in same place, so even if it disappers for few seconds it should come back.
If you want to be 100% sure, wait for close of candle where it appears.
* Works best on Heikin Ashi candles, so try them.
* Alerts are fine, just set them, probably you will figure out how.
* Should work on crypto mostly, probably stocks too (though remember that they are slower so try on 1day? up to you)
* Should work on any timeframe but 45m BITMEX:ETHUSD is nice for me and I trade there, consider that market doesn't moves 1435236 dollars every candle so well, its better if you wait on longer candle than try to trade on 1m.
Enjoy.
If you want to give me some more money for energy drinks and pizza:
BTC address: 3BMEXhXUAFj39D799zzfU1UAhx4NYSqCog
Oh and share it to friends and family.

Chaikin Money FlowThis script plots the original Chaikin Money Flow in addition of highlighting positive/negative pressure areas.

Money BoxThe inventor Of Murrey Math, T. H, Murrey, had followed in the path of W. D. Gann and deduced that the market moves in set octaves (rather than angles). Instead of 45, 888.
Money Box is an implementation of Murrey Math Lines. It takes the highs and lows of a defined trading range, which must be a multiple of 8 (64/128/256/512), and makes octaves out of that range starting from the high.
Usage
Each octave represents a support/resistance, with outer octaves being more stronger.
Frame Size: The bars back that is taken into account for calculation.
Frame Multiplier: Widens the octaves' trading range. This is useful when you don't want to include older candlestick data but need a larger range.
The other inputs are cosmetic and do not affect the formula.

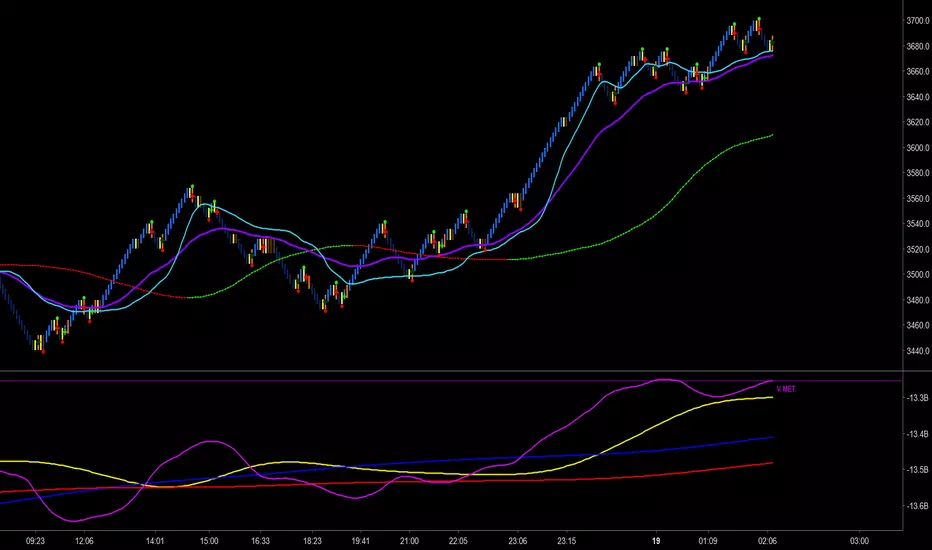
Trader Set - Volume MetricThe last tool in my methodology set, another one of those tools that has unique unpublished formulas, this one purely for following volume and reading smart money's hand, YES it's possible. This indicator has few Alerts built in that you can use, will update the rest of the scripts for additional alerts. You can easily set the alert to play a sound that is not disturbing in long run and check mark open ending and have easy time being alerted when some crossings are happening.
Please, don't ask for access, only my students from my classes will have access to this indicator. The English version of the website and learning material is under development and the moment they get ready I will announce it under each related script.
Stoch Money Flow (ADMF) & Absolute Strength Index (ASI) [cI8DH]This indicator can apply my previous indicator, Historical and Standard Stochastic, to Money Flow (ADMF) or Absolute Strength Index (ASI) or both at the same time. It can also display those two indicators in regular mode as well as showing visual cues when the indicators make new ATH or ATL.
ASI is basically a new name I am giving to my Gain/Loss Moving Average indicator. If you normalize ASI with the moving average of all the changes in price, it becomes identical to RSI. So ASI is basically non-normalized RSI, that is why it should be a more accurate representation of price momentum.
ADMF is an accumulation/distribution and money flow momentum indicator. Both ASI and ADMF are not range-bound so it is not easy to compare them against each other. When stochastic equation is applied to them, they both become range-bound and comparable. The gaps between the two indicator can reveal valuable information about market dynamics. The chart below shows some examples (note the settings).
For conventional usages of stochastic, please read www.tradingview.com(STOCH) and www.tradingview.com(STOCH_RSI). I recommend you to find the optimal length by playing with the stoch length in the indicator settings. If this parameter is calibrated properly, this indicator can be a powerful tool for identifying market cycle.
You can get these features ( ATH , ATL detection and historical stochastic) for any other indicator using the script below:

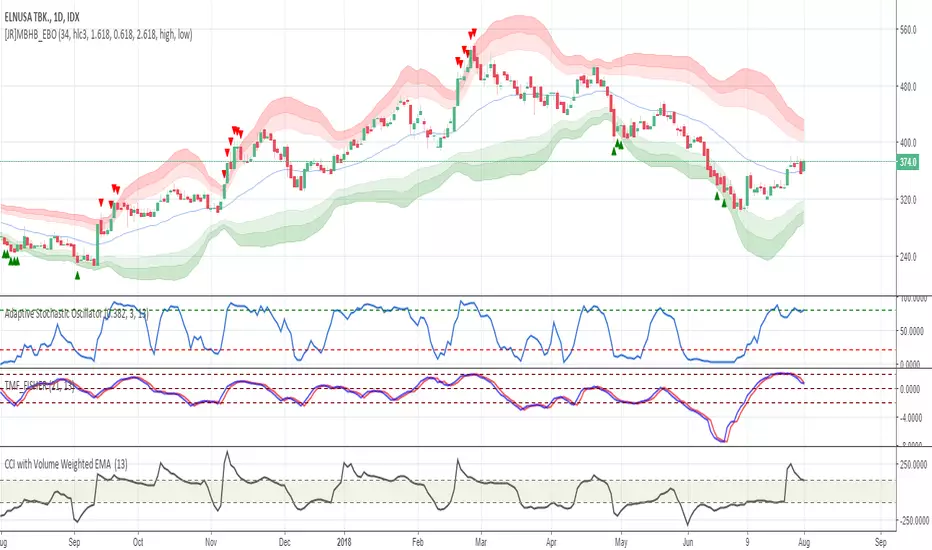
Twiggs Money Flow Fisher Transform// Credits to @LazyBear
// This is an experimental indicator (Originaly coded by Lazybear) modified by @haidinurhasfi by applying the Fisher Transform to Twiggs Money Flow.
// Tune the length according to your trading style and instrument