Aggregated Money Flow Index - InFinitoModified Version of In-Built Money Flow Index Indicator. Aggregated Volume is used for it's calculation + a couple of other features.
Aggregation code originally from Crypt0rus
***The indicator can be used for any coin/symbol to aggregate volume , but it has to be set up manually***
***The indicator can be used with specific symbol data only by disabling the aggregation option, which allows for it to be used on any symbol***
- Calculated based on Aggregated Volume instead of by symbol volume . Using aggregated data makes it more accurate and allows to compare volume flow between different kinds of markets (Spot, Futures , Perpetuals, Futures+Perpetuals and All Volume ).
- As well, in order to make the data as accurate as possible, the data from each exchange aggregated is normalized to report always in terms of 1 BTC . In case this indicator is used for another symbol, the calculations can be adjusted manually to make it always report data in terms of 1 contract/coin.
- Added Moving Average ( SMA , EMA , WMA , RMA, VWMA ) that can be plotted to the MFI
- Added 10/90 level and 45/55 range level
Things to look for:
- Divergences: Can be a very good reversal signal
- MA crossovers & Oversold/Overbought levels crossover: With proper confluence, entering a position at MA crossover and exiting at oversold/overbought levels can give very good swing setups (Or scalps on LTF)
- Center range retests: Once in a trend, retesting the middle range can give very good entries and confirmations of the trend
- Confluence of the latter: In combination, if more than one of these occur at the same time it can give more clarity regarding the current state of the market.
Moneyflowindex

Bogdan Ciocoiu - LitigatorDescription
The Litigator is an indicator that encapsulates the value delivered by the Relative Strength Index, Ultimate Oscillator, Stochastic and Money Flow Index algorithms to produce signals enabling users to enter positions in ideal market conditions. The Litigator integrates the value delivered by the above four algorithms into one script.
This indicator is handy when trading continuation/reversal divergence strategies in conjunction with price action.
Uniqueness
The Litigator's uniqueness stands from integrating the above algorithms into the same visual area and leveraging preconfigured parameters suitable for short term scalping (1-5 minutes).
In addition, the Litigator allows configuring the above four algorithms in such a way to coordinate signals by colour-coding or shape thickness to aid the user with identifying any emerging patterns quicker.
Furthermore, Moonshot's uniqueness is also reflected in the way it has standardised the outputs of each algorithm to look and feel the same, and in doing so, enabling users to plug them in/out as needed. This also includes ensuring the ratios of the shapes are similar (applicable to the same scale).
Open-source
The indicator uses the following open-source scripts/algorithms:
www.tradingview.com
www.tradingview.com
www.tradingview.com
www.tradingview.com

MFI + RSI + MOM With Bull & Bear Trend LabelMOMENTUM + MONEY FLOW INDEX + RELATIVE STRENGTH INDEX WITH BULL & BEAR LABELS
This is a combination of 3 popular indicators. Momentum(MOM), Money Flow Index(MFI) and Relative Strength Index(RSI) along with color changing labels that tell you each indicator's current trend.
The middle white line shows the level that each indicator needs to stay above to be bullish and below for bearish. Watch for all three indicators to cross and hold above or below the mid line for big moves.
It is important to note that these indicators do not need to be going up to be bullish or down to be bearish. They just need to hold above or below the mid line to understand the overall trend.
The momentum indicator is the most relevant in my opinion. If it is holding above the mid line steadily, usually the overall trend will continue upwards so look to buy the dips if the momentum cloud is staying above the white line and vice versa.
It is also important to note that the default settings for this indicator are the 100 period as I find it to be super relevant across most charts but these numbers can be changed in the indicator settings.
Since momentum swings wildly past the normal 0-100 range, it is important to note that the momentum line has been “normalized” to stay within this same range as the rsi and mfi. So if you look at a normal momentum indicator side by side with this indicator it will not look the same however, I find it to be a very good indicator of overall direction so I know the current market sentiment even when price is diverging from the indicator directions.
All of the colors, sources and lengths can be easily customized in the indicator settings input tab.
***HOW TO USE***
When Momentum is above the mid line, it is bullish. When Momentum is below the mid line, it is bearish.
A label on the right side will update in real time to tell you if momentum is Bullish or Bearish for faster recognition of the trend.
When RSI is above the mid line, it is bullish. When Momentum is below the mid line it is bearish.
A label on the right side will update in real time to tell you if RSI is Bullish or Bearish for faster recognition of the trend.
When MFI is above the mid line, it is bullish. When MFI is below the mid line it is bearish.
A label on the right side will update in real time to tell you if MFI is Bullish or Bearish for faster recognition of the trend.
This indicator was built to help you quickly identify the Bullish or Bearish nature of the current trend with a live color changing label so you can glance at the label and understand it's direction without analyzing the indicator data.
***MARKETS***
This indicator can be used as a signal on all markets, including stocks, crypto, futures and forex.
***TIMEFRAMES***
This mom + mfi + rsi indicator can be used on all timeframes.
***TIPS***
Try using numerous indicators of ours on your chart so you can instantly see the bullish or bearish trend of multiple indicators in real time without having to analyze the data. Some of our favorites are our Auto Fibonacci, Directional Movement Index, Volume Profile, Auto Support And Resistance and Money Flow Index in combination with this indicator. They all have real time Bullish and Bearish labels as well so you can immediately understand each indicator's trend.

Money Flow Index With Bullish & Bearish SignalsMONEY FLOW INDEX WITH BULLISH AND BEARISH SIGNALS
Money Flow Index shows whether money is coming into the market or going out of the market. This can be used to gauge market sentiment and whether people are buying or selling at the current price.
***HOW TO USE***
If the MFI line is green, it is above the 50 line and in a bullish trend.
If the MFI line is red, it is below the 50 line and in a bearish trend.
If the background color is green, Money Flow is in a bullish trend, holding above the 50 line.
If the background color is red, Money Flow is in a bearish trend, holding below the 50 line.
If the MFI is above the 75 level it indicates a possible top or overbought conditions.
If the MFI is below the 25 level it indicates a possible bottom or oversold conditions.
***BULLISH/BEARISH LABELS***
There is also a label on the right side that tells you whether the overall trend is bullish or bearish, if there is a possible bottom or top and if the current money flow index is going up or down. This table updates in real time and changes colors so you can get an easy, quick interpretation of the current money flow without having to look at the data so you can make faster decisions on whether to enter or exit a trade. The flashing from red to green or the opposite also grabs your attention so you know immediately if there is a change in trend. The table changes colors in sync with the MFI line and it's trends and bottom/top areas. Green means money is coming in. Red means money is going out. Blue means a neutral amount of money flow.
***MARKETS***
This indicator can be used as a signal on all markets, including stocks, crypto, futures and forex.
***TIMEFRAMES***
This Money Flow Index indicator can be used on all timeframes.
***TIPS***
Try using numerous indicators of ours on your chart so you can instantly see the bullish or bearish trend of multiple indicators in real time without having to analyze the data. Some of our favorites are our Auto Fibonacci, DMI, Momentum, Auto Support And Resistance and Volume Profile in combination with this Money Flow Index. They all have real time Bullish and Bearish labels as well so you can immediately understand each indicator's trend.

TTP AF Sim ProThis indicator helps you visualise, practice, manage and automatically add funds to DCA deals that are in negative.
Multiple factors factors are relevant when trying to exit a bad deal:
How much funds are invested
What's the current average position price
How far the price has already dropped from that average
Is the price bouncing significantly and frequently to the upside providing multiple opportunities to exit or is it still a free-falling knife dumping heavy?
What are your TP % expectations
This indicator allows you to enter all these parameters visualising them all together in a single chart. The chart will show you based on all this information how much funds you would have required to exit in profit and rescue the deal in green. It will also flag if the exit strategy would have failed by plotting a red label indicating all the times where the TP wouldn't have been reached.
The exit strategies
In this pro version you have access to edit all settings and the added ability to use an external indicator as source:
Custom external indicator as source
Relative Strength Index (RSI)
Commodity Channel Index (CCI)
Money Flow Index (MFI)
Bollinger Bands (BB)
Automated Add Funds-alert
With this indicator you can also add funds to the deals automatically:
Every time the conditions are true an alert is sent
Add Bot ID and Email Token for the deals
Select automatically calculated volume or your own custom
Tweak your exit strategy to your liking and add your Bot ID and Email Token to automatically add funds to your open deals.

TTP AF SimThis indicator helps you visualise, practice, manage and automatically add funds to DCA deals that are in negative.
Multiple factors factors are relevant when trying to exit a bad deal:
How much funds are invested
What's the current average position price
How far the price has already dropped from that average
Is the price bouncing significantly and frequently to the upside providing multiple opportunities to exit or is it still a free-falling knife dumping heavy?
What are your TP % expectations
This indicator allows you to enter all these parameters visualising them all together in a single chart. The chart will show you based on all this information how much funds you would have required to exit in profit and rescue the deal in green. It will also flag if the exit strategy would have failed by plotting a red label indicating all the times where the TP wouldn't have been reached.
The exit strategies
In this basic version you have access to well tested and pre-defined conditions with the following indicators:
Relative Strength Index (RSI)
Commodity Channel Index (CCI)
Money Flow Index (MFI)
Bollinger Bands (BB)
Automated Add Funds-alert
With this indicator you can also add funds to the deals automatically:
Every time the conditions are true an alert is sent
Add Bot ID and Email Token for the deals
Select automatically calculated volume or your own custom
Select exit strategy and add your Bot ID and Email Token to automatically add funds to your open deals.

TitinhoIndicatorsLibraryOn this Library you cand find a shortcut for some indicators and just import them into your source.
Each indicator has its own input and output parameters and they are prety much self explanatory. :D
This is the list of the present indicators you can use with this library:
*Function_Adx()
*Function_Atr()
*Function_Mfi()
*Function_MovingAverage()
*Function_Sar()
*Function_Rsi()
*Function_StochasticRsi()
Have fun!!!
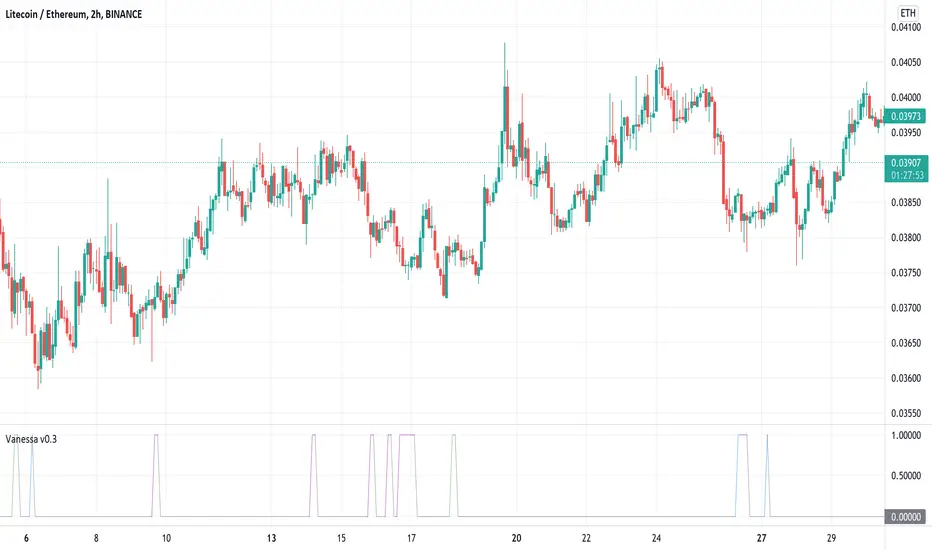
VanessaThis indicator transforms different oscillators to automated trade signals via alerts.
What is included:
Community Channel Index (CCI)
Money Flow Index (MFI)
Bollinger Bands (BB)
Select any or all sources
Change timeframe for the sources
Change threshold level for the sources
Add your Bot ID & Email Token
Select the volume to Add Funds
Backtest compatible
Alerts compatible
Description:
By combining multiple long timeframe Deal Start Conditions you increase the chance of recovering unsuccessful deals. Add this to your toolbox as a complement to the original Deal Start Conditions and Martingale-strategy for Dollar Cost Averaging your deals. The buy signals are accumulated and sent every time any of the chosen conditions are valid. This effectively dollar cost average your position every time the alerts are sent, lowering your average buy price. It is recommended to begin using this indicator with a low volume so you learn how this strategy affects your current deals. It can be useful on your red bags and put your reserve funds to use in an automated way, leaving your feelings on the sideline.
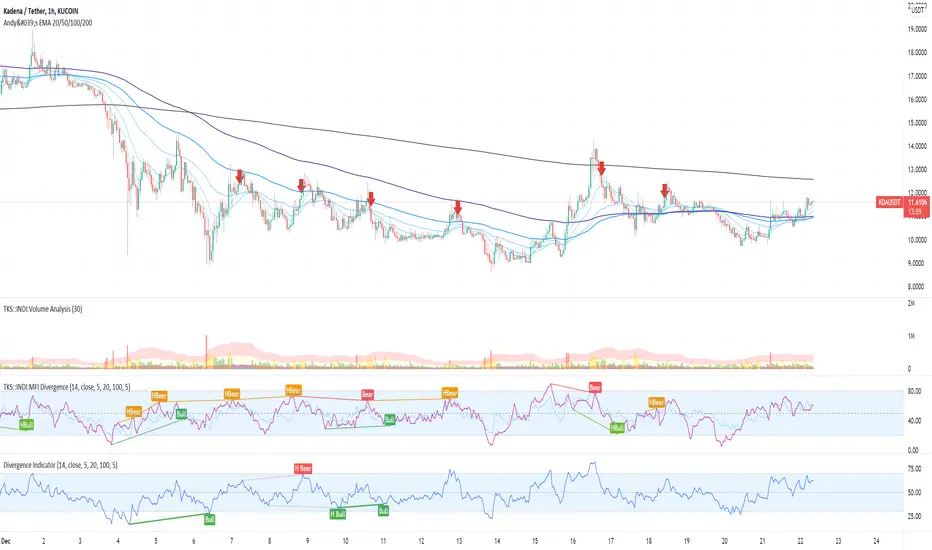
MFI Divergence Indicator Our Developer Malin converted the built-in RSI divergence indicator to MFI (Money Flow Index).
How to apply?
Notice 1: MFI, unlike the RSI, incorporates volume. It thus is an indicator of a higher precision when it comes to finding the the moment to sell - or - the moment to enter.
Notice 2: In Ranging Markets MFI (and RSI) is a solid momentum indicator to buy or sell. The asset displayed shows a slight markdown. Thus, we are looking primarily for short positions. Once can tell by us omitting the first 2 hidden bearish divergence signals and then entering the market.
Notice 3: Divergences depend on pivot points. The drawback with pivot points is that it is a lagging indication of a potential reversal. The more time (bars) one takes to confirm a reversal the less profitable is the trade - but less risky. In the charts one can tell that we enter the market 5 bars later. Usually that is not the tip of the reversal.
Notice 4: One must adapt the left and right periods of the indicator to risk/reward ratio, length of swing / frequency modulation and volatility of the price action.
Credits: Credits go to the Tradingview Team for delivering the original code. And Malin for the conversion. Please keep the copy right as a courtesy.
Indicador OMEP S============
ENGLISH
============
- Description:
This is an upgraded version of my previous indicator "OMEP" (feel free to check my profile to try it).
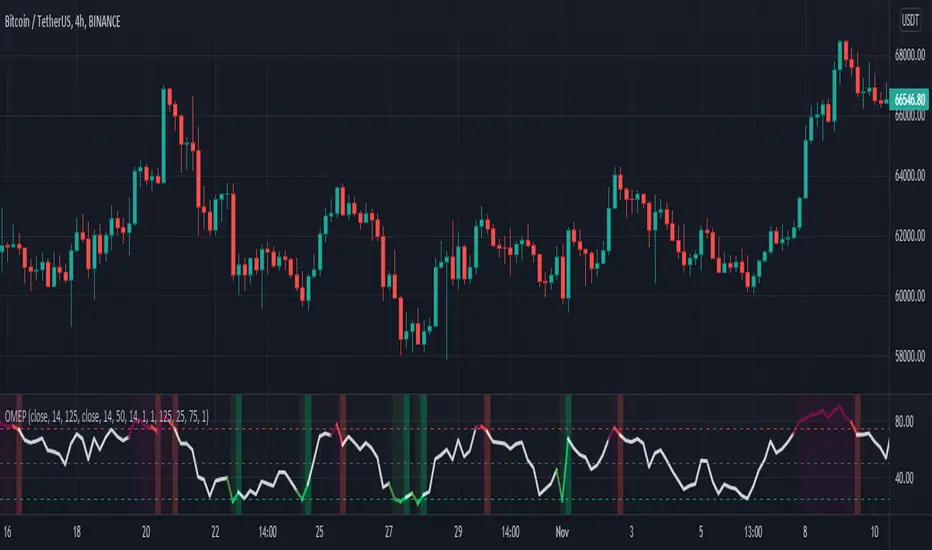
The OMEP is a momentum oscillator calculated by the combination (average) of RSI , MFI and STOCHASTIC to detect overbought and oversold levels.
The idea that the combination eliminates weaknesses and enhances strengths.
In this upgraded version (OMEP S) a signal line has been added to generate more accurate entry/exit signals, also 2 kind of triggers can be configured for futher customization, default settings have been updated for this version.
Consider the OMEP S as an advanced Stochastic.
- Usage:
You can use it as an RSI / MFI , when the OMEP is in the bottom area is considered OVERSOLD, when is in the upper area is considered OVERBOUGHT.
Thanks to the signal line added to this version you can use any Stochastic strategy aswell, in fact, you can customize visual alerts (background color changes) on crossovers (inside overbought and oversold areas) for faster signals and a more conservative option which shows the alers when both lines have left the area.
- Visual:
For ease of use i've added 3 horizontal lines, which are fully customizable:
Upper line: overbought level.
Mid line: just a reference line but can be used to enter/exit aswell like with some RSI strategies.
Bottom line: oversold level.
The color of the background changes depending on the location of the lines AND the chosen trigger (crossover or zone):
On crossover there're 2 colors for oversold and 2 colors for overbought: green when oversold and lime on crossover inside oversold area, maroon when overbought and red on crossover inside overbought area.
For the area trigger there're 3 colors: first color works the same, but a second light green/light marron shows when the OMEP line has already left the area and then the lime/red when both are out.
Therefore, in this second mode you can think about taking a position when the color starts to become lighter before both lines leave the area.
- Customization:
By default RSI , MFI and STOCHASTIC are hidden, only OMEP and SIGNAL lines are visible, but you can turn on/off and customize colors for any of them too.
Settings for all indicators and their relevance in the average calculation are configurable aswell, default values have been proved to work better on daily with a strategy tester., BUT also on lower timeframes if you take higher ones in mind (e.g. do not buy in 1H if it is overbought in 4H).
- Recommendations:
Higher timeframes are better, 1D is recommended to detect peaks and bottoms, 4H can be used for faster trades.
It was tested on various cryptocurrencies, if you have patience you can just buy the dips (5-10% each position) on daily.
Suggestions are welcome!
============
ESPAÑOL
============
- Descripción:
Ésta es una versión mejorada de mi anterior indicador "OMEP" (no dudes en echar un ojo a mi perfil para probarlo).
El OMEP es un oscilador de momento calculado por la combinación (media) de RSI , MFI y ESTOCÁSTICO para detectar niveles de sobrecompra y sobreventa.
La idea es que su combinación elimine debilidades y mejore sus fortalezas.
En ésta versión actualizada (OMEP S) se ha añadido una línea de señal para generar puntos de entrada/salida más precisas, también se pueden configurar 2 tipos de señales para una mayor personalización, los ajustes por defecto han sido actualizados para esta versión.
Considera el OMEP S como un Estocástico avanzado.
- Uso:
Se puede utilizar como un RSI / MFI , cuando el OMEP está en la zona inferior se considera SOBREVENDIDO, cuando está en la zona superior se considera SOBRECOMPRADO.
Gracias a la línea de señal añadida a esta versión puedes utilizar cualquier estrategia que aplicarías a un Estocástico, de hecho, puedes personalizar las alertas visuales (cambios de color en el fondo del indicador) en los cruces (dentro de las áreas de sobrecompra y sobreventa) para obtener señales más rápidas y una opción más conservadora que muestra las alertas cuando ambas líneas han abandonado la zona.
- Visual:
Para facilitar el uso he añadido 3 líneas horizontales, que son totalmente personalizables:
Línea superior: nivel de sobrecompra.
Línea media: sólo una línea de referencia, pero se puede utilizar para entrar/salir como como con algunas estrategias RSI .
Línea inferior: nivel de sobreventa.
El color del fondo cambia en función de la ubicación de las líneas Y de la señal elegida (cruce o zona):
En el cruce hay 2 colores para la sobreventa y 2 colores para la sobrecompra: verde cuando hay sobreventa y lima en el cruce dentro de la zona de sobreventa, granate cuando hay sobrecompra y rojo en el cruce dentro de la zona de sobrecompra.
Para la señal área hay 3 colores: el primer color funciona igual, pero un segundo verde claro/granate claro muestra cuando la línea OMEP ya ha salido del área y luego el lima/rojo cuando ambos están fuera.
Por lo tanto, en éste segundo modo puedes ir pensando en tomar una posición cuando el color empieza a tornarse claro antes incluso de que ambas líneas salgan del área.
- Personalización:
Por defecto RSI , MFI y ESTOCÁSTICO están ocultos, sólo la línea OMEP es visible, pero puedes activar/desactivar y personalizar los colores para cualquiera de ellos.
Los ajustes para todos los indicadores y su relevancia en el cálculo de la media son configurables también, los valores por defecto se han demostrado que funcionan mejor en diario con un tester de estrategias, PERO también en los marcos de tiempo más bajos si se tiene en cuenta los superiores (ej: no entres en compra en 1H si en 4H está sobrecomprado).
- Recomendaciones:
Los marcos de tiempo más altos son mejores, 1D se recomienda para detectar suelos y techos, 4H se puede utilizar para operaciones más rápidas.
Fue probado en varias criptomonedas, si tienes paciencia puedes comprar las caídas (5-10% cada posición) en el diario.
¡las sugerencias son bienvenidas!

Indicador OMEP============
ENGLISH
============
- Description:
The OMEP is a momentum oscillator calculated by the combination (average) of RSI , MFI and STOCHASTIC to detect overbought and oversold levels.
The idea that the combination eliminates weaknesses and enhances strengths.
- Usage:
You can use it as an RSI / MFI , when the OMEP is in the bottom area is considered OVERSOLD, when is in the upper area is considered OVERBOUGHT.
- Visual:
For ease of use i've added 3 horizontal lines, which are fully customizable:
Upper line: overbought level.
Mid line: just a reference line but can be used to enter/exit aswell like with some RSI strategies.
Bottom line: oversold level.
The color of the line and background changes:
Green: oversold.
Lime: OMEP just left oversold area and triggers an entry/long.
Maroon: overbought.
Red: OMEP just left overboughtarea and triggers an exit/short.
- Customization:
By default RSI , MFI and STOCHASTIC are hidden, only OMEP line is visible, but you can turn on/off and customize colors for any of them too.
Settings for all indicators and their relevance in the average calculation are configurable aswell, but default values have been proved to work better on daily with a strategy tester.
- Recommendations:
Higher timeframes are better 1D is recommended to detect peaks and bottoms, 4H can be used for faster trades.
It was tested on various cryptocurrencies, if you have patience you can just buy the dips (5-10% each position) on daily.
Suggestions are welcome!
============
ESPAÑOL
============
Descripción:
El OMEP es un oscilador de momento calculado por la combinación (media) de RSI , MFI y ESTOCÁSTICO para detectar niveles de sobrecompra y sobreventa.
La idea es que su combinación elimine debilidades y mejore sus fortalezas.
Uso:
Se puede utilizar como un RSI / MFI , cuando el OMEP está en la zona inferior se considera SOBREVENDIDO, cuando está en la zona superior se considera SOBRECOMPRADO.
- Visual:
Para facilitar el uso he añadido 3 líneas horizontales, que son totalmente personalizables:
Línea superior: nivel de sobrecompra.
Línea media: sólo una línea de referencia, pero se puede utilizar para entrar/salir como como con algunas estrategias RSI .
Línea inferior: nivel de sobreventa.
El color de la línea y del fondo cambia:
Verde: sobreventa.
Lima: OMEP acaba de salir de la zona de sobreventa y activa una entrada/long.
Granate: sobrecompra.
Rojo: El OMEP acaba de salir de la zona de sobrecompra y provoca una salida/short.
- Personalización:
Por defecto RSI , MFI y ESTOCÁSTICO están ocultos, sólo la línea OMEP es visible, pero puedes activar/desactivar y personalizar los colores para cualquiera de ellos.
Los ajustes para todos los indicadores y su relevancia en el cálculo de la media son configurables también, pero los valores por defecto han demostrado la mejor efectividad en temporalidad de 1D.
- Recomendaciones:
Las temporalidades mayores son mejores, se recomienda 1D para detectar suelos y techos, en 4H se puede usar para operaciones más rápidas.
Se ha probado en varias criptomonedas, si tienes paciencia puedes comprar los dips (5-10% cada posición) en diario.
¡Las sugerencias son bienvenidas!
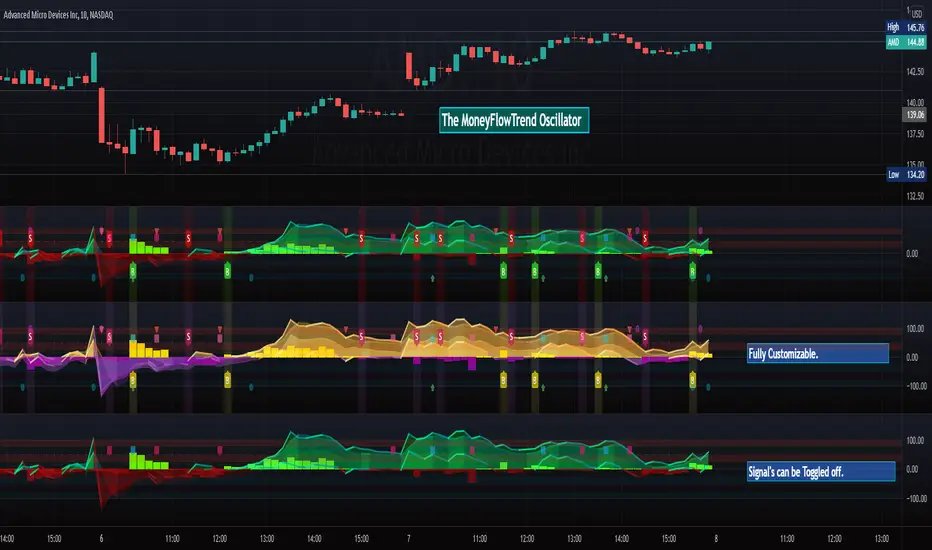
MoneyFlowTrend Oscillator (cc) [M.Right]Hey Traders,
Tonight I present to you a brand new indicator.
I call it the MoneyFlowTrend Oscillator . This is another one that I've been piecing together for years and learning how to code pine has allowed me to bring it to life.
Built on the idea of Supply & Demand Zones , this utilizes money flow and numerous calculations to create a picture of what is happening underneath the surface of the price action.
Richard Wykoff was one of the first market analysts to explain how the economic cycle can be applied to explain market price action; thus, technical analysis. He described two zones among the total of 4 phases; the two zones are Distribution and Accumulation zones, also known as Supply & Demand zones.
______________________________
Since most of you already know the economic cycle, I will try to be concise.
The basic ideas:
When supply is greater than demand, the price goes up down.
When demand is greater than supply, price goes up.
When demand is equal to supply, the price stays about the same (going sideways).
Price action has --Uptrends, downtrends, and price ranges (consolidation).
Wykoff's 4 phases to explain this price action :
1) Accumulation ( Demand zone)
2) Markup (Uptrend)
3) Distribution ( Supply zone)
4) Markdown (Downtrend)
______________________________
With all that said, usually you will either see a sharp jump from a supply or demand zone or it will consolidate within it. Until a new one is formed on the chart.
This indicator attempts to put all of that into a lower indicator. I tried to separate the retailers and the banks and then put them back together to get a full picture.
The MoneyFlowTrend Oscillator Signals are super accurate.
((accuracy can't always be this close to perfect.))
These are the signals + highlight that I have activated, you can toggle on and off between them.
Fully customizable and includes alerts.
Good luck traders.
Cheers,
Mike
Circular Barplot - Oscillators Sentiment [LuxAlgo]This indicator is an implementation of a circular barplot aiming to return the market sentiment given by multiple normalized oscillators. These include the relative strength index (RSI), Stochastic %K (%K), Linear Correlation Oscillator (ROSC), William Percent Range (WPR), Percent Rank (%R), and money flow index (MFI).
The length period of each of these oscillators can be adjusted in the indicator settings.
The label in the center of the circular plot returns the average market sentiment constructed from all the previously mentioned oscillators.
Settings
Width: Circle width.
Spacing: Determines how close each circle is to the other.
Thickness: Width of the colored lines.
Offset: Controls how far the circular barplot left extremity is from the most recent candles.
Src: Input source of the indicators.
Usage
Unlike regular bar charts, circular bar plots display the bars as circle arcs and have the advantage of preserving horizontal and vertical space. A higher arc length would indicate a value closer to the maximal value of the oscillator. Other variations of the circular barplots exist but this variation using the circle arc is particularly appropriate for normalized data.
The indicator can be used as a simple widget giving a quick method to obtain the overall market sentiment of a certain ticker. A dashboard is displayed on the top left of the chart in the event the user wants to see the actual value of the oscillators.
Note that low width or high spacing settings might return unwanted results.

EWO Breaking Bands & XTLElliott Wave Principle, developed by Ralph Nelson Elliott , proposes that the seemingly chaotic behaviour of the different financial markets isn’t actually chaotic. In fact the markets moves in predictable, repetitive cycles or waves and can be measured and forecast using Fibonacci numbers. These waves are a result of influence on investors from outside sources primarily the current psychology of the masses at that given time. Elliott wave predicts that the prices of the a traded currency pair will evolve in waves: five impulsive waves and three corrective waves. Impulsive waves give the main direction of the market expansion and the corrective waves are in the opposite direction (corrective wave occurrences and combination corrective wave occurrences are much higher comparing to impulsive waves)
The Elliott Wave Oscillator ( EWO ) helps identifying where you are in the 5 / 3 Elliott Waves , mainly the highest/lowest values of the oscillator might indicate a potential bullish / bearish Wave 3. Mathematically expressed, EWO is the difference between a 5 period and 35 period moving average. In this study instead 35-period, Fibonacci number 34 is implemented for the slow moving average and formula becomes ewo = sma (HL2, 5) - sma (HL2, 34)
The Elliott Wave Oscillator enables traders to track Elliott Wave counts and divergences. It allows traders to observe when an existing wave ends and when a new one begins. Included with the EWO are the breakout bands that help identify strong impulses.
The Expert Trend Locator ( XTL ) was developed by Tom Joseph (in his book Applying Technical Analysis) to identify major trends, similar to Elliott Wave 3 type swings.
Blue bars are bullish and indicate a potential upwards impulse.
Red bars are bearish and indicate a potential downwards impulse.
White bars indicate no trend is detected at the moment.
Added "TSI Arrows". The arrows is intended to help the viewer identify potential turning points. The presence of arrows indicates that the TSI indicator is either "curling" up under the signal line, or "curling" down over the signal line. This can help to anticipate reversals, or moves in favor of trend direction.

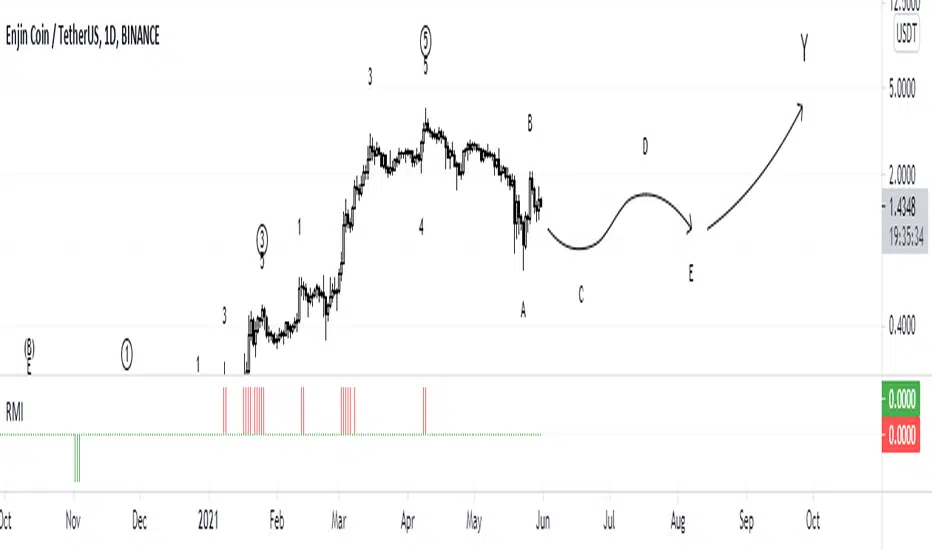
RMIRMI is a combination of RSI and MFI oscillators which considers money flow and strength of supply or demand together.
It estimates that the money of which side is being ran out.
So the power of trends can be predictable approximately.
Where the green columns appear, it means demand is very high and it can fall because buyers may withdraw and sell their assets.
And when red columns appear, it means supply is very high and sellers or new buyers may enter into new deals which may increase the price of a asset.
I would be glad if I hear your feedbacks.
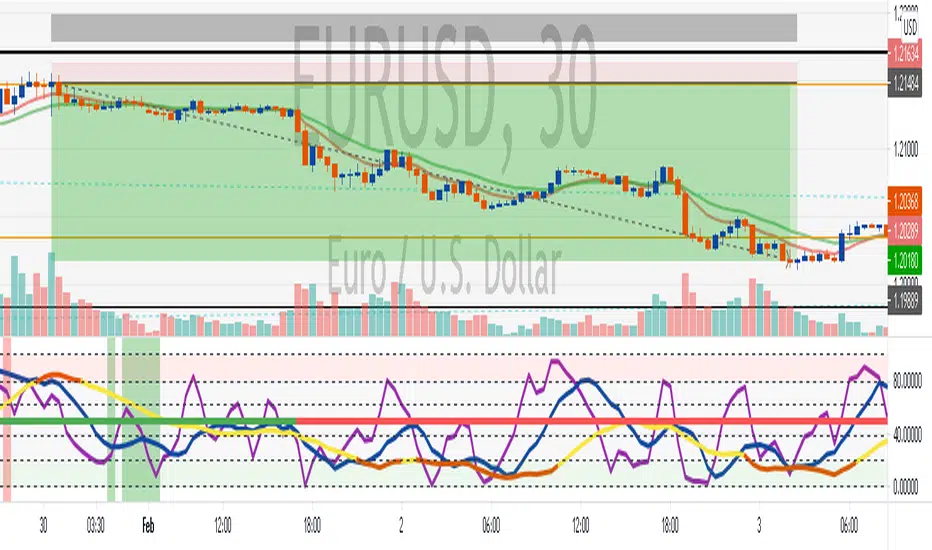
ModestPips RSI + Apirine Slow RSIThis script is composed of 4 elements:
EMA Cross Indicator
Money Flow Indicator Oversold/Overbought
RSI with divergence indicator
Apirine Slow RSI
EMA Cross:
The EMA Cross provides a rough idea of trend direction. The 50 horizontal line will flash green/red depending on the current EMA crossover status.
The EMA values can be changed depending on your preference.
This indicator is not used for entries. It only provides confluence for entries.
Money Flow Indicator:
The money flow indicator will flash green/red in the background when it is oversold/overbought. It could be referred as an early signal before a potential big move.
Not used for entries, just as a warning to get ready for a potential big move.
RSI Indicator:
Typical RSI that shows indicates when divergences are detected
Apirine Slow RSI:
Generates OB/OS signals & midline crossover signals and divergence
Configured with high smoothing to show trends in the markets (This value can be adjusted). When maxed out in either direction, can help to identify strong trends in the market.
Thanks to @Lazybear for providing the code for the slow RSI.

ModestPips Triple StochasticThis script was created to provide confluence when entering trades. Trades are entered as scalp trades with trailing stops, that sometimes turn into swing trades.
This script is composed of three elements:
EMA Cross Indicator
Money Flow Indicator Oversold/Overbought
Triple Stochastic - The Core Component of this script
EMA Cross:
The EMA Cross provides a rough idea of trend direction. The 50 horizontal line will flash green/red depending on the current EMA crossover status.
The EMA values can be changed depending on your preference.
This indicator is not used for entries. It only provides confluence for entries.
Money Flow Indicator:
The money flow indicator will flash green/red in the background when it is oversold/overbought. It could be referred as an early signal before a potential big move.
Not used for entries, just as a warning to get ready for a potential big move.
Triple Stochastic:
This is the core and magic of the script. This indicator uses the 3 stochastic to provide signals for trade entries.
The 3 stochastics use different calculations to provide the differing length of the oscillators.
The slow stochastic will flash red when in overbought/oversold areas.
Using these 3 stochastics can provide 3 types of entries.
Trade Entries:
Extreme Opposite Entry - Entry when slow stoch is red and the super-fast stoch is on the opposite extreme.
Rebound Entry - Entry upon reversal signal where super-fast and fast stochs trigger a move in the opposite direction and then retrace to retest the slow stoch.
Continuation Entry - Entry during a trending market when super-fast and fast stochs retrace to retest the slow stoch.
This indicator can be used with any timeframes, although 30m is where I find the cleanest signals.
Some examples are provided on the chart, I will provide detailed explanations for ideal signals below.
ArtY Money Flow IndexThis is modification of built-in Money Flow Index with painting of oversold and overbought areas.

Money Flow Index (MFI)User request. A tuned version of the built-in True Strength Index (TSI) indicator with the following options included:
MFI - Signal Histogram
MFI/Signal Crossovers
MFI/Signal Ribbon
Bands breakouts highlighting
Middle line crossovers background

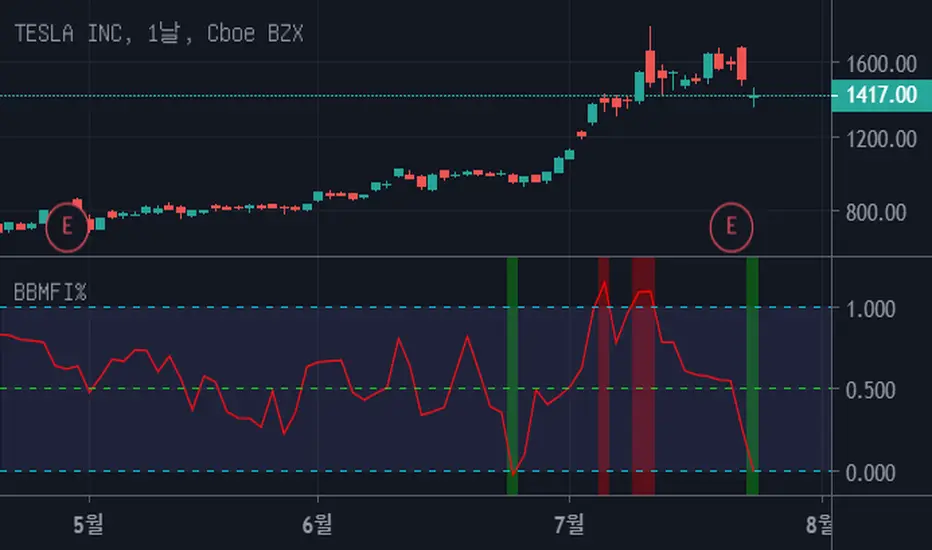
Bollinger Bands Money Flow Index %This script is similar to the previous one "Bollinger Bands Money Flow Index" but it's a little easier to interpret.
Fix the top line of the "BBMFI" to 1, and the bottom line to 0.
Indicates where "Money Flow Index" is located between the top and bottom lines.
If it's bigger than 1, it's overbuying. If it's less than 0, it's overselling.
Consider a trade if you are out of range from 0 to 1.
It's also a good trade timing to out of range and come back in.
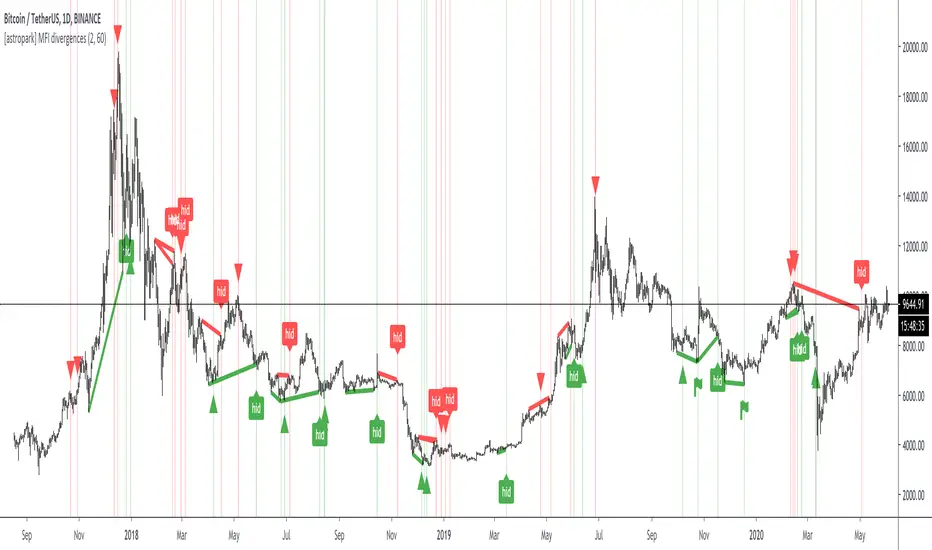
[astropark] MFI divergencesDear Followers,
today a new great Scalper Tool , based on a custom version of Money Flow (MFI) oscillator, which works on both Candlesticks, Heiking Ashi and Renko charts , from 1 second Renko chart and above (on non Renko charts, the higher, the better of course!), both on FOREX, Cryptocurrencies, Stocks and Commodities!
This tool has some cool features:
it works on all timeframes , on both Renko, Heikin Ashi and Candlesticks chart
it shows you both bullish and bearish divergences with a triangle up or down respectively
when it finds a strong bullish/bearish divergence , a flag will be displayed instead of a triangle
it shows you both hidden bullish and bearish divergences with a label "hid"
This script will let you set all notifications you may need in order to be alerted on each triggered divergence.
You may like to use it together with my Renko OBV Divergences indicator (which works on Candlesticks and Heiking Ashi too)
and my Renko RSI Divergences indicator (which works on Candlesticks and Heiking Ashi too)
On Bitmex/ByBit/Binance Bitcoin/USD chart best Renko settings is Traditional Renko chart with 11$ box size, while 0.5$ box size is suggested on Ethereum/USD pair.
This is a premium indicator , so send me a private message in order to get access to this script.
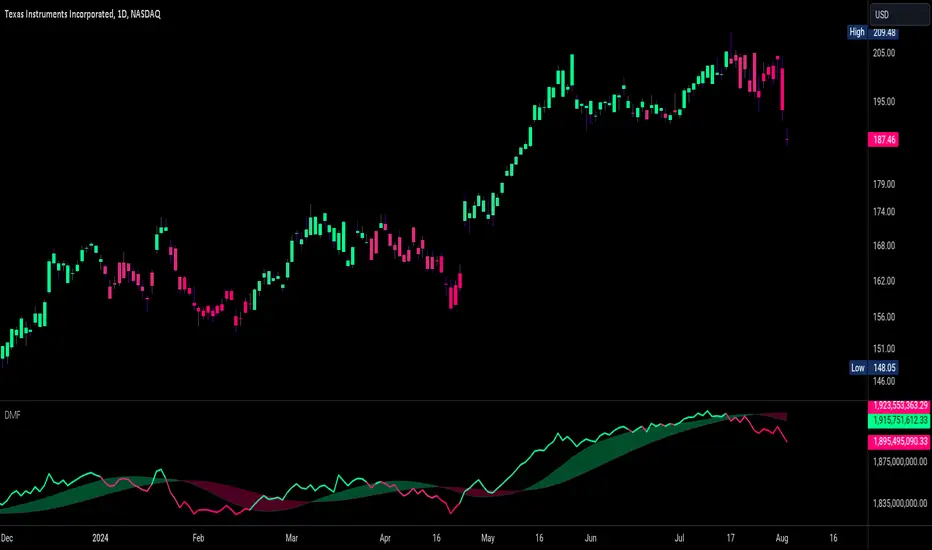
Dynamic Money FlowDynamic Money Flow is a volume indicator based on Marc Chaikin's Money Flow with a few improvements.
It can be used to confirm break-outs and trends.
Zero line crosses and divergences can provide useful signals while considering chart analysis as well.
Two weaknesses of CMF have been already fixed by Colin Twiggs (IncredibleCharts)...
1.CMF uses Chaikin's accumulation/distribution line to calculate the flow of money.
Accumulation/distribution line does not take the gaps into account. This can be solved using true range.
I call it true accumulation/distribution.
2.Oscillators have a tendency to center because of averaging calculations.
DMF is average of flowing volume divided by average of total volume. This means indicator plots the change of first factor compared to the other one. In Simple Averaging method every data is given an equal weight thus when the last data drops it will have heavy impact on the averages and the change of them.
It is much easier to identity these impacts after the drop of very high or very low data... So reducing the weight exponentially is a better option.
3.There is something else with CMF... changes of close price is ignored, because the formula only compares close price to its range.
To include the movements of close beside the close to range comparison, the distance between two last close prices should be compared to true range as well.
So volume can be distributed between close to range comparison (True Accumulation/Distribution) and close to close comparison automatically. And then results are summed to have a single multiplier.
An example for how close to close comparison affects DMF...
Or here you can see how lower wicks keep TMF (same as CMF in this case) from crossing zero line while price is trending down.
High-Low- Signal (Expo)High-Low-Signal (Expo)
DESCRIPTION
This simple but powerful High-Low indicator plots price extremes. Either it’s an exhausting sign or a continuation sign of the trend. The color of the cloud determines the trend, and the height of the peaks determines the strength in the price moves. You can easily compare current peaks with historical ones to understand the current dynamics and what might happen next.
This indicator is a must if you want to understand price dynamics in the market. The indicator is perfect to combine with other indicators to confirm the signal.
For example:
Combine it with trend lines/Channels/Bollinger Band, you name it! If the indicator peaks in conjunction with that the price reaches a trend line/Channels/Bollinger Band. It's a great sign!
HOW TO USE
1. Look for a signal
2. Identify the color and height of the peak. Compare it to historical ones to get an understanding of the current market dynamics.
3. Combine the indicator with e.g. trend lines/Channels/Bollinger Band
4. Consider Enter the market.
INDICATOR IN ACTION
BTCUSD
BTCUSD
BTCUSD
Wall Street
EURJPY
EURUSD
GOLD
I hope you find this indicator useful , and please comment or contact me if you like the script or have any questions/suggestions for future improvements. Thanks!
I will continue to work on this indicator, so please share your experience and feedback with me so that I can continuously improve it. Thanks to everyone that have contacted me regarding my scripts. Your feedback is valuable for future developments!
ACCESS THE INDICATOR
• Contact me on TradingView or use the links below
-----------------
Disclaimer
Copyright by Zeiierman.
The information contained in my scripts/indicators/ideas does not constitute financial advice or a solicitation to buy or sell any securities of any type. I will not accept liability for any loss or damage, including without limitation any loss of profit, which may arise directly or indirectly from use of or reliance on such information.
All investments involve risk, and the past performance of a security, industry, sector, market, financial product, trading strategy, or individual’s trading does not guarantee future results or returns. Investors are fully responsible for any investment decisions they make. Such decisions should be based solely on an evaluation of their financial circumstances, investment objectives, risk tolerance, and liquidity needs.
My scripts/indicators/ideas are only for educational purposes!
