Trader Set - Volume CandleThis is a candlestick system but not on price. These candles are drawn based on the volume movement. This is one of those professional charting systems that big industries use every day. Remember, the key to find what smart money is doing, is always VOLUME. Any new way that you can track new aspects of volume will help determining what the market will do, BEFORE it starts doing it !
There are total of Seven moving averages that you can ...:
1- Set their period separately
2- Set their type separately
3- Turn on/off separately
The averaging types that are supported, remember you have options PER moving average :
- SMA
- EMA
- RMA
- WMA
- HMA
- KAMA
- MAMA
- FAMA
This script IS FOR SALE , you can buy it with crypto currencies, or webmoney or perfect money. THE PRICE is 55$. for life time license.
You can find all the crypto wallet addresses plus webmoney and perfect money accounts in the link below. Please send the correct amount PLUS the transaction fee. After the transaction is confirmed, contact me with the info of the transaction for granting access.
AَِDDRESSES FOR WALLETS : justpaste.it
Moving

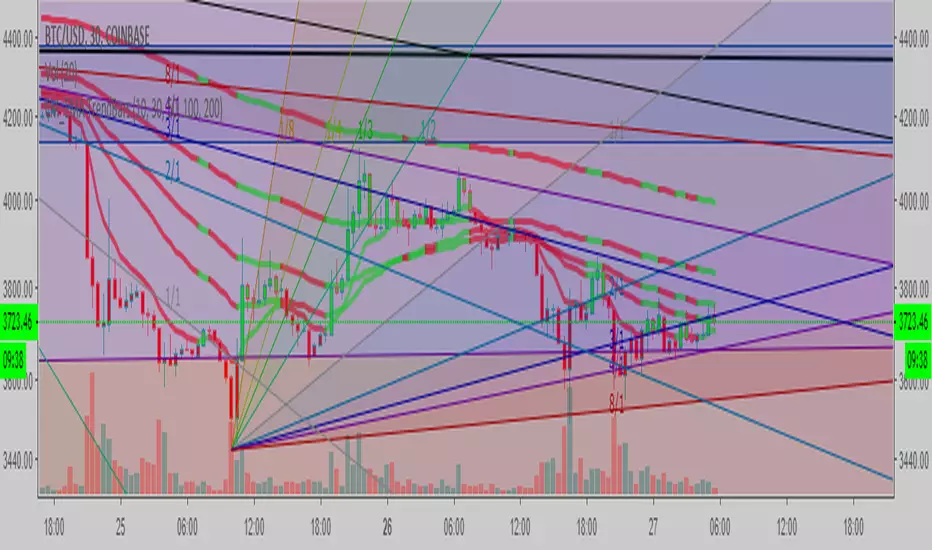
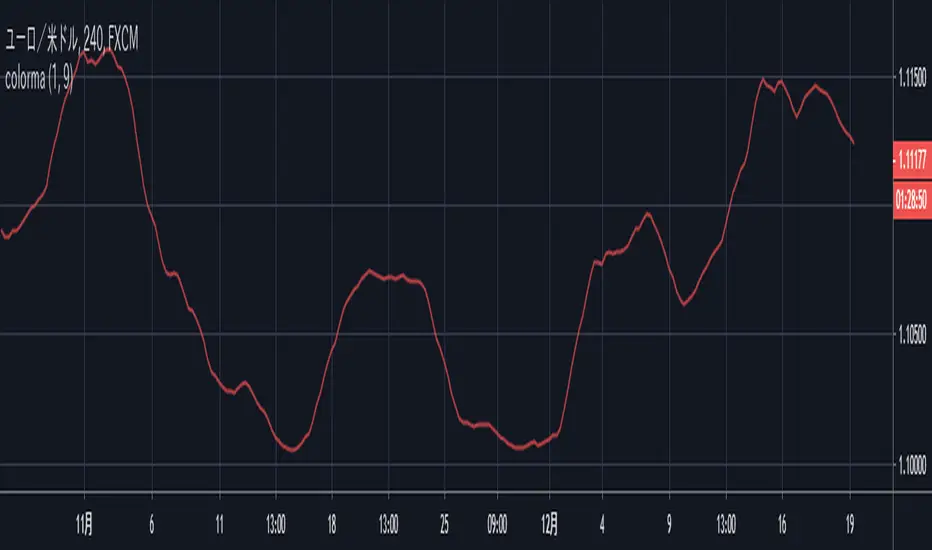
[code-piece] change plotted color with input()plotted colored moving average.
Plotted color can be changed by indicator's setting dialog.
It's useful for user to be able to change the color according to background color.
1 = red
2 = blue
3 = green
4 = yellow
5 = lime
6 = aqua
7 = orange
8 = white
other = black

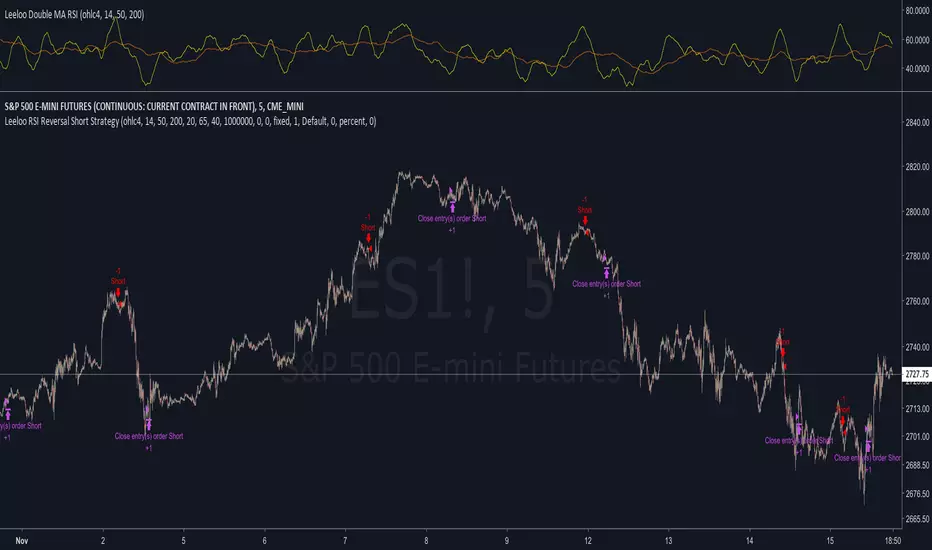
Leeloo RSI Reversal Short StrategyThis strategy is based on applying two moving averages to RSI and then opening a short position when the short-length average is above the slow-length average, has recently changed direction within the last n bars, and is in overbought territory.
Default settings work best on short intervals (5min)
Don't be afraid to use extended hours
Everything is based on last complete bar; once something shows up it is good to go
Optimised Moving AverageAbout
This tool measures the profitability of every moving average length combination between 5 and 40 and only displays the most profitable combination.
The Optimised Moving Average can be tested using a Moving Average strategy and the Strategy Tester panel on any instrument or time-stamp.
This can be used on its own, or paired with the Intelligent Moving Average (AI) for a better understanding of the indicators movements.

Triple guppy w/ up/down colours - squattterThe trend is your friend.
Works well on 2hr TF which shows 30+60 ema from 8hr and Daily TFs.
Use a higher TF momentum indicator such as TRIX to confirm.

CriptoImpulso - InOut The script evaluates several indicators such as moving average, exponential moving average and other indicators, to make a decision and show a possible opportunity for entry and exit. In addition to the entry and exit, pivots are provided based on the values of daily closures, to find supports and resistances.
This script works with low timeframes (1,3,5,15) and is easy to use, the green label arrows below the candles show the possible entries and the magenta label arrows above the candles show the possible exits.

15minMAThis script lets you plot a simple or exponential moving average from a specific time frame that you can select. For example, if you always want the Daily 50MA on your chart, regardless of what resolution your chart is on, this will do it. It's also color coded to show if it's rising or falling.

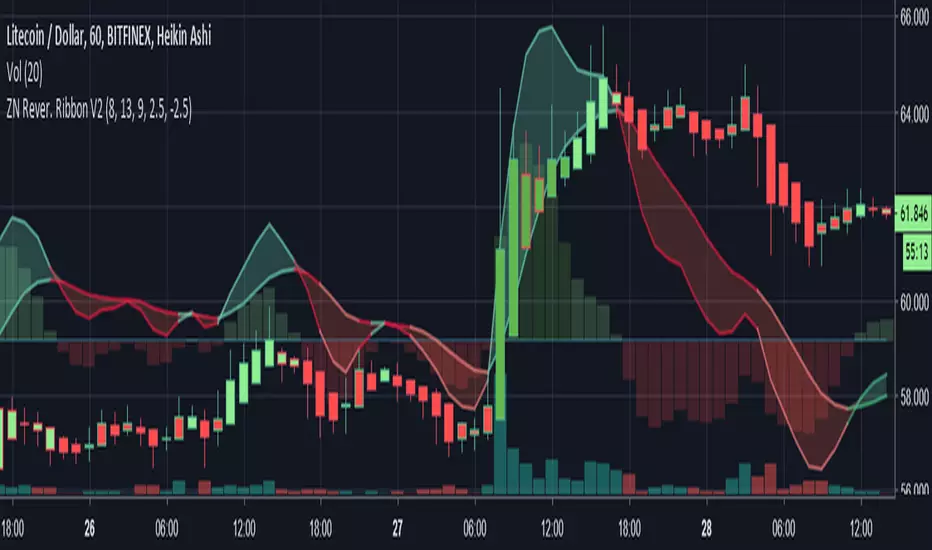
Librehash Reversion Ribbon V2Out of all the indicators created by this brand, this is probably the grandest of them all.
Known as the ‘ZN Reversion Ribbon V2’, for short, this indicator is designed to:
1. Create multiple buy and sell signals
2. Help users gauge the momentum of the price movement.
3. Re-color candles to give users a better understanding of price direction as well as plotting entries and exits.
4. Serve as an enhanced version of the MACD indicator.
5. Effectively gauge buy and sell pressure at any given point in time by using former price data.
There are a lot of moving parts to this indicator, so this guide will be dedicated to dissecting these moving parts, piece by piece.
#1 — Histogram
Perhaps the simplest part of the indicator to dissect at the start is the Histogram. This is also the part of the indicator that can be the most important complement to any other readings that are being made.
You read the histogram in the same manner that you would read the Histogram for the MACD.
The bars in the background are the histogram. Reading this portion of the indicator is fairly simple though.
1. As the green bars get darker, the buy pressure is increasing.
2. As the red bars get darker, the sell pressure is increasing.
3. If the current bar is larger than the last, the trend is sustained. This is the same principle that you would observe in the MACD. The core difference, however, is that this indicator is plugged in with a specific formula (beyond just the basic moving averages), that make them more responsive to price movement in a way that allows for the anticipation of signals being formed.
#2 — Ribbon
The ribbon on this indicator has about 3 different buy/sell signals embedded within it that will allow traders to anticipate an impending change in trend well before it EVER occurs.
This may be the most valuable part of the indicator itself.
Let’s start with the first facet of the ribbon.
A) — The ‘widening’ of the ribbon
When the ribbon ‘expands’, that means that the trend is ‘strengthening’ or growing. When the ribbon narrows or ‘contracts’, that means that the trend is becoming weaker and that this may serve as a warning of impending trend reversal.
In the picture above, you can see the color change of the ribbon itself as well.
You’ll notice that the ribbon transitions from a darker red to a lighter red. That’s a sign of waning sell pressure. You can apply this concept to the green portion of the ribbon too.
B)— The Line Sometimes Signals Before the Cross
This one is a bit harder to explain, but the way that the indicator is programmed is not to turn ‘green’ or ‘red’ based on the crosses, but rather on a mathematical formula.
Now, because of the way the indicator is programmed, the cross often coincides with the color change — but not always.
Below is an example:
Of course, beyond this, there are the usual buy and sell signals that come with the MACD as well.
For instance, there is —
C) The Change in Direction of the is a ‘Buy’ or ‘Sell’ Signal As Well
--------------
Changes in the Candle Colors
Perhaps the most elaborate part of this indicator is the fact that it changes the colors of the candles on the chart in live time without repainting.
In order to understand the candles, here’s a quick guide:
a) dark green with green outline = extreme buy pressure
b) lighter green with green outline = normal buy pressure
c) dark red = heavy sell pressure
d) light red = light sell pressure
e) dark green with red outline = impending reversal downward
f) purple with any outline = ambiguous / neutral
g) light green with red outline = very, very weak sell pressure
h) dark green with red outline = exhausted buy pressure
f) dark red with green outline = exhausted sell pressure
Effectiveness of Indicator
This indicator has the ability to be a ‘game changer’ in terms of its ability to dissect price action.
This next picture is another awesome example of how this indicator works.
Check it out:
Here are the multiple reasons why we could’ve anticipated the reversal in price direction before red candles started showing up:
1. The actual reversion lines themselves began to converge.
2. The Histogram is declining.
3. The bar colors move from dark green to light green.
Now, you may be looking at the above picture and thinking, ‘Well it seems that it didn’t catch the major upswing in the price later though’.
This is true, however —
The gain from this move was preposterous.
Even still, the indicator ensures that we still garner some pretty significant profits.
Conclusion
What you see here sums up this indicator for the most part. However, there are continued updates that will be put out for the indicator in the near future as well.
As always, these can be pushed directly through TradingView (which will happen soon).

Moving Average 6xDisplays up to six moving averages at a time in one indicator.
Default: 5, 10, 20, 50, 100, 200

Binque's Stop LossFixed Script only showing Daily Stop Loss. Now will show stop loss based on the resolution of the chart you are on, i.e. 1 min, 5 min, 15 min, 1 h, 4 h, 1 d, 1 w, 1 month, etc...


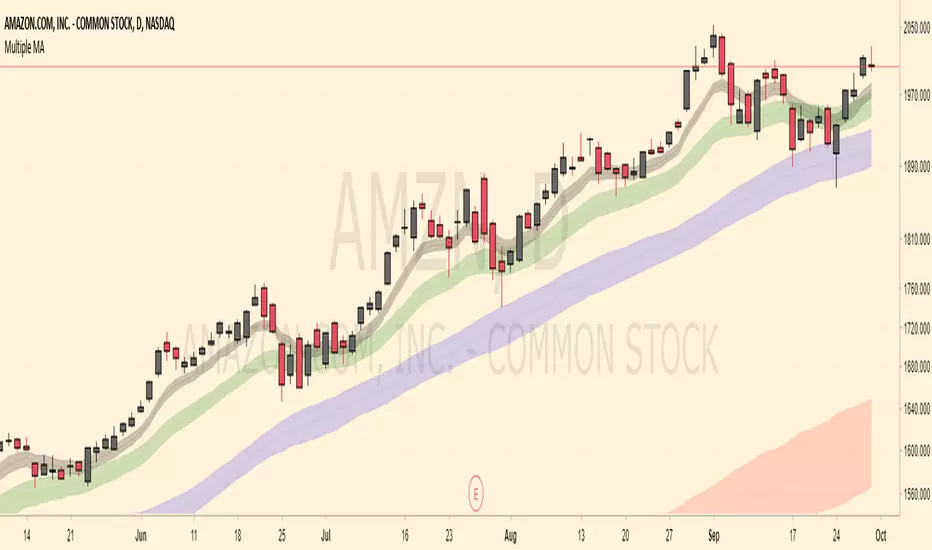
Multiple MA (techsound088)Common moving addresses often act as support and resistance levels. This script will incorporate four (2 exponential and 2 simple ) moving averages. The default are lengths of 8, 20, 50, and 200. These are adjustable. Many of us are aware that these areas often tend to be supply / demands zones. We are also aware that movement around these areas can fluctuate greatly so I've included ATR-based bands around the moving averages hoping to visualize these moving averages in a less rigid and more realistic way. Feel free to modify this script as you please. Constructive feedback is always appreciated.
Edge of MomentumThe script was designed for the purpose of catching the rocket portion of a move (the edge of momentum).
Long
--When RSI closes over 60, take long order 1 tick above that bar. The closed bar above RSI 60 will be colored "green" or whatever color the user chooses. (RSI > 60)
--On a long position, exit will be a closed bar below the ema (low, 10) . The closed bar below the ema will be colored "yellow." (Price < ema)
--Note: On a long position there is no need to exit when a closed bar is colored "purple." RSI is just below 60 but above 40. Pullback or chop
Short
--When RSI closes below 40, take a short order 1 tick below that bar. The closed bar below RSI 40 will be colored "red." RSI<40)
--On a short position, exit will be a closed bar above the ema (low, 10). The closed bar above the ema will be colored "purple." (Price > ema)
--Note: On a short position there is no need to exit when a closed bar is colored "yellow."
Note: You may see a series of purple and yellow bars, that is simply chop. I define chop as RSI moving between 60 and 40.
Trade should only be taken above green colored candle(long) and below red colored candle (short). No position should be taken off yellow or purple candle (chop)
Again this is designed to catch the momentum part of a move, and to help reduce some entries during chop. It is a simple systems that beginning traders can use and profit from.
Note: I don't no shit about coding scripts I just learn from reading others.
Enjoy. If you decide to use please drop me a line...suggestions/comments, etc.
Best of luck in all you do.

Ehlers FilterThis is the Adaptive Ehlers Filter.
I had to unroll the for loops and array because TV is missing crucial data structures and data conversions (Arrays and series to integer conversion for values).
I'm in the process of releasing some scripts. This is a very old script I had. This contains volatility ranges and can be used as trading signals. You can also see how the EF moves up or down, the direction, when price is sideways, and use price breaks up and down as signals from the line.
Have fun, because I didn't making this script hahaha
NOTE : There is an issue with the script where at certain time frames it positions itself below or above. I think its due to calculations. If anyone knows the fix before I get the chance to take a look at it, please let me know.
books.google.com

Octal EMA + SMAThis script gives the most required moving averages in one indicator.
Designed in a better way to make traders experience easier in tradingview.
Gives the traders to find the support and resistance.
Offers better flexibility to the traders to choose their preferred moving averages.
Traders can choose EMA or SMA for every moving average separately.
Hope you like my indicator. Keep trading. Gain profits.
Kindly support me with your likes.

Momentum Strategy, rev.2This is a revised version of the Momentum strategy listed in the built-ins.
For more information check out this resource:
www.forexstrategiesresources.com

Easy ma cross strategyEasy ma cross strategy.
Works fine in sideways or bullish market.
Don't forget to use a stop-loss!

Marker bullish trending momentum swing trade strategyLooking for bullish trending upward momentum, then selling at the top. Stop losses and max drawdown configurable based risk profile and stock/ETF. Please follow me if you like this signal strategy.

5 Moving Average Exponential 7-15-30-50-2005 Moving Average Exponential. Crypto EMA. 7 is a fast support or resistance, 15 confirmation support or resistance. 30 Important support and resistance. 50 institutional support or resistance. 200 general trend, support and resistance.
