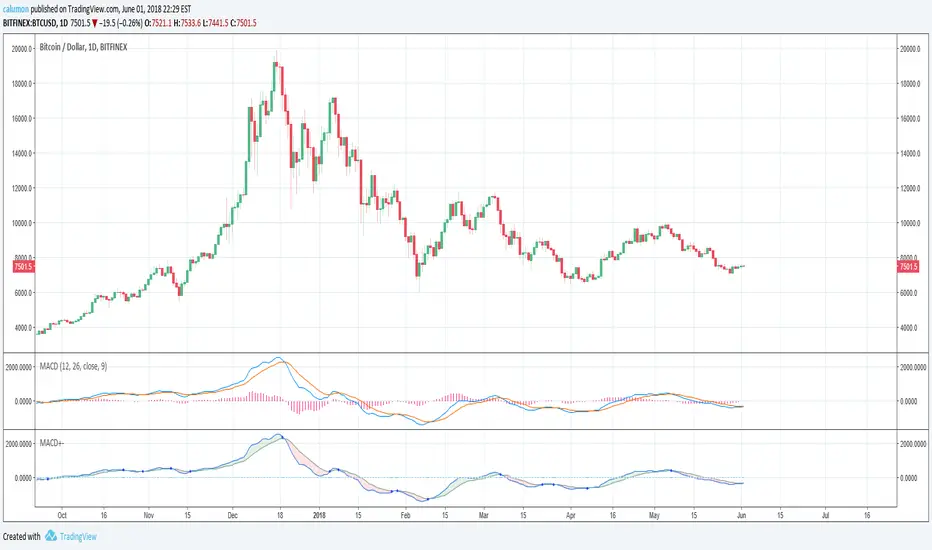
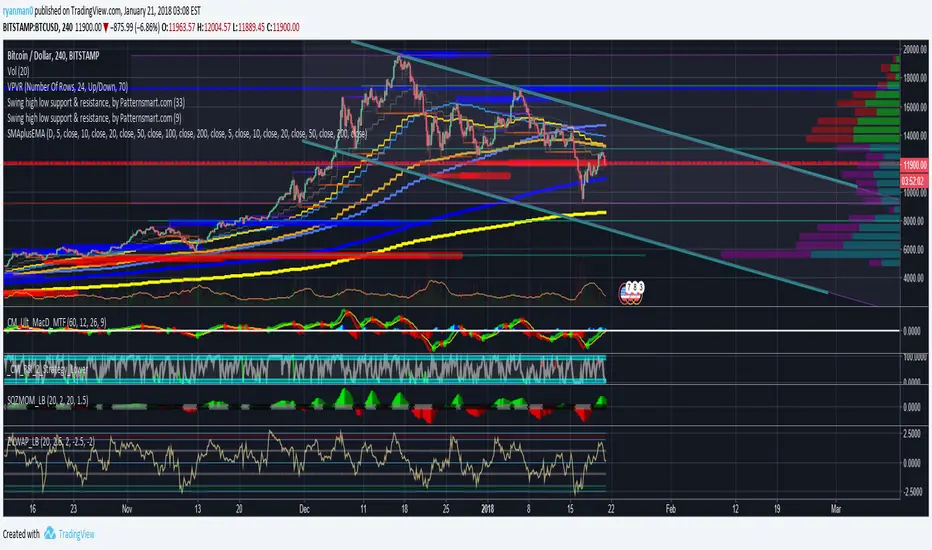
MACD with highlighted positive and negative trendThe values used by this indicator are equal to MACD 12 26 9 (and Signal). Only changes are made to looks:
If MACD closes higher than Signal, then we are seeing green. Else, we are seeing red.
Another point is that we get a blue circle when there is a trend change from bullish to bearish or vice versa. Please note that there needs to be an offset for this. We will only see the circle, when there already WAS (instead of is) a trend change.
Moving
SMA/EMA 12|26|50SMA/EMA 12|26|50
Exactly as title says
SMA is bold
EMA is light
Orange 12
Green 26
Blue 50


EMA Min0nat0rEMa based on the Fibonacci sequence of numbers.
Perfect to trade on leverage.
Min0taur0

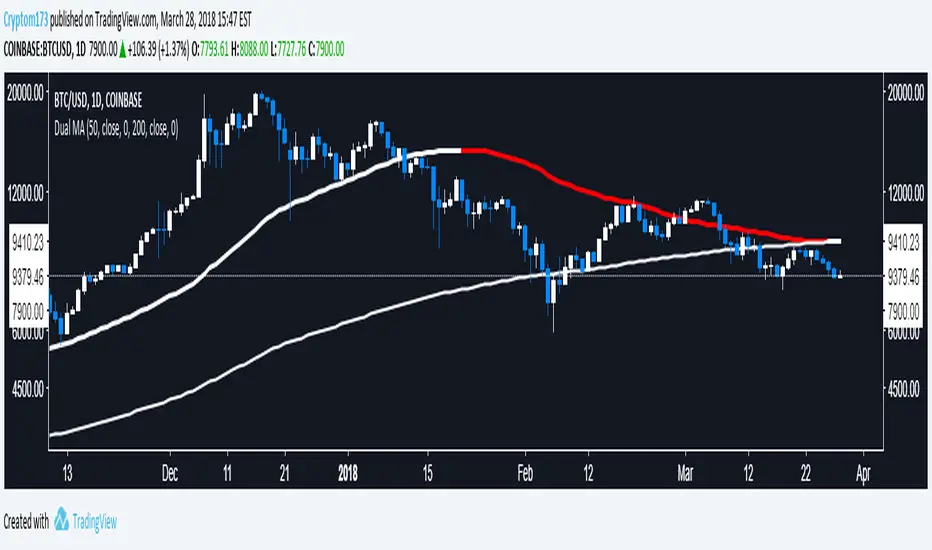
Dual Moving AverageGiven the limitation on indicators, I figured it would be nice to combine a couple into a single indicator. I'll likely make another one for EMA or make one that lets you use whichever type of moving averages you want.
Philakone 55/100 EMA incl. color & sizeInspired on Philakone's EMA settings in his colors and line width. Also added 100 EMA.
Multiple Moving AveragesThis is really simple. But useful for me as I don't have a paid account. No-pro users can only use 3 indicators at once and because I rely heavily on simple moving averages it can be a real pain.
This one indicator features:
20 MA
50 MA
100 MA
200 MA
which I find are the most useful overall. The 20 and 50 over all time frame but in particular < 1 day, the 100 and 200 at > 4 hr time frames. In general I don't use the 100 MA that much. The daily 200 MA is a critical support for many assets like stocks and cryptos. I'm by no means a pro and if you are learning I recommend becoming familiar with moving averages right at the beginning.
If you want to deactivate some of the lines, you can do it via the indicator's settings icon.

Always show daily EMAThis script will always plot the daily EMA regardless of which timeframe you are on.

Triple Simple Moving AveragesBased on AdventTrading's TEMA script, but using simple moving averages instead of exponential. Also changed the colours to be nicer.

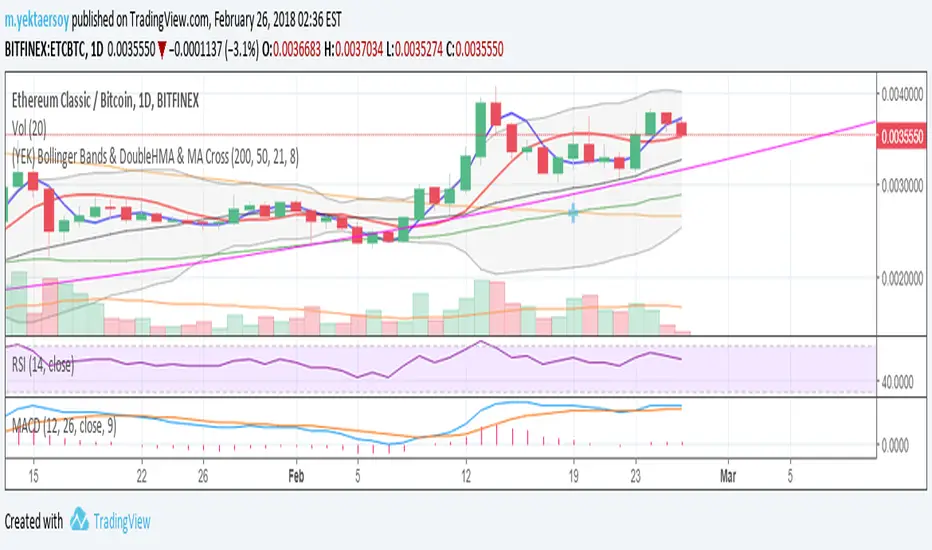
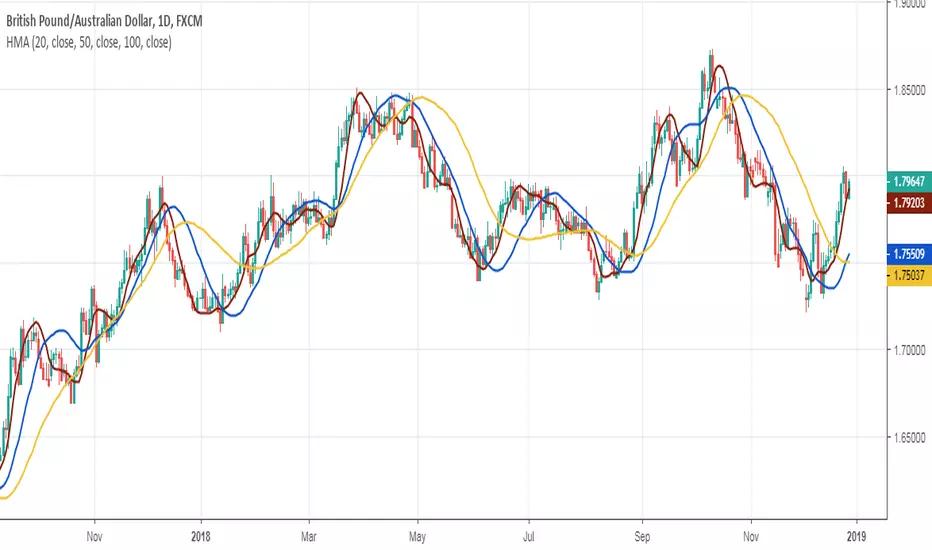
(YEK) Bollinger Bands & DoubleHMA & MA CrossMy favorite indicators ALL-IN-1: Bollinger Bands, Double Hull Moving Average (21,8), Double Moving Average (200,50)
DayMidPointDayMidPoint - Plot the moving average of the Daily price midpoint for short periods of time (i.e. 3 day or 5 day). Great for detecting the short term daily trend direction to determine a SHORT or LONG position building in a stock. Use with DayHigh and DayLow indicators. for nice price channels on a chart.

DayHigh - Plot the Moving Average of the Daily HighPlot the Moving Average of the Daily High for short periods of time (i.e 3 day or 5 day). Great for detecting when a stocks SELL pressure is running out and time to switch to a BUY strategy. Use in the DayHIGH indicator for nice price channels on a chart.
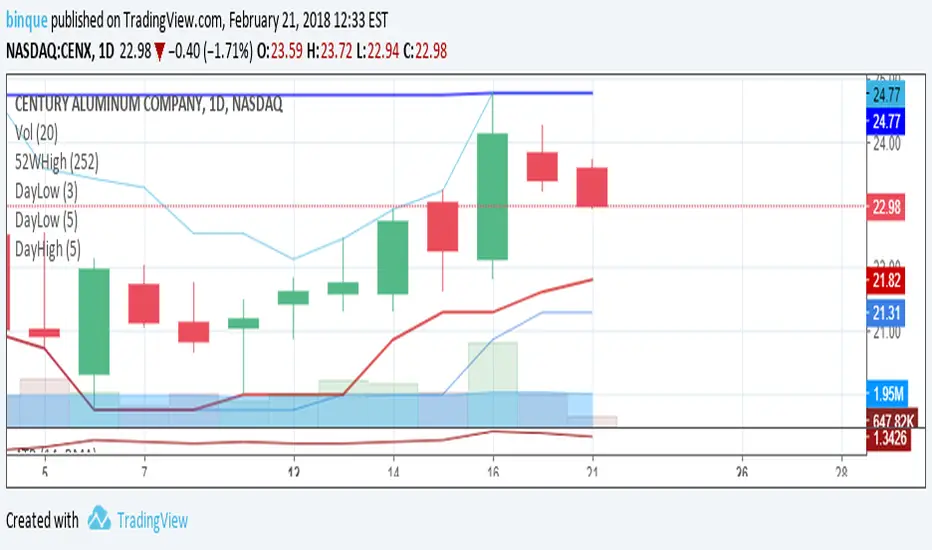
DayLow - Chart the Moving Average of the DAILY LOW PriceThis is a moving average of the Daily LOW Price over a short period of time (i.e. 3 day low moving average, etc...) Great for tracking trailing stops for a stock on an up swing.


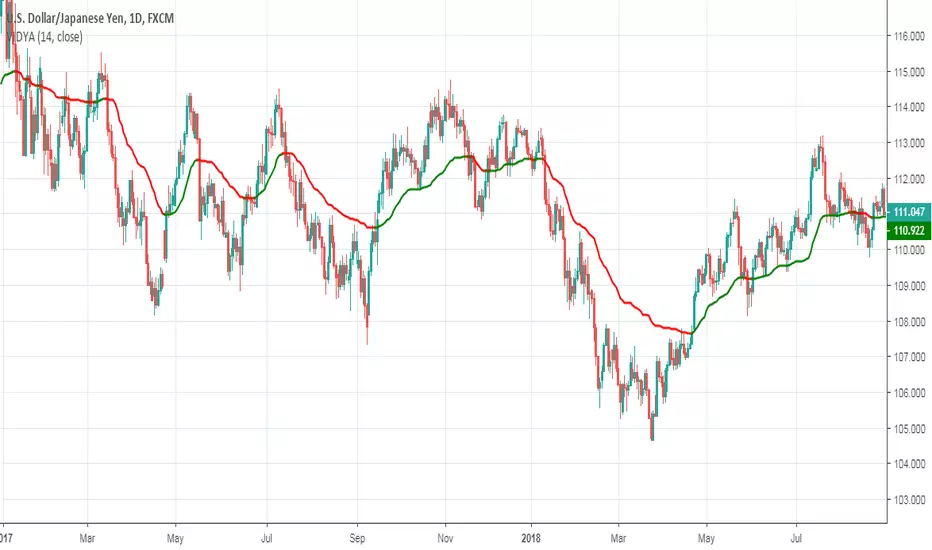
Variable Index Dynamic Average (VIDYA)Variable Index Dynamic Average indicator script based on the original version by Tushar Chande.


6 Simple Blue & 5 Exponential Yellow Moving Averages6 simple and 5 exponential Moving Averages in one indicator.
I made this because its not always easy to tell what average the price might be bouncing off from when you only have a couple at a time.
For some reason, the defaults aren't working.
To fix this, just open the configuration for the indicator after the first time that you load it.
Then check/uncheck the box and set the time period.
If anyone knows how I can fix this in the code, please let me know.
Blue indicators are simple and the Yellow are exponential.
Thinner more transparent lines are shorter term averages and Thicker lines are longer term averages.
I modeled it after the source of several other scripts which had less averages
3SMAThis script plots three Simple Moving Averages instead of just one.
Support me going through grad school!
www.linkedin.com
BTC tip jar: 1Mv1s7nLaTsRoLai5WXEGg8doisXuiPUXy
ETH tip jar: 0x6113DDD23D0D5aCad3d1f8640A8A571E9Cb86cB8
LTC tip jar: LYvyoqTSWxa22TQw3E7818xy4AfYNi6xcm
BCH tip jar: 1GC7oZ7MhLkamKCDdZFnUfV21SKWq84VdY

MACDAS by KIVANCfr3762 with Plots and AlertsMACDAS script by KIVANCfr3762, i added Plots and Alerts
original script
