移動平均線

XRP Non-Stop Strategy (TP 25% / SL 15%)XRP Non-Stop Strategy (TP 25% / SL 15%) is a continuous long-side trading system designed specifically for XRP. The strategy uses an EMA-based trend filter (EMA20/EMA50) to confirm bullish conditions before entering a long position. Each trade applies a fixed +25% Take Profit target and a −15% Stop Loss, calculated dynamically from the entry price.
When a trade closes—whether by TP or SL—the strategy automatically re-enters on the next qualifying signal, enabling uninterrupted position cycling.
Features include:
• EMA-based trend confirmation
• Dynamic TP/SL visualization on the chart
• Clear BUY and EXIT markers
• Dedicated alert conditions for automation

51 - By GoldmanMrBaNNathis script is a multi-timeframe alignment tool designed to help users visually compare the trend direction of a higher timeframe with the movement on a lower timeframe.
The indicator simply displays when both selected timeframes are moving in the same direction based on a customizable trend-detection method (such as moving average alignment).
Its purpose is to provide clarity, structure, and directional alignment for chart analysis.
Users can select:
A higher timeframe
A lower timeframe
Trend calculation method
Visual display options
The tool is made to support analysis only.
It does not execute trades, generate financial advice, or guarantee outcomes.
Always use additional independent research when making decisions.

Trend Signal MomentumOVERVIEW
Signal Trend Momentum is a hybrid strategy that combines multiple confirmations and filters to obtain better potential trading signals. Each confirmation and filter in Signal Trend Momentum aims to avoid possible false and trap signals.
HYBRID CONCEPTS
Smart Money Concept – This indicator forms market structure and Bullish & Bearish Order Block areas to make it easier to identify market trends and strong areas where price reversals often occur. Its purpose is to simplify recognizing market direction and serve as the first confirmation.
MSS + BOS (Market Structure Shift + Break of Structure) – This indicator serves as additional confirmation for the Smart Money Concept. With the presence of two types of market structure, the market trend direction becomes clearer and more convincing.
RSI Momentum Signal – This indicator becomes the third confirmation. When the Market Trend is clear and convincing, supported by the formation of Bearish and Bullish Order Blocks, the role of the Momentum Signal here becomes crucial as it provides trend momentum based on overbought and oversold areas.
Momentum Position – This indicator becomes the next confirmation based on buyer and seller VOLUME in the market. If buyer volume is higher, the momentum position will be depicted on the chart with an upward arrow, and conversely, if seller volume is higher, it will be depicted with a downward arrow.
SnR (Support and Resistance) – This final indicator is Support and Resistance, which will serve as the last and more convincing confirmation. Support and Resistance will strengthen the Order Block areas formed by the Smart Money Concept indicator. A Bullish Order Block + Support creates a higher possibility for an upward trend in the market, conversely, a Bearish Order Block + Resistance creates a higher possibility for a downward trend in the market.
The combination of these several indicators will provide a strong market direction + persistent buyer and seller areas, as well as depict momentum based on volume + RSI which serve as additional confirmations.
These additional confirmations will produce stronger signals and help avoid false and trap signals in the market.
HOW TO USE
A SHORT SIGNAL will be strong if there is a Downtrend Market Structure + Bearish Order Block + Resistance + Oversold RSI Momentum + Strong Seller Volume Momentum.
A LONG SIGNAL will be strong if there is an Uptrend Market Structure + Bullish Order Block + Support + Overbought RSI Momentum + Strong Buyer Volume Momentum.
CONCLUSION
Signal Trend Momentum is a combination of several powerful indicators designed to produce stronger, clearer, and easier-to-read signals.
This strategy is highly suitable for traders seeking more convincing trade signals based on multiple confirmations from the combined indicators, thereby creating a strong signal with a higher probability.

JYL Trend Pro V1.0 BETAJYL Trend Pro V1.0 is a rule‑based trend‑following strategy built on a proprietary smoothed price engine.
It focuses on clear trend states and position management rather than classic indicators, and can be used on both long and short side depending on the user’s settings.
Three Signal Modes
1. Stable Mode
Stable mode is the “classic” version of the system.
It reacts only when the trend state clearly flips, and then manages the position with simple rules:
First strong bullish state → open / add to long
First strong bearish state → open / add to short
When the trend weakens but does not fully reverse, the strategy can reduce position size (partial exit)
When the trend flips in the opposite direction, the strategy fully exits the existing position
This mode is designed for traders who prefer fewer signals and smoother equity curves.
2. Impulsive Mode
Impulsive mode keeps the same core logic, but allows the strategy to react earlier and manage exits more actively:
Opportunistic early entries around strong moves
Protective “early stop” logic for those aggressive entries
Segment‑based partial exits after extended bullish or bearish runs
Fast full exits when momentum fades quickly or the trend flips
This mode is aimed at users who accept more trade frequency in exchange for faster reactions.
3. IMP+ Mode (Impulsive Plus)
IMP+ is the advanced version of Impulsive mode. It keeps all core behavior and adds extra controls for power‑users:
Adjustable presets for how early the system can enter a move
Adjustable presets for how quickly early entries are cut if they fail
Smarter add‑ons after a bullish / bearish segment, so adds can occur either at the next strong signal or on a “pullback‑type” bar inside the ongoing trend
Flexible multi‑level partial‑exit packages after a strong run
Additional “emergency exit” logic that can flatten positions when price opens too close to the previous bar after a strong trend segment
All of these options are exposed as presets in the Inputs tab, so users can experiment without touching code.
Signals & Usage
The strategy prints clear labels on the chart:
LONG / SHORT – open or add to position
REDUCE SIZE – partial profit‑taking or risk reduction
SELL LONG / SHORT COVER – full exit of long / short positions
A trade‑direction filter lets you run the system as long‑only, short‑only, or long & short.
This script is provided for educational and research purposes only.
It is not financial advice and does not guarantee any future performance. Always test on a demo account, adjust risk to your own situation, and consult your broker or advisor before trading live.
Internally, this strategy is based on the private JYL Trend Pro rule set and risk‑management framework.
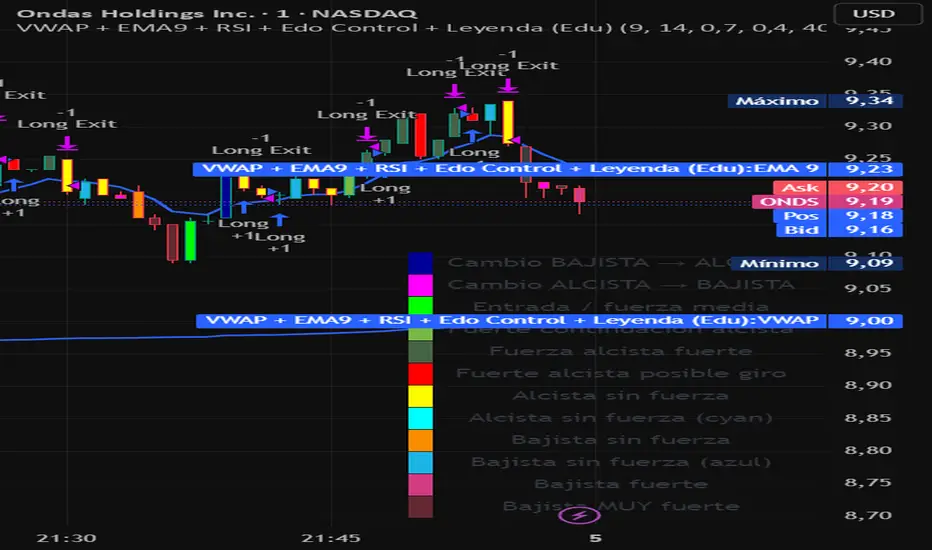
VWAP + EMA9 + RSI + Edo Control (Edu)VWAP + EMA9 + RSI + Edo Control (Edu)
A complete intraday scalping system that combines institutional levels, fast trend signaling and enhanced candle-color analysis for maximum clarity and confirmation.
This indicator includes:
1. VWAP (Volume Weighted Average Price)
The institutional reference line used to determine value zones, liquidity bias and directional pressure.
2. EMA9 (Fast Exponential Moving Average)
A micro-trend guide that reacts quickly to short-term movements and improves timing on pullback entries.
3. RSI (Relative Strength Index)
A clean momentum filter using the classic >50 (bullish) and <50 (bearish) bias.
Edo Control – Advanced Colored Candle System
This version integrates Edo Control, a custom candle-color engine that visualizes market strength shifts based on Williams %R, directional movement and ADX behavior.
Each candle color represents a different market condition, such as:
Trend acceleration
Trend weakening
Possible reversals
Momentum spikes
Bullish or bearish pressure
Transition zones
A built-in movable legend explains the meaning of each color directly on the chart, so traders can identify conditions instantly without guessing.
Why this indicator works
The combination of VWAP + EMA9 + RSI + colored candle strength creates a multi-layer confirmation system that cuts noise and highlights only meaningful setups.
Designed for 1m, 3m, 5m charts, but also effective on higher timeframes.
Suitable for: stocks, indices, futures, forex, crypto.
NYAM Trend PullbackThis is an trend-following strategy designed for trades taken during New York Morning. It aims to capture trend continuations by entering positions when price aligns with the dominant trend relative to a Exponential Moving Average (EMA).
If price is above the EMA then it is bullish and enters long, and if its below the EMA it is bearish and enters a short.

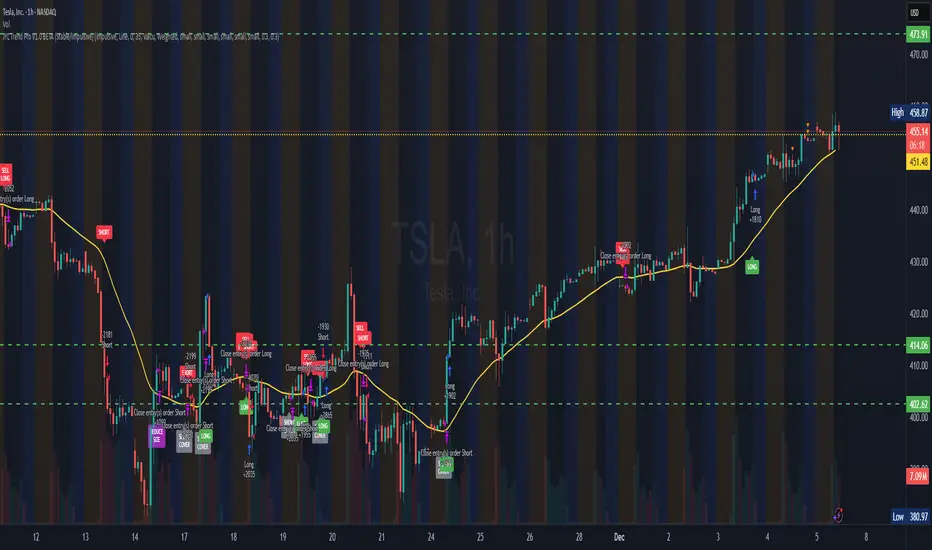
JYL Trend Pro V1.0 BETANASDAQ:TSLA
JYL Trend Pro V1.0 is a rule‑based trend‑following strategy built on a proprietary smoothed price engine.
It focuses on clear trend states and position management rather than classic indicators, and can be used on both long and short side depending on the user’s settings.
Three Signal Modes
1. Stable Mode
Stable mode is the “classic” version of the system.
It reacts only when the trend state clearly flips, and then manages the position with simple rules:
First strong bullish state → open / add to long
First strong bearish state → open / add to short
When the trend weakens but does not fully reverse, the strategy can reduce position size (partial exit)
When the trend flips in the opposite direction, the strategy fully exits the existing position
This mode is designed for traders who prefer fewer signals and smoother equity curves.
2. Impulsive Mode
Impulsive mode keeps the same core logic, but allows the strategy to react earlier and manage exits more actively:
Opportunistic early entries around strong moves
Protective “early stop” logic for those aggressive entries
Segment‑based partial exits after extended bullish or bearish runs
Fast full exits when momentum fades quickly or the trend flips
This mode is aimed at users who accept more trade frequency in exchange for faster reactions.
3. IMP+ Mode (Impulsive Plus)
IMP+ is the advanced version of Impulsive mode. It keeps all core behavior and adds extra controls for power‑users:
Adjustable presets for how early the system can enter a move
Adjustable presets for how quickly early entries are cut if they fail
Smarter add‑ons after a bullish / bearish segment, so adds can occur either at the next strong signal or on a “pullback‑type” bar inside the ongoing trend
Flexible multi‑level partial‑exit packages after a strong run
Additional “emergency exit” logic that can flatten positions when price opens too close to the previous bar after a strong trend segment
All of these options are exposed as presets in the Inputs tab, so users can experiment without touching code.
Signals & Usage
The strategy prints clear labels on the chart:
LONG / SHORT – open or add to position
REDUCE SIZE – partial profit‑taking or risk reduction
SELL LONG / SHORT COVER – full exit of long / short positions
A trade‑direction filter lets you run the system as long‑only, short‑only, or long & short.
This script is provided for educational and research purposes only.
It is not financial advice and does not guarantee any future performance. Always test on a demo account, adjust risk to your own situation, and consult your broker or advisor before trading live.
Internally, this strategy is based on the private JYL Trend Pro rule set and risk‑management framework.

PSAR with EMA FilterThis indicator combines the Parabolic SAR (PSAR) with an EMA trend filter to generate more accurate trend-following signals.
PSAR helps identify potential trend reversals and trailing stop levels, while the EMA ensures that trades are aligned with the overall market direction.

RSI with EMA FilterThis indicator combines the Relative Strength Index (RSI) with a trend-filtering Exponential Moving Average (EMA) to generate higher-quality momentum signals.
RSI identifies overbought and oversold market conditions, while the EMA confirms the overall trend direction, helping traders avoid false signals in choppy markets.

BTC Trend-Following Strategy (Limited Version)This is a trend-following strategy designed specifically for Bitcoin (BTC).
It has demonstrated consistent performance and profitable opportunities over multiple years of historical data.
The strategy aims to capture major trends while managing risk effectively, making it suitable for traders looking for a systematic BTC trading approach.

Pro Bollinger Bands Strategy [Breno]This strategy excels in highly volatile financial instruments, including cryptocurrencies, high-beta stocks, commodity futures, and certain exchange-traded funds (ETFs) that exhibit clear mean-reversion characteristics around their Bollinger Bands. The system's ability to utilize scaling (position averaging) and an ATR-based stop loss makes it particularly effective in markets with significant price swings, allowing the trader to capture profits from price extremes while managing increased volatility-related risk.
Core Strategy Logic
This Strategy implements a comprehensive trend-following and mean-reversion strategy primarily leveraging the Bollinger Bands (BB) indicator for entry and exit signals, complemented by an Average True Range (ATR)-based Stop Loss mechanism and an optional EMA filter. It is designed with robust features for capital management, including configurable leverage and a sophisticated position averaging (scaling) system.
Long Entry: A long position is initiated when the closing price crosses over the Lower Bollinger Band (ta.crossover(close,lowerBB)). This signals a potential mean-reversion opportunity following a price dip.
Short Entry: A short position is initiated when the closing price crosses under the Upper Bollinger Band (ta.crossunder(close,upperBB)). (Note: Short entries are disabled by default in the script inputs).
Exit Conditions (Profit Target): Long positions aim to exit upon interaction with the Upper Bollinger Band. Users can select from three exit methods:
"Close When Touch": Exits when close≥upperBB.
"Close Above then Below": Exits when the previous close was above the upper band, and the current close is below it (a reversal signal).
"High Above": Exits when high>upperBB. The strategy features an optional profitOnly setting, which restricts all exits to only occur if the trade is currently in profit (i.e., close is above the strategy.position_avg_price for longs).
Key Features and Customization
Bollinger Bands & Filters -
Customizable BB Parameters: The Length and Deviation of the Bollinger Bands are fully adjustable, allowing users to fine-tune the sensitivity of the entry and exit signals.
Optional EMA Filter: An optional EMA Filter can be enabled to align entries with the prevailing trend, where a Long entry is only permitted if close≥EMA(EmaFilterRange).
Risk and Capital Management -
Equity Allocation: Position size is dynamically calculated based on a Percentage of Equity (capitalPerc) combined with the set Leverage multiplier.
Dynamic Stop Loss (ATR-Based):
An optional Stop Loss (SL) is calculated using a multiple (slAtrInput) of the Average True Range (ATR).
The SL is set relative to the entry price upon trade activation, providing a volatility-adjusted risk management layer.
Position Averaging (Scaling): The script supports the addition of multiple units (pyramiding) to an existing position based on three user-selected criteria:
"No": No averaging.
"Percent": Adds to the position if the price has dropped by a set percentage (addPct) from the average price.
"ATR": Adds to the position if the current price is significantly below a calculated ATR-based support level from the average price.

XRP Non-Stop Strategy (TP 25% / SL 15%)This strategy performs continuous automated trading exclusively on XRP. It opens long positions during favorable trend conditions, using a fixed Take Profit target of 25% above the entry price and a fixed Stop Loss of 15% below the entry. Once a trade is closed (either TP or SL), the strategy automatically re-enters on the next valid signal, enabling uninterrupted trading.
The script includes:
Dynamic Take Profit & Stop Loss lines
Optional EMA trend filter
Visual BUY and EXIT markers
TradingView alerts for automation or notifications
This strategy is built for traders who want a simple, price-action-driven system without fixed price levels, relying only on percentage-based movement from each entry.

BTCUSD 15m Balanced Pullback v1This strategy is designed specifically for BTC futures on the 15-minute timeframe, focusing on catching high-quality pullback entries within strong trend conditions while avoiding the worst periods of low-volatility chop.

RS Rating Trailing StrategyHow It Works:
StageActionEntryBuy when RS Rating crosses above 80TrackingTrack the highest RS Rating while in positionExitSell when RS Rating drops 5 points below the high
Example:
RS Rating crosses from 79 to 81 → BUY
RS Rating climbs to 85 → High RS = 85, Stop = 80
RS Rating climbs to 95 → High RS = 95, Stop = 90
RS Rating drops to 92 → Still holding (above 90 stop)
RS Rating drops to 90 → SELL (hit trailing stop)
Settings:
SettingDefaultDescriptionRS Entry Level80Buy when RS crosses above thisRS Trailing Drop5.0Sell when RS drops this many points from highBenchmark IndexSP:SPXIndex for RS calculation
Table Shows:
Current RS Rating
Position status (LONG/FLAT)
Entry RS (what RS was when you bought)
High RS (highest RS since entry)
Stop RS (current trailing stop level)
Cushion (how far above stop you are)
The cushion turns orange when close to stop, red when very close.

Long Only EMA Strategy (9/20 with 200 EMA Filter)Details:
This strategy is built around a very simple idea: follow the primary trend and enter only when momentum supports it.
It uses three EMAs on a standard candlestick chart:
1. 9‑period EMA – short‑term momentum
2. 20‑period EMA – medium‑term structure
3. 200‑period EMA – long‑term trend filter
The strategy is ** long‑only ** and is mainly designed for swing trading and positional trading.
It avoids counter‑trend trades by taking entries only when price is trading ** above the 200 EMA **, which is commonly used as a long‑term trend reference.
The rules are deliberately kept simple so that they are easy to understand, modify, and test on different markets and timeframes.
---
Key Features
1. **Trend‑Filtered Entries**
- Fresh long positions are considered only when:
- The 9 EMA crosses above the 20 EMA
- The closing price is **above** the 200 EMA
- This attempts to combine short‑term momentum with a higher‑timeframe trend filter.
2. **Clean Exit Logic**
- The long position is exited when the closing price crosses **below** the 20 EMA.
- This creates an objective, rule‑based way to trail the trade as long as the medium‑term structure remains intact.
3. **Long‑Only, No Short Selling**
- The script intentionally ignores short setups.
- This makes it suitable for markets or accounts where short selling is restricted, or for traders who prefer to participate only on the long side of the market.
4. **Simple Visuals**
- All three EMAs are plotted directly on the chart:
- 9 EMA (fast)
- 20 EMA (medium)
- 200 EMA (trend)
- Trade entries and exits are handled by TradingView’s strategy engine, so users can see results in the Strategy Tester as well as directly on the chart.
5. **Backtest‑Friendly Structure**
- Uses TradingView’s built‑in `strategy()` framework.
- Can be applied to different symbols, timeframes, and markets (equities, indices, crypto, etc.).
- Works on standard candlestick charts, which are supported by TradingView’s backtesting engine.
6. **Configurable in Code**
- The EMA periods are defined in the code and can be easily adjusted.
- Users can tailor the parameters to fit their own style (for example, faster EMAs for intraday trading, slower EMAs for positional trades).
---
How to Use
1. **Add the Strategy to Your Chart**
1. Open any symbol and select a **standard candlestick chart**.
2. Apply the strategy from your “My Scripts” section.
3. Make sure it is enabled so that the trades and results appear.
2. **Select Timeframe**
- The logic can be tested on various timeframes:
- Higher timeframes (1H, 4H, 1D) for swing and positional setups.
- Lower timeframes (5m, 15m) for more active trading, if desired.
- Users should experiment and see where the strategy behaves more consistently for their chosen market.
3. **Read the Signals**
- **Entry:**
- A long trade is opened when the 9 EMA crosses above the 20 EMA while the closing price is above the 200 EMA.
- **Exit:**
- The open long position is closed when the closing price crosses below the 20 EMA.
- All orders are generated automatically once the strategy is attached to the chart.
4. **Use the Strategy Tester**
- Go to the **Strategy Tester** tab in TradingView.
- Check:
- Net profit / drawdown
- Win rate and average trade
- List of trades and the equity curve
- Change the date range and timeframe to see how stable the results are over different periods.
5. **Adjust Parameters if Needed**
- Advanced users can open the code and experiment with:
- EMA lengths (for example 8/21 with 200, or 10/30 with 200)
- Risk sizing and capital settings within the `strategy()` call
- Any changes should be thoroughly re‑tested before considering real‑world application.
---
Practical Applications
1. **Swing Trading on Daily Charts**
- Can be applied to stocks, indices, or ETFs on the daily timeframe.
- The 200 EMA acts as a trend filter to stay aligned with the broad direction, while the 9/20 crossover helps catch medium‑term swings inside that trend.
2. **Positional Trades on Higher Timeframes**
- On 4H or 1D charts, this approach can help in holding trades for several days to weeks.
- The exit rule based on the 20 EMA crossing helps avoid emotional decisions and provides a rules‑based way to trail the trend.
3. **Trend‑Following Filter**
- Even if used purely as a filter, the 200 EMA condition can help traders:
- Avoid taking long trades when the market is in a clear downtrend.
- Focus only on instruments that are trading above their long‑term average.
4. **Educational Use**
- The script is intentionally kept straightforward so that newer users can:
- Learn how a moving average crossover strategy works.
- See how to combine a short‑term signal with a long‑term filter.
- Understand how TradingView’s strategy engine handles entries and exits.
5. **Basis for Further Development**
- This can serve as a starting point for more advanced systems.
- Traders can extend it by adding:
- Additional filters (RSI, volume, volatility filters, time‑of‑day filters, etc.)
- Risk management rules (fixed stop loss, take profit, trailing stops).
- The current version is kept minimal on purpose, so modifications are easy to implement and test.
---
Important Notes & Disclaimer
1. This strategy is provided **for testing, research, and educational purposes only**.
2. It is ** not ** a recommendation to buy or sell any financial instrument.
3. Past performance on historical data does not guarantee similar results in live markets.
4. Markets are risky and trading can lead to financial loss; users should always do their own research, manage risk appropriately, and consult a qualified financial professional if needed.
5. Before using any strategy with real capital, it is strongly advised to:
- Forward test it on a demo / paper trading account.
- Check how it behaves during different market phases (trending, sideways, high‑volatility conditions).
You are free to modify the parameters and logic to better align it with your own trading style and risk tolerance.

Strategy: HMA 50 + Supertrend SniperHMA 50 + Supertrend Confluence Strategy (Trend Following with Noise Filtering)
Description:
Introduction and Concept This strategy is designed to solve a common problem in trend-following trading: Lag vs. False Signals. Standard Moving Averages often lag too much, while price action indicators can generate false signals during choppy markets. This script combines the speed of the Hull Moving Average (HMA) with the volatility-based filtering of the Supertrend indicator to create a robust "Confluence System."
The primary goal of this script is not just to overlay two indicators, but to enforce a strict rule where a trade is only taken when Momentum (HMA) and Volatility Direction (Supertrend) are in perfect agreement.
Why this combination? (The Logic Behind the Mashup)
Hull Moving Average (HMA 50): We use the HMA because it significantly reduces lag compared to SMA or EMA by using weighted calculations. It acts as our primary Trend Direction detector. However, HMA can be too sensitive and "whipsaw" during sideways markets.
Supertrend (ATR-based): We use the Supertrend (Factor 3.0, Period 10) as our Volatility Filter. It uses Average True Range (ATR) to determine the significant trend boundary.
How it Works (Methodology) The strategy uses a boolean logic system to filter out low-quality trades:
Bullish Confluence: The HMA must be rising (Slope > 0) AND the Close Price must be above the Supertrend line (Uptrend).
Bearish Confluence: The HMA must be falling (Slope < 0) AND the Close Price must be below the Supertrend line (Downtrend).
The "Choppy Zone" (Noise Filter): This is a unique feature of this script. If the HMA indicates one direction (e.g., Rising) but the Supertrend indicates the opposite (e.g., Downtrend), the market is considered "Choppy" or indecisive. In this state, the script paints the candles or HMA line Gray and exits all positions (optional setting) to preserve capital.
Visual Guide & Signals To make the script easy to interpret for traders who do not read Pine Script, I have implemented specific visual cues:
Green Cross (+): Indicates a LONG entry signal. Both HMA and Supertrend align bullishly.
Red Cross (X): Indicates a SHORT entry signal. Both HMA and Supertrend align bearishly.
Thick Line (HMA): The main line changes color based on the trend.
Green: Bullish Confluence.
Red: Bearish Confluence.
Gray: Divergence/Choppy (No Trade Zone).
Thin Step Line: This is the Supertrend line, serving as your dynamic Trailing Stop Loss.
Strategy Settings
HMA Length: Default is 50 (Mid-term trend).
ATR Factor/Period: Default is 3.0/10 (Standard for trend catching).
Exit on Choppy: A toggle switch allowing users to decide whether to hold through noise or exit immediately when indicators disagree.
Risk Warning This strategy performs best in trending markets (Forex, Crypto, Indices). Like all trend-following systems, it may experience drawdown during prolonged accumulation/distribution phases. Please backtest with your specific asset before using it with real capital.


Trend Flow & Volatility Guard Strategy [ROSTOK V5]Description:
This strategy is a comprehensive trend-following system designed to identify high-probability entries by aligning long-term market direction with short-term momentum, while strictly filtering out low-quality "choppy" market conditions.
How it Works:
The strategy operates on a multi-stage logic system:
Trend Identification: The core direction is determined by a customizable Main Trend Line (selectable between a long-period EMA or Supertrend). Trades are only taken in the direction of the dominant trend.
Signal Generation: Entries are triggered when a fast-moving Signal Line crosses the Main Trend Line, confirmed by specific candlestick price action (Close > Open).
Advanced Filtering (Confluence): To avoid false signals, the strategy employs a robust set of filters. A trade is only valid if:
Momentum: RSI is within safe operating zones (avoiding extreme overbought/oversold unless a strong trend override is active).
Cycle: CCI and MACD histograms align with the trade direction.
Volatility: The ADX is analyzed to ensure sufficient trend strength, while a Choppiness Index filter blocks trades during sideways/ranging markets.
Risk Management & Recovery: The strategy features built-in money management tools, including:
ADR (Average Daily Range) Filter: Prevents entering trades when the asset has already moved its expected daily distance.
Daily Limits: Hard stops for Max Daily Loss and Target Daily Profit to preserve capital.
Recovery Logic: An optional mechanism to manage drawdowns on difficult days using calculated recovery targets.
Settings & Customization: Users can toggle individual filters (Volume, Choppiness, ADX) and adjust the sensitivity of the trend lines to fit different assets and timeframes (e.g., EURAUD 15m).
Disclaimer: Past performance is not indicative of future results. This script is for educational purposes and backtesting analysis.

Logic Flow Signals & Backtest [bercutiatia]To understand the advanced logic of the tool, it is essential that you carefully read each topic and check the visual examples in this presentation.
--
Who is the Logic Flow Signals & Backtest tool recommended for?
Ideal for traders looking to increase the reliability and level of their operations. Recommended for those who want to create rigorous confluences, validate strategies with backtesting, and transform emotional management into systematic and measurable processes.
How can the Logic Flow Signals & Backtest tool help me?
High-confidence signals! You combine TradingView indicators and create a single robust signal, eliminating the frustration of having to spend hours in front of the chart and still clicking at the wrong time. This ensures that your entry is validated by logic, not emotional impulse.
--
Logic Flow Signals & Backtest is a versatile and powerful tool designed to test and validate your trading ideas with indicators from the TradingView community.
Extreme flexibility: Allows you to combine indicators available on TradingView (EMAs, RSI, MACD, SMC, etc.) to create custom entry and exit logics.
Sequential Logic: Goes far beyond simple crossovers. You can define rules where signal A must occur before signal B — and, if desired, before signal C or D — to validate an entry. Add time, order, and context filters, creating truly intelligent sequential logic that generates a single final alert only when all conditions align.
With Stages (Stage 1, Stage 2, etc.), your entries follow the exact sequence you define. And the best part: you no longer need to spend hours in front of the chart waiting for confluences. Simply set up your stages once, create an alert in TradingView, and the system will automatically notify you when the ideal combination of signals occurs.
Sequence Invalidation: Offers the option to define conditions that, if they occur, immediately cancel an ongoing entry sequence, helping to avoid entries in unfavorable scenarios.
Explaining the first image example (chart below):
LONG INDICATOR 1 (Stage 1): The market confirms a change in character (CHoCH Bullish). The system enters an alert state awaiting the confluence of the next indicators.
LONG INDICATOR 2 and 3 (Stage 2): Entry is only released when the SMA17 crosses above the SMA72 (indicator 2), but with one condition: The SMA72 must be ABOVE the SMA305 (indicator 3); Without this alignment of indicator 3, the signal of indicator 2 does not occur.
LONG INDICATOR 4 (Invalidation Rule): If at any point in the sequence the SMA72 crosses below the SMA305, the setup is immediately canceled and no entry signal is generated. The sequence restarts with indicator 1.
EXIT LONG (Hybrid Exit TP + SIGNAL): The trade seeks a TP target of 1000 ticks, but has a technical "Trailing Stop": if the trend reverses (Exit Long Indicator 1 = SMA72 crosses below the SMA305) before the target, the position is closed to protect capital.
SHORT INDICATOR 1 (Stage 1): Identification of weakness in the market with a Bearish CHoCH.
SHORT INDICATOR 2 and 3 (Stage 2): Entry is only released when the SMA17 crosses below the SMA72 (indicator 2), but with a strict condition: The SMA72 must be BELOW the SMA305 (indicator 3); Without this STATE of indicator 3, the signal from indicator 2 does not occur.
SHORT INDICATOR 4 (Invalidation Rule): If at any point in the sequence the SMA72 crosses above the SMA305, the setup is immediately canceled and no entry signal is generated. The sequence starts again with indicator 1.
EXIT SHORT (Hybrid Exit TP + SIGNAL): The trade seeks a target of 1000 ticks, but has a technical "Trailing Stop": if the downtrend reverses (Exit Short Indicator 1 = SMA72 crosses above the SMA305) before the target, the position is closed to protect capital.
In this strategy, we use the external indicators: Multiple MTF MA and Smart Money Concepts (Advanced)
--
Stage Duration: In STAGE DURATION , you control the maximum time (in candles) allowed for each transition between stages to occur. If the time limit expires before the next stage is reached, the sequence is reset. Keep it at 0 to disable the time limit.
The "Stage Duration" function is available in four separate blocks on the settings panel:
- LONG - STAGE DURATION: Controls the time limit (in candles) between Long entry stages (for example from Stage 1 to Stage 2).
- LONG EXIT - STAGE DURATION: Controls the time limit between Long exit stages.
- SHORT - STAGE DURATION: Controls the time limit between Short entry stages.
- SHORT EXIT - STAGE DURATION: Controls the time limit between Short exit stages.
Explaining the second image example (chart below):
Stage 1 (INDICATOR 1): New Fair Value Gap (FVG) Bullish Confirmed.
- Meaning: The move starts with a bullish FVG (Fair Value Gap), indicating a confirmed imbalance where buyers were much more aggressive than sellers.
Stage 2 (INDICATOR 2): EMA10 crossing above the EMA50.
- Meaning: Immediately after the FVG trigger, the fast moving average (10 periods) crosses the intermediate moving average (50 periods). This confirms that the initial FVG impulse was not an isolated event but the beginning of a short-term trend.
Stage 3: In this final stage, we require two simultaneous confirmations to validate the entry:
- INDICATOR 3: The EMA10 crosses above the EMA100, indicating that the movement has enough strength to break through larger barriers.
- INDICATOR 4: The RSI must be above its own moving average (SMA14). This ensures the asset is gaining momentum at the exact moment the averages are broken, avoiding entries in "tired" markets.
Stage Duration: The most important feature of this setup is the restricted time window.
- Rule: From Stage 1 to 2, and from Stage 2 to 3, the maximum interval to accept confluences is only 3 candles.
- Why this is vital? If the market took 20 candles to align these conditions, it would indicate weakness or indecision. By demanding that everything happens within a maximum of 3 candles per step, the setup filters only the moves where buying pressure is urgent and aggressive, increasing the probability of an explosive move in favor of the trade.
Asymmetric Risk Management: To complement a high-probability and high-pressure setup, we use aggressive risk management:
- Stop Loss (Technical/Short): 200 Ticks. If the buying pressure fails quickly, we exit early with a small loss.
- Take Profit (Long Target): 1000 Ticks. We aim to ride the impulse "leg" that the setup identified.
- Risk/Reward: 5:1. This means a single winning trade covers five losing trades, making the strategy mathematically viable in the long term.
In this strategy, we use the external indicators: Multiple MTF MA , Smart Money Concepts (Advanced) and Relative Strength Index (RSI) .
--
Multiple Operating Modes
It is not limited to sequences. It can operate by confluence (where all signals must be valid at the same time), by single trigger (only one signal is required), or by "OR" logic (any one of the defined signals).
- If you use only Stage 1 in more than one indicator session, the entry will only occur if all enabled conditions are true simultaneously.
- Any condition defined as OR can trigger the entry by itself.
- If only one condition block is enabled, the single indicator will function as a simple signal.
Multiple and Simultaneous Exits
It allows for the configuration of exits by both indicators and TP/SL targets. The strategy will close the trade as soon as any of these conditions are met first (indicator signal, profit target, or loss limit
Integrated Risk Management
It includes Stop Loss and Take Profit exits by percentage and ticks, which are easy to configure and essential for risk management. The strategy calculates the exact TP and SL prices based on your entry price and monitors the market on every tick.
Explaining the Third Image Example (Chart Below)
The move was validated by a 4-step logical sequence (Stage 1) and managed by a hybrid exit system.
Short Indicator 1, 2, and 3: The price (Close) crossed below the SMA200, SMA72, and SMA17 averages simultaneously.
- What this means: When a single candle has the strength to break below the short-term (17), mid-term (72), and long-term (200) averages, it indicates a high probability for the price to seek lower levels.
To reinforce Indicators 1 through 3, we added an extra layer of confirmation.
Short Indicator 4: The Positive Volume Index (PVI) needed to be below its own long-term average (EMA300).
- Why this is important: PVI below the average confirms that selling volume is dominant, validating that the break of the averages was not just noise.
Triple Exit Management (Maximum Security)
The great advantage of this tool is the ability to manage risk dynamically. In this trade, we configured three simultaneous exit conditions, where the first one to be met closes the position:
1. Financial Target (TP): A fixed Take Profit of 15%.
2. Exit Short Indicator 1 (Technical Exit 1): If the average (SMA72) crosses above the average (SMA200), the trade is closed.
3. Exit Short Indicator 2 (Technical Exit 2): If the PVI crosses above the EMA300, indicating an entry of buying strength, the trade is closed.
"OR" Logic: The tool monitors these conditions in real-time. Whichever occurs first triggers the exit, ensuring you lock in profit (TP) or protect your capital at the first sign from the indicators.
In this strategy, we use the external indicators: Multiple MTF MA and Positive Volume Index .
--
Reversal Mode (Stop and Reverse)
The Reversal Mode (Stop and Reverse) allows a new signal in the opposite direction (e.g., a SELL signal) to automatically close an existing position (e.g., BUY) and open a new one (sell). This "stop and reverse" function can be enabled or disabled in the settings, giving you full control over whether the strategy should only exit (awaiting a new signal) or immediately reverse the position.
Explaining the Fourth Image Example (Chart Below)
In this example, we demonstrate a setup focused on capturing every market "flip," keeping the trader positioned 100% of the time ("Always-in"), a technique widely used in automation.
- Long Entry: Occurs immediately upon confirming a bullish change of character (New CHoCH Bullish).
- Short Entry: Occurs immediately upon confirming a bearish change of character (New CHoCH Bearish).
- Exit (The Differentiator): We are not using fixed TP or SL here. The exit is triggered by Automatic Reversal.
The Power of "Exit by Opposite Signal"
Notice the labels on the chart: "Close Short" followed immediately by a "Long." This happens because the Allow Reversal function is enabled in the tool's settings.
When the market generates a buy signal, the tool understands that the sell thesis has been invalidated. It simultaneously sends an order to close the Short position and open a new Long position.
When to use this exit rule?
- Capturing Long Trends / Directional Movements: Ideal for volatile assets where you want to ride the trend until the market structure effectively changes.
- Operational Simplification: Eliminates the need to guess profit targets and acts as a loss limiter when the price moves against your position. The market dictates when to enter and when to exit.
Hybrid Flexibility:
The strongest point of Logic Flow is that you don't have to choose just one method. Reversal can be used in two ways:
1. Individually (as in the image): Reversal is the only form of exit. You stay in the move until the opposite signal.
2. Combined (Hybrid): You can enable Reversal and configure a safety Stop Loss + technical Take Profit (Exit Long/Short Indicator).
- Example: If the price hits your TP/SL first, you exit. If the market turns before the TP, the Reversal takes you out of the trade and generates a new trend alert.
In this strategy, we use the external indicators: Smart Money Concepts .
--
Backtesting: Far beyond creating logic and generating signals, Logic Flow Signals stands out due to its Integrated Backtest.
Backtesting serves as a reality check for the trader. It takes the strategy out of the realm of "imagination" and puts it to the test against historical data.
Here are the 4 main practical uses:
1. Verifying Feasibility (Proof of Concept): The most obvious use is to answer: "Does this idea make money?". Many strategies look visually perfect on the chart, but when you run the backtest, you discover that brokerage fees or frequent "stops" consume all the profit.
2. Knowing the "Worst-Case Scenario" (Drawdown): Maximum Drawdown: It shows you what the largest accumulated drop the strategy has ever experienced was. By identifying a Drawdown that exceeds the desired risk tolerance, the backtest allows for parameter optimization in search of a more efficient balance between risk and return.
3. Fine-Tuning (Optimization): It allows you to make changes such as: Increasing the profit target, changing the stop, removing an indicator, changing the chart timeframe, among other actions. You can test various variations instantly to find the most efficient configuration.
4. Expectation Management and Discipline: Backtesting does not eliminate fear nor guarantee that the future will repeat the past, but it serves as a reference map.
The Real Role: Aligning expectation with reality.
In the image below, you can check out how a backtest result is generated:
To understand the backtest results shown above, check the chart and the detailed operational logic below:
This operational example seeks to identify altcoins that are demonstrating an explosive decorrelation relative to Bitcoin. The logic is: we want to buy only the assets that are outperforming the market leader, precisely at the moment when speculative money (Open Interest) heavily enters the market.
For the buy signal (Long) to be triggered, three conditions must be simultaneously true (Stage 1):
Long Indicator 1 (Altcoin Strength): The asset's RSI must be above the 70 level (Overbought), indicating extremely strong bullish momentum.
Long Indicator 2 (Bitcoin Weakness): Bitcoin's RSI must be below the 50 level. This confirms that the Altcoin's rally is genuine and independent.
Long Indicator 3 (Money Flow): The Open Interest (open contracts) must be above the Extreme level of the OI DELTA indicator. This validates that new money is aggressively entering the asset to sustain the rally.
Risk Management: In this example, we configured an aggressive target to capture the altcoin volatility:
- Take Profit: 100%
- Stop Loss: 20%
- Risk/Reward: 5:1
In this strategy, we use the external indicators: RSI Crypto Strength (Asset vs BTC) and Open Interest Delta .
--
Configuring an Indicator Block
Each block (BUY INDICATOR 1, BUY INDICATOR 2, ...) allows you to define a complete condition.
- Enable (Activate): Simply turns this indicator block on or off.
- Source A: The first value you want to analyze.
example: The Closing Price (Close), Opening Price (Open), or another TradingView indicator.
- Condition: How 'Source A' will be compared.
example: Crossover/Crossunder, Greater Than, Less Than, Cross Up.
- Comparison Type: The option that defines whether you will compare 'Source A' with a fixed number or with another indicator.
- Fixed Value: Used if you selected "Fixed Value".
example: For an RSI greater than 70 condition, Source A would be the RSI, the Condition would be Greater Than, and the Fixed Value would be 70.
- Source B: Used if you selected "Source B".
example: For a condition where the EMA10 crosses above the EMA200, Source A would be the EMA10, the Condition would be 'Cross Up', and Source B would be the EMA200.
--
Configurable Alert Signals
Configurable Alert Signals: The tool allows for the creation of fully customized alerts for different types of events, such as entries, signal-based exits, take profit, and stop loss. These alerts can be used for both strategy automation and manual, real-time notifications.
The message field is highly flexible: it accepts dynamic placeholders, JSON structure, UUID identifiers, or any custom text, allowing integration with other external tools and systems via webhook.
Configuring Your Messages:
- LONG/SHORT - ALERTS: Defines the message for new entries.
- LONG/SHORT INDICATOR EXIT - ALERTS: Defines the message for signal-based exits (e.g., moving average cross).
- REVERSAL - ALERTS: Defines the message for when a position is closed by an opposite signal (stop-and-reverse).
- LONG/SHORT TP/SL EXIT - ALERTS: Defines the message for exits triggered by take profit (TP) or stop loss (SL), via percentage or ticks.
A Single Alert to Control Everything
You don't need to create separate alerts for "Buy," "Sell," or "Exits." On a single screen, you can create strategies by defining entries, signal-based exits, profit targets, or stop limits.
Alert Times (Operating Window)
In the Alert Times section, you can define a specific time (and time zone) for the strategy to generate entry or exit signals.
--
To create your alert, simply follow these steps:
- Condition: Select the script name: "Logic Flow Signals & Backtest".
- Message: Insert only the placeholder: {{strategy.order.alert_message}}
Once this single alert is active, it will "listen" to all orders executed by the strategy.
This means you can have your Long-Term, Short-Term, Signal-Based Exits, and TP/SL strategies active simultaneously. When any of these events are plotted on the chart, the script will send the customized message (which you wrote in the fields) to your single alert.
--
Advanced period filters: Allow you to test the strategy in specific date ranges, over the last X days, or over the last X bars, facilitating performance analysis in different market environments.
--
Status Panel: Displays a clear summary of all active rules and settings directly on the chart, facilitating the visualization and confirmation of the running logic.
Additionally, it has a settings box where you can activate or deactivate the panel, choose its position (such as at the bottom or side), and adjust its size.
--
The Thumbnail strategy uses the following external indicators: Multiple MTF MA and Breakout Finder .
--
Final Considerations:
The Logic Flow Signals & Backtest tool is a versatile and powerful system, designed to test and apply trading ideas based on multiple indicators from TradingView.
Its differential is being a customization environment: the script does not have integrated graphical indicators, as the objective is precisely to allow the user to combine and integrate multiple existing indicators in the TradingView community to build unique entry and exit logics.
It offers flexibility and precision, but the true value emerges when the trader integrates the tool into a consistent trading plan, with efficient risk management (Stop Loss and Take Profit), leverage control, and a professional mindset.
Important: Risk of Repainting (Unstable Data): Avoid indicators that 'repaint' (those that change their values in past bars after the closing of new candles). The backtest will be invalidated, and the actual performance of the strategy will fail.
Legal Warning and Didactic Purpose:
It is fundamental to understand that all visual examples, charts, and texts contained in this description do not constitute financial advice, buy or sell recommendations, nor a promise of easy or guaranteed gains.
This is an advanced support tool, not an automatic profit system. Use the integrated backtesting to evaluate the historical behavior of strategies before real execution and understand how different market conditions impact your results. The sole purpose of this material is to demonstrate the logical and execution capacity of the script, serving as a didactic guide for you to test and validate your own ideas.
Conclusion and Risk Warning:
Success in financial markets comes not only from a set of charting indicators, but from the trader's understanding, practice, and discipline. Our objective is to provide a robust, customizable, and intuitive solution, created to enhance your technical analysis and broaden your strategic vision, without replacing critical thinking and conscious decision-making.
Finally, remember: past results do not guarantee future performance. The real differentiator lies in continuous learning, testing, and evolution.

TrendSight📌 TrendSight — The All-in-One Multi-Timeframe Trend Engine
Key Features & Logic
Multi-Timeframe Trend Confirmation:
Entries are filtered by confirming bullish/bearish alignment across three distinct Supertrend timeframes (e.g., 5-min, 15-min, 45-min, etc.), combined with an EMA and volatility filter, to ensure high-conviction trades that's a powerful combination! Designing the entire strategy around the 15-minute timeframe (M15) and focusing on high-volatility coins maximizes the strategy's effectiveness .
Guaranteed Single-Entry per Signal:
The strategy uses a powerful manual flag and counter system to ensure trades fire only once when a new signal begins. It absolutely prevents immediate re-entry if the signal remains true, waiting instead for the entire trend condition to reset to false.
Dynamic Trailing Stop Loss:
The Stop Loss is set to a moving Supertrend line (current_supertrend), ensuring tight risk management that trails the price as the trade moves into profit.Guaranteed Take Profit (4% Run-up): Uses a precise Limit Order via strategy.exit() to capture profits instantly at a 4% run-up. This ensures accurate profit capture, even on sudden spikes (wicks).
Automated Risk Management:
Position size is dynamically calculated based on a fixed risk percentage (default 2% of equity) relative to the distance to the trailing stop.
🔥 Core Components
1. Adaptive Multi-Timeframe SuperTrend Dashboard
The backbone of mTrendSight is a fully customizable SuperTrend system, enhanced with a multi-timeframe confirmation table displaying ST direction & value.
This compact “Trend Dashboard” provides instant clarity on higher-timeframe direction, trend strength, and market bias.
2. Dynamic Support & Resistance Channels
Automatically detects the strongest support/resistance zones using pivot clustering.
Key Features:
Clustered S/R Channels instead of thin lines
Adaptive width based on recent swings
Breakout markers (optional) for continuation signals
Helps identify structural zones, retest areas, and liquidity pockets
3. Multi-Timeframe Color-Coded EMAs
Plot up to three EMAs, each optionally pulled from a higher timeframe.
Benefits:
Instant visual trend alignment
Bullish/Bearish dynamic color shifts
Precision EMA value table for trade planning
Works perfectly with ST & RSI for multi-layer confirmation
4. Linear Regression Trend Channel
A statistically driven trend channel that measures the most probable path of price action.
Highlights:
Uses Pearson’s R to determine trend reliability
Provides a Confidence Level to judge whether trend slope is credible
Ideal for determining over-extension and mean-reversion zones
5. ATR Volatility Analyzer
A lightweight but powerful volatility classifier using ATR.
Features:
Detects High, Low, or Normal volatility
Clean table display
Helps filter entries during low-energy markets
Strengthens trend-following filters when volatility expands
6. RSI Momentum & Trend Classifier
A significantly improved RSI with multi-layer smoothing and structure-based classification.
Provides:
Bullish / Bearish / Neutral momentum states
Short-term momentum vs long-term RSI trend
Perfect for early trend shifts, pullback entries, and momentum confirmation
⚙️ How the Strategy Works (Execution Logic)
📌 Multi-Timeframe Supertrend + EMA + Volatility Confirmation
Entries are only triggered when:
Multiple Supertrend timeframes align (e.g., 5m + 15m + 45m)
EMA direction aligns with the trend
Volatility conditions (ATR filter) is not Low allow high-probability moves
This ensures strong directional confluence before every trade.
📌 Guaranteed Single-Entry Logic
The strategy uses a flag + counter system to ensure:
Only one entry is allowed per trend signal
Re-entries do not happen until the entire trend condition resets
The Strategy Tester remains clean, without duplicate overlapping trades
This eliminates revenge trades, repeated fills, and choppy overtrading.
📌 Dynamic Supertrend Trailing Stop
Stop Loss is anchored to current Supertrend value, creating:
Automatic trailing
Tight downside control
Protection against deep pullbacks
High responsiveness during volatility expansions
📌 Precision Take-Profit (4% Run-Up Capture)
A dedicated global exit block ensures:
Take Profit triggers exactly at 4% price run-up
Uses strategy.exit() with limit orders to catch spikes (wicks)
Works consistently on all timeframes & assets
📌 Automated Position Sizing (2% Risk Default)
Position size is dynamically calculated based on:
Account Equity
Distance to trailing stop
Configured risk %
This enforces proper risk management without manual adjustments.
📈 How to Interpret Results
Reliable Exits: All exits are globally managed, so stops and take profits trigger accurately on every bar.
Clean Trade History: Because of single-entry logic, backtests show one trade per valid signal.
Consistency: Multi-timeframe logic ensures only high-quality, structured trades.

The Oracle: Dip & Top Adaptive Sniper [Hakan Yorganci]█ OVERVIEW
The Oracle: Dip & Top Adaptive Sniper is a precision-focused trend trading strategy designed to solve the biggest problem in swing trading: Timing.
Most trend-following strategies chase price ("FOMO"), buying when the asset is already overextended. The Oracle takes a different approach. It adopts a "Sniper" mentality: it identifies a strong macro trend but patiently waits for a Mean Reversion (pullback) to execute an entry at a discounted price.
By combining the structural strength of Moving Averages (SMA 50/200) with the momentum precision of RSI and the volatility filtering of ADX, this script filters out noise and targets high-probability setups.
█ HOW IT WORKS
This strategy operates on a strictly algorithmic protocol known as "The Yorganci Protocol," which involves three distinct phases: Filter, Target, and Execute.
1. The Macro Filter (Trend Identification)
* SMA 200 Rule: By default, the strategy only scans for buy signals when the price is trading above the 200-period Simple Moving Average. This ensures we are always trading in the direction of the long-term bull market.
* Adaptive Switch: A new feature allows users to toggle the Only Buy Above SMA 200? filter OFF. This enables the strategy to hunt for oversold bounces (dead cat bounces) even during bearish or neutral market structures.
2. The Volatility Filter (ADX Integration)
* Sideways Protection: One of the main weaknesses of moving average strategies is "whipsaw" losses during choppy, ranging markets.
* Solution: The Oracle utilizes the ADX (Average Directional Index). It will BLOCK any trade entry if the ADX is below the threshold (Default: 20). This ensures capital is only deployed when a genuine trend is present.
3. The Sniper Entry (Buying the Dip)
* Instead of buying on breakout strength (e.g., RSI > 60), The Oracle waits for the RSI Moving Average to dip into the "Value Zone" (Default: 45) and cross back up. This technique allows for tighter stops and higher Risk/Reward ratios compared to traditional breakout systems.
█ EXIT STRATEGY
The Oracle employs a dynamic dual-exit mechanism to maximize gains and protect capital:
* Take Profit (The Peak): The strategy monitors RSI heat. When the RSI Moving Average breaches the Overbought Threshold (Default: 75), it signals a "Take Profit", securing gains near the local top before a potential reversal.
* Stop Loss (Trend Invalidated): If the market structure fails and the price closes below the 50-period SMA, the position is immediately closed to prevent deep drawdowns.
█ SETTINGS & CONFIGURATION
* Moving Averages: Fully customizable lengths for Support (SMA 50) and Trend (SMA 200).
* Trend Filter: Checkbox to enable/disable the "Bull Market Only" rule.
* RSI Thresholds:
* Sniper Buy Level: Adjustable (Default: 45). Lower values = Deeper dips, fewer trades.
* Peak Sell Level: Adjustable (Default: 75). Higher values = Longer holds, potentially higher profit.
* ADX Filter: Checkbox to enable/disable volatility filtering.
█ BEST PRACTICES
* Timeframe: Designed primarily for 4H (4-Hour) charts for swing trading. It can also be used on 1H for more frequent signals.
* Assets: Highly effective on trending assets such as Bitcoin (BTC), Ethereum (ETH), and high-volume Altcoins.
* Risk Warning: This strategy is designed for "Long Only" spot or leverage trading. Always use proper risk management.
█ CREDITS
* Original Concept: Inspired by the foundational work of Murat Besiroglu (@muratkbesiroglu).
* Algorithm Development & Enhancements: Developed by Hakan Yorganci (@hknyrgnc).
* Modifications include: Integration of ADX filters, Mean Reversion entry logic (RSI Dip), and Dynamic Peak Profit taking.

SSL ST Strategy – Accuracy Enhanced v2.0 (Parser Safe)This strategy is built to identify high-probability trend breakouts using a combination of SSL Channel, Baseline, Hull / EMA signals, and Candle-based confirmations.
The goal is to filter noise, avoid false breakouts, and enter only when the trend is truly shifting.
This strategy identifies high-probability trend breakouts using SSL Channel, Baseline, Hull/EMA, and candle
confirmations.
1. SSL shows trend shift when price breaks high/low levels.
2. Baseline filters direction (price above = buy bias, below = sell bias).
3. Hull/EMA gives early momentum confirmation.
4. Candle breakout ensures real momentum (breaks previous high/low).
5. Optional filters: ATR, reversal logic, continuation entries.
6. Exits occur on SSL flip, baseline cross, or weakness
Disclaimer
This strategy is provided strictly for educational and informational purposes only. It does not guarantee any profit, nor does it protect against losses of any kind. Financial markets are inherently unpredictable, and any market movement can only be assumed or estimated with a probability that is never guaranteed and can often be no better than a 50/50 chance.
By using this strategy, you acknowledge that all trading decisions are made solely at your own risk. I am not liable for any profits, losses, or financial consequences incurred by anyone using or relying on this strategy. Always perform your own research, manage your risk responsibly, and consult with a qualified financial advisor before trading.
