Forex Midpoint Stratejisi For Nasdaq English Knowledge:
Midpoint Strategy;
The general calculation method is a strategy that helps determine direction by the intersection of a MA line and the value obtained by dividing the lowest and highest price in the specified length range.
Başlangıç Periyodu: The data length of the Midpoint Line.
Kaydırma Seviyesi: The number of steps forward or backward of the Midpoint Line.
Yüzde Seviyesi: the amount of vertical scrolling.
Uzunluk: The length of the MA line
represents.
This strategy is prepared for the Nasdaq 5-minute period. It needs to be optimized for use on other instruments.
There are take profit and stop loss levels within the codes. Friends who want to use it can remove the invisibility from the relevant sections. Also, I removed the midpoint and the MA line so that it does not crowd the image, you can add it if you want.
Thank you.
Turkish Knowledge:
Midpoint Stratejisi;
Genel hesaplama yöntemi, belirlenen uzunluk aralığındaki en düşük ve en yüksek fiyatın ikiye bölümü ile elde edilen değer ve bir ortalama çizgisinin kesişimleriyle yön belirlemeye yardımcı bir stratejidir.
Başlangıç Period: Midpoint Çizgisinin veri uzunluğunu.
Kaydırma Seviyesi: Midpoint Çizgisinin ileri veya geri adım sayısını.
Yüzde Seviyesi: dikey kaydırma miktarını.
Uzunluk: Ortalama çizgisinin uzunluğunu
temsil etmektedir.
Bu strateji Nasdaq 5 dakikalık periot için hazırlanmıştır. Diğer enstrümanlarda kullanılması için optimize edilmesi gerekir.
Kodların içinde Kar alma , zarar durdurma seviyeleri mevcuttur. Kullanmak isteyen arkadaşlar ilgili bölümlerden görünmezliği kaldırabilirler. ayrıca midpoint ve ortalama çizgisinide görüntü kalabalığı yapmaması için ben kaldırdım isterseniz siz ekleyebilirsiniz.
Teşekkürler.
移動平均線

X48 - Strategy | MA Type Cross + TPSL | Future&Spot | V.2Thank You For Open Source Code, This Strategy Ref. By 1.Simple Strategy Like MA Crossover For Long/Short or Spot Trade, 2. CDC Action Zone V.2 for BarPaint
This Strategy Mixing With MA Crossover Strategy and BarPaint By CDC Action Zone and TP/SL by Varbara
### How To Use Strategy : Setting EMA/SMA Crossover EMA/SMA, Any Value If You Want
For Long Position : Cross Up
For Short Position : Cross Down
Can Use With Spot Trade : Cross Up = Buy, Cross Down = Sell
TP/SL When Your OrderSize Change From any % Of Your TP/SL Value
### In Strategy Setting
Intitial Capital = Ex. 200
Order Size = Should Be Money Management Not Use 100% of Capital Ex. 10% of Capital (200$) = Order Size 20$
StopLoss and Take Profit = If You Run Trend TF 4H+ or 1D+ You Can Change TP% = 1,000% for nonlimit and Stop Loss 5 - 20% from your order size
Ex. Stoploss 15% = OrderSize / 100 x %SL = 20$/100 x 15% = 3$ Loss from order size 20$ (if you not set stop loss.)
Base Currency = (Your Currency) # Ex. USD
Commission = (Your Trading Fee) # Ex. Future Fee Can Check At Binance Fee Rate > www.binance.com > Choose Your Fee Type, Ex. USD M Future (Regular User) = 0.02 (Maker), 0.04 (Taker)
Commission Symbol Type = % # (Ref. By Binance Fee Rate)
### Notice ####
Default Setting It's Realistic From Normal Life Ex. Capital 200$ / Ordersize 20$ (10%)/ Commission 0.1% (Buy+Sell) / Slippage = 2 / TP = 1000% (nonlimit) / SL = 15%/OrderSize
Low Risk But High Return, Good Luck
### Bot Auto Trade by X4815162342 ###
if you wanna try my bot auto trade X48-3in1-bot : Contact My Line ID : x4815x
Full Command Alert For This Strategy If You Wanna See It's
'{"ex":"'+markettype+'","side": "'+longcommand+'", "amount": "@{{strategy.order.contracts}}", "symbol": "{{ticker}}", "passphrase": "'+passphrase+'","leverage":"'+str.tostring(leveragex)+'"}'
'{"ex":"'+markettype+'","side": "'+shortcommand+'", "amount": "@{{strategy.order.contracts}}", "symbol": "{{ticker}}", "passphrase": "'+passphrase+'","leverage":"'+str.tostring(leveragex)+'"}'
But Easy Than Full Command Just Use Thisssssss !! Strategy Be Manage Auto Long and Short or TPSL Position
You Don't Do Anything Just Use This Message to Alerts Message
{{strategy.order.alert_message}}
### If you don't use bot but just looking for strategy test ####
Just Pass Bot Setting Function It's Nothing Effect For Strategy !!!!!!
Let's Enjoy With Your Strategy BackTest 😁
Remember Beware Max drawdown%. I'm Recommend Lower Than 10% It's Very Good.

Arpan_Koushik_5_EMAArpan_Koushik_5_EMA is an extended EMA indicator, which will provide perfect buy and sell call.

Double Bollinger-Bands w/ Alerts for BacktestingFor Mr. Nick and anyone else who stumbles across this.


DCA After Downtrend (by BHD_Trade_Bot)The purpose of the strategy is to identify the end of a short-term downtrend . So that you can easily to DCA certain amount of money for each month.
ENTRY
The buy orders are placed on a monthly basis for assets at the end of a short-term downtrend:
- Each month condition: In 1-hour time frame, each month has 240 candles
- The end of short-term downtrend condition: use MACD for less delay
CLOSE
The sell orders are placed when:
- Is last bar
The strategy use $1000 and trading fee is 0.1% for each order.
Pro tip: The 1-hour time frame for TSLA has the best results on average:
- Total spent: $1000 x 85 = $85,000
- Total profit: $790,556

RSI SMA Crossover StrategyOverview
RSI SMA Crossover Strategy works the same way as traditional MA crossover strategies, but using RSI instead of price. When RSI crosses over the SMA, a long position is opened (buy). When RSI crosses under the SMA, the long position is closed (sell).
This strategy can be very effective when the right inputs are used (see below). Be sure to use the backtesting tool to determine the optimal parameters for a given asset/timeframe.
Inputs/Parameters
RSI Length: length for RSI calculation (default = 50)
SMA Length: length for SMA calculation (default = 25)
Strategy Properties
Initial Capital = $1000
No default properties are defined for Slippage, Commission, etc, so be sure to set these values to get accurate backtesting results. This script is being published open-source for a reason - save yourself a copy and adjust the settings as you like!
Backtesting Results
Testing on Bitcoin (all time index) 1D chart, with all default parameters.
$1,000 initial investment on 10/07/2010 turns into almost $2.5 billion as of 08/30/2022 (compared to $334 million if the initial investment was held over the same period)
Remember, results can vary greatly based on the variables mentioned above, so always be sure to backtest.

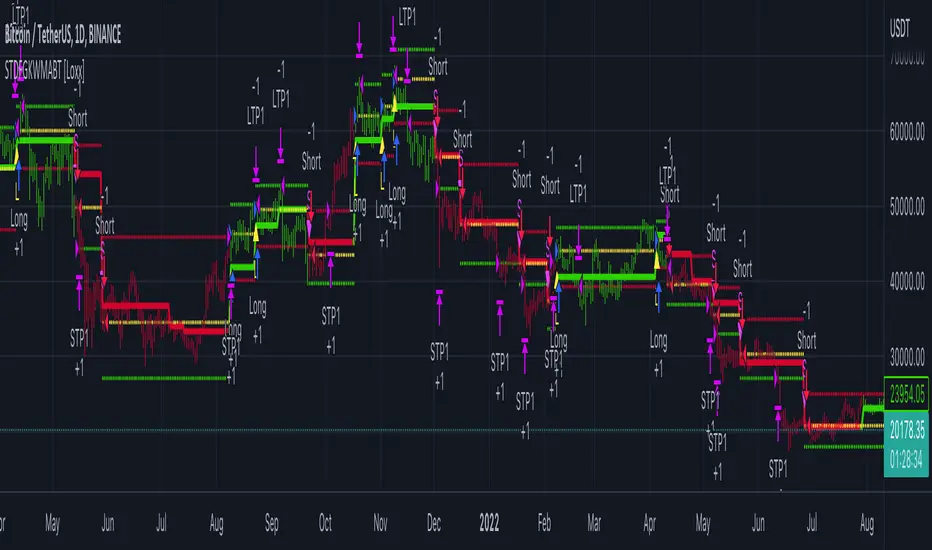
STD-Filtered, Gaussian-Kernel-Weighted Moving Average BT [Loxx]STD-Filtered, Gaussian-Kernel-Weighted Moving Average BT is the backtest for the following indicator
Included:
This backtest uses a special implementation of ATR and ATR smoothing called "True Range Double" which is a range calculation that accounts for volatility skew.
You can set the backtest to 1-2 take profits with stop-loss
Signals can't exit on the same candle as the entry, this is coded in a way for 1-candle delay post entry
This should be coupled with the INDICATOR version linked above for the alerts and signals. Strategies won't paint the signal "L" or "S" until the entry actually happens, but indicators allow this, which is repainting on current candle, but this is an FYI if you want to get serious with Pinescript algorithmic botting
You can restrict the backtest by dates
It is advised that you understand what Heikin-Ashi candles do to strategies, the default settings for this backtest is NON Heikin-Ashi candles but you have the ability to change that in the source selection
This is a mathematically heavy, heavy-lifting strategy. Make sure you do your own research so you understand what is happening here.
STD-Filtered, Gaussian-Kernel-Weighted Moving Average is a moving average that weights price by using a Gaussian kernel function to calculate data points. This indicator also allows for filtering both source input price and output signal using a standard deviation filter.
Purpose
This purpose of this indicator is to take the concept of Kernel estimation and apply it in a way where instead of predicting past values, the weighted function predicts the current bar value at each bar to create a moving average that is suitable for trading. Normally this method is used to create an array of past estimators to model past data but this method is not useful for trading as the past values will repaint. This moving average does NOT repaint, however you much allow signals to close on the current bar before taking the signal. You can compare this to Nadaraya-Watson Estimator wherein they use Nadaraya-Watson estimator method with normalized kernel weighted function to model price.
What are Kernel Functions?
A kernel function is used as a weighing function to develop non-parametric regression model is discussed. In the beginning of the article, a brief discussion about properties of kernel functions and steps to build kernels around data points are presented.
Kernel Function
In non-parametric statistics, a kernel is a weighting function which satisfies the following properties.
A kernel function must be symmetrical. Mathematically this property can be expressed as K (-u) = K (+u). The symmetric property of kernel function enables its maximum value (max(K(u)) to lie in the middle of the curve.
The area under the curve of the function must be equal to one. Mathematically, this property is expressed as: integral −∞ + ∞ ∫ K(u)d(u) = 1
Value of kernel function can not be negative i.e. K(u) ≥ 0 for all −∞ < u < ∞.
Kernel Estimation
In this article, Gaussian kernel function is used to calculate kernels for the data points. The equation for Gaussian kernel is:
K(u) = (1 / sqrt(2pi)) * e^(-0.5 *(j / bw )^2)
Where xi is the observed data point. j is the value where kernel function is computed and bw is called the bandwidth. Bandwidth in kernel regression is called the smoothing parameter because it controls variance and bias in the output.
Tom Strategy 3EMA LibIndicator user EMA 3 line
FastEMA = 20
MidEMA = 50
SlowEMA = 180
strategy.long short = FastEMA cross SlowEMA
strategy.close = FastEMA cross MidEMA
and table statistic won lost .

Trend Identifier StrategyTrend Identifier Strategy for 1D BTC.USD
The indicator smoothens a closely following moving average into a polynomial like plot and assumes 4 staged cycles based on the first and the second derivatives. This is an optimized strategy for long term buying and selling with a Sortino Ratio above 3. It is designed to be a more profitable alternative to HODLing. It can be combined with 'Accumulation/Distribution Bands & Signals' and 'Exponential Top and Bottom Finder'.

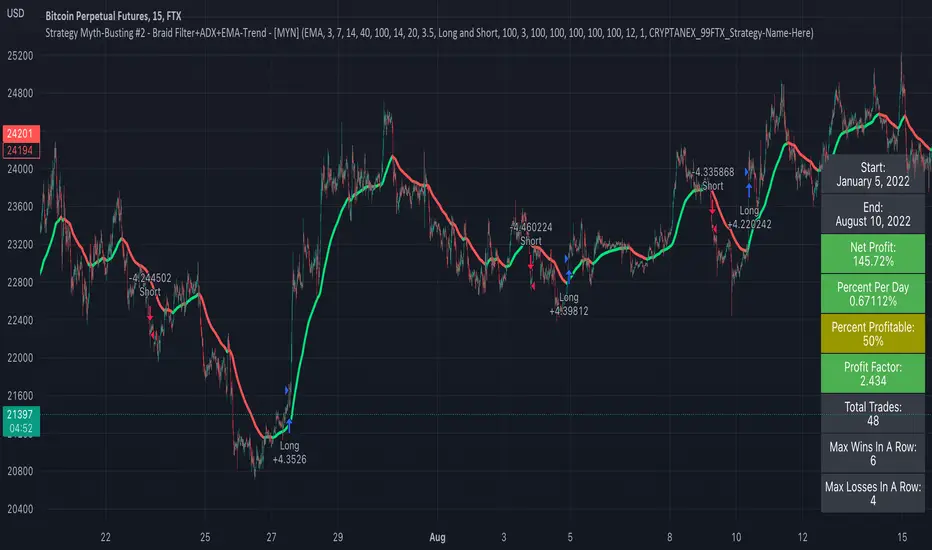
Strategy Myth-Busting #2 - Braid Filter+ADX+EMA-Trend - [MYN]This is part of a new series we are calling "Strategy Myth-Busting" where we take open public manual trading strategies and automate them. The goal is to not only validate the authenticity of the claims but to provide an automated version for traders who wish to trade autonomously.
Our second one we are automating is the " Braid Filter: The Indicator That Will Make You a Fortune ( Crazy Win Rate ! ) " strategy from " TradeIQ " who claims to have backtested this manually and achieved 453% profit with a 75% winrate over 100 trades in just a few months. I was unable to emulate these results accommodating for slippage and commission but this strategy does fair pretty well at least compared to the first one we automated.
If you know of or have a strategy you want to see myth-busted or just have an idea for one, please feel free to message me.
This strategy uses a combination of 3 open-source public indicators:
Braid Filter by Robert Hill
CM_EMA Trend Bars by Chris Moody
ADX and DI for V4 by Trend Bars by BeikabuOyaji
Trading Rules
15 min candles but other time-frames seem to work well too.
Long
1) Buy Price action above moving average. (bars are green)
2) Braid filter must issue a new green bar
3) ADX must be above the 20 level and be pointed up, If flat or downwards, don't enter trade (adjust ADX Slope to increase/decrease the incline of the slope)
4) Stop loss at the moving average or recent swing low.
Short
1) Buy Price action below moving average. (bars are red)
2) Braid filter must issue a new red bar
3) ADX must be above the 20 level and be pointed up, If flat or downwards, don't enter trade (adjust ADX Slope to increase/decrease the incline of the slope)
4) Stop loss at the moving average or recent swing high.
Target 1.5x the risk
ALMA/EMA/SRSI Strategy + IndicatorBack with another great high hit rate strategy!!
Disclaimer* This strategy was sampled using source code written by @ClassicScott , as referred to in the script, there is a clear line where the source code was scripted by myself.
This Strategy consists of three key factors, the ALMA, EMA crossover, and a Stochastic Rsi
ALMA: The Alma is the step line shown, turning green and red at select times. This average value gives general oversight of the macro movement of price action. and this particular one was coded by Mr.ClassicScott.
EMA crossover: At the input screen you are given an option of the fast and slow ema's. The default is solely for the hit rate and correlation to the Alma of this strategy. The arrows you see depicted on the chart are the crossover events happening.
Stochastic Rsi: The Stochastic Rsi is a stochastic value, using data sampled from the rsi. The use of this indicator in my strategy is to prevent entries when too overbought and oversold, as well as closures and vice versa, to prevent holding bags either way.
Fixed % TP: In the input screen you are given a take profit and stop loss percentage, for good R/R the hit rate will take a notch down, but with no R/R it will be near perfect.
How to use this:
Add it to your chart to get the strategy inputs. (The strategy is really only useful on a 15min TF. However the indicator within it can be used on anything at anytime!)
Watch the yellow and aqua moving averages, these are your ema's and crossover's will trigger signals based on your integer inputs.
Find Correlation between other leading indicators, as well as crossover's down/up and a red/green alma.
DO NOT use the arrows as buy/sell signals. These are simply to show ema's are crossing under or over. Momentum indicator's paired with this can be useful to determine if it could be a buy signal or sell signal.
Cheat Code's Notes:
Almost at 1000 boosts!!! I appreciate the support from everyone and I will keep trying my best to deliver quality strategies for the people.
-Cheat Code
BYBIT:BTCUSDT

VXMA BotThis strategy is separated version of Cloud MA form VXD Cloud Edition, Let called it "VXMA".
what's changed?
renew TP/SL Work
Simplify code and clean look.
Risk:Reward Calculation
Risk of Ruin Setting can now selected between Fixed $ or %
if Buy your Stoploss will be Swing low
if Sell your Stoploss will be Swing high and can be setting at Pivot Setting
then Auto Position Sizing and TP line will be calculated form there and will show in Orange color line (Draw Position Box is available)
Alert Setting
{{strategy.order.alert_message}}
Python-Bot
github.com
There are 2 mode : one-way mode and hedge mode is different script on my Github profile.
read README. MD and there's video tutorial.
Pls study app.py and it's script before deploy for your own safty and your own risk, I'm NOT responsible for your loss.
GOODLUCK

Take Profit On Trend v2 (by BHD_Trade_Bot)The purpose of strategy is to detect long-term uptrend and short-term downtrend so that you can easy to take profit.
The strategy also using BHD unit to detect how big you win and lose, so that you can use this strategy for all coins without worry about it have different percentage of price change.
ENTRY
The buy order is placed on assets that have long-term uptrend and short-term downtrend:
- Long-term uptrend condition: ema200 is going up
- Short-term downtrend condition: 2 last candles are down price (use candlestick for less delay)
CLOSE
The sell order is placed when take profit or stop loss:
- Take profit: price increase 2 BHD unit
- Stop loss: price decrease 3 BHD unit
The strategy use $1000 for initial capital and trading fee is 0.1% for each order.
Pro tip: The 1-hour time frame for ETH/USDT has the best results on average.

VIPThis indicator is using the modified "SSS".
This strategy uses combined indicators to create LONG entry points, the strategy was first found by saudALThaidy.
How to use: Open your asset and pick a timeframe between 5min and 2hours (recommended: 30min, 45min), the strategy will give entry points itself, you can monitor and take profit manually(recommended), or you can use the exit setup.
exit setup:
Take Profit : close the trade and take profit after the specified percentage from the entry point gets hit.
Use Stop Percentage : if false, trade will be closed if it gets below MA line, if true it will use the next set up.
StopLose Percentage : specify a percentage to close the trade if the asset price goes below it.
Important Notes:
As saudALThaidy states that the strategy must be used with -heiken ashi- candles for the best result.
for best use of the strategy, use (Take Profit = 1,Use Stop Percentage=false) to get every trade, and take profit manually when ever you see the best.
For any notes on the strategy to be edited, or for another strategies ideas please comment.

Fast v Slow Moving Averages Strategy (Variable) [divonn1994]This is a simple moving average based strategy that takes 2 moving averages, a Fast and a Slow one, plots them both, and then decides to enter a 'long' position or exit it based on whether the two lines have crossed each other. It goes 'long when the Fast Moving Average crosses above the Slow Moving Average. This could indicate upwards momentum in prices in the future. It then exits the position when the the Fast Moving Average crosses back below. This could indicate downwards momentum in prices in the future. This is only speculative, though, but sometimes it can be a very good indicator/strategy to predict future action.
I've tried some strategy settings and I found different promising strategies. Here are a few:
BTCUSD ( BitStamp ) 1 Day Timeframe : EMA, Fast length 25 bars, Slow length 62 bars => 28,792x net profit (default)
BTCUSD ( BitStamp ) 1 Day Timeframe : VWMA, Fast length 21 bars, Slow length 60 bars => 15,603x net profit
BTCUSD ( BitStamp ) 1 Day Timeframe : SMA, Fast length 18 bars, Slow length 51 bars => 19,507x net profit
BTCUSD ( BitStamp ) 1 Day Timeframe : RMA, Fast length 20 bars, Slow length 52 bars => 5,729x net profit
BTCUSD ( BitStamp ) 1 Day Timeframe : WMA, Fast length 29 bars, Slow length 60 bars => 19,869x net profit
Features:
-You can choose your preferred moving average: SMA , EMA , WMA , RMA & VWMA .
-You can change the length average for each moving average
-I made the background color Green when you're currently in a long position and Red when not. I made it so you can see when you'd be actively in a trade or not. The Red and Green background colors can be toggled on/off in order to see other indicators more clearly overlayed in the chart, or if you prefer a cleaner look on your charts.
-I also have a plot of the Fast moving average and Slow moving average together. The Opening moving average is Purple, the Closing moving average is White. White on top is a sign of a potential upswing and purple on top is a sign of a potential downswing. I've made this also able to be toggled on/off.
Let me know if you think I should change anything with my script, I'm always open to constructive criticism so feel free to comment below :)

3C Reversal Filter v1In essence, this strategy is a heavily smoothed range filter.
This strategy includes a backtester and ability to connect it with your 3 commas bot(See adviced settings below)
The calculation steps below gives an example on how signals are made:
1. Calculating the price movement using ATR, % change, standard deviation etc..
2. Obtaining the smoothed price using SMA.
3. Obtaining the absolute value of the bar-to-bar change.
4. Applying EMA, twice, to the values in step 3.
5. Obtaining the slow trailing line by multiplying the result of step 4 by 1.618.
Think of it as a heavily smoothed price range
If the 1.618 value looks familiar, that’s because it’s used in Fibonacci sequences. You can of course experiment with other values. I’ve seen good results with both 2.618 and 4.236
What does the strategy do?
1. Determine Trend Detection
2. Detect Short-Term Momentum
3commas settings:
-For now you can only use simple bots.
-Create LONG and SHORT bots for the coins you like to trade and set up alerts(You can send long and short signal from the same alert)
-Set TP to 50% the strategy will handle buys and exits based on your inputs.
-Set safety orders to 0. I might add DCA to the strategy if testing proves that to be a good solution.
-When you have made the bots input the bot ID and token adress in the settings of the strategy.
-When creating the alert use this webhook :https://3commas.io/trade_signal/trading_view
-In the message field you use {{strategy.order.alert_message}} as the placeholder.

3c Ultimate reversal strategy With scanner and backtester v2This might just be the ultimate strategy to identify reversals.
This strategy includes a scanner, a backtester and ability to connect it with you 3 commas bot(See adviced settings below)
Strategy:
-Signals reversal that happened in the last bar. This signal DO NOT repaint.
-Identifies potential reversal that might happen in the current bar but can also not happen depending upon the timeframe closing price.
-The strategy combines the Moving Average Trend Changer, SuperTrend (ATR price detection) and ADX.
-It reduces the number of false signals in sideways market conditons and give more reliable trade signals.
-The signal does not repaint and can be used in any market condition. It determines the trend with high precision.
Take profit:
-Set 2 separate TP conditions.
-You can take profit using percentage, ATR, or RR(Risk Reward), aswell as using Trailing Take Profit.
- Use sell signal from the strategy(I often find way better results using that)
Stoploss:
-You can use either ATR, Percentage or sell signal from the strategy
(For now to let the strategy itself decide when to TP or SL, just set these parameters really high.)
Scanner:
-Identifies coins that are currently in the sell zone
-Identifies coins that are currently in the buy zone
-Screener explores up to 20 pairs in current graph's time frame.
-Optimize the strategy to your liking and use the built in backtester to see if it is a viable strategy.
3commas settings:
-For now you can only use simple bots.
-Create LONG and SHORT bots for the coins you like to trade and set up alerts(You can send long and short signal from the same alert)
-Set TP to 50% the strategy will handle buys and exits based on your inputs.
-Set safety orders to 0. I might add DCA to the strategy if testing proves that to be a good solution.
-When you have made the bots input the bot ID and token adress in the settings of the strategy.
-When creating the alert use this webhook :https://3commas.io/trade_signal/trading_view
-In the message field you use {{strategy.order.alert_message}} as the placeholder.
In the future this signal might make it to the 3commas marketplace. You can then subscribe to that signal where I have cherrypicked coins based on thorough backtesting and optimization.

Short Term RSI and SMA Percentage ChangeThis strategy utilises common indicators like RSI and moving averages in order to enter and exit trades. The Relative Strength Index (RSI) is a momentum indicator that has a value between 0 and 100, where a value greater than 70 is considered overbought and a value less than 30 is oversold. If the RSI value is above or below these values, then it can signal a possible trend reversal.
The second indicator used in this strategy is the Simple Moving Average (SMA). A SMA is an arithmetic moving average calculated by adding recent prices and then dividing that figure by the number of time periods in the calculation average. For example, one could add the closing price of a coin for a number of time periods and then divide this total by that same number of periods. Short-term averages respond quickly to changes in the price of the underlying coin, while long-term averages are slower to react.
Long/Exit orders are placed when three basic signals are triggered.
Long Position:
RSI is greater than 50
MA9 is greater than MA100
MA9 increases by 6%
Exit Position:
Price increases 5% trailing
Price decreases 5% trailing
The script is backtested from 1 May 2022 and provides good returns.
A trading fee of 0.1% is also taken into account and is aligned to the base fee applied on Binance.
This script also works well on AVAX 45m/1h, MATIC 15m/45m/1h and ETH 4h.

Close v Open Moving Averages Strategy (Variable) [divonn1994]This is a simple moving average based strategy that works well with a few different coin pairings. It takes the moving average 'opening' price and plots it, then takes the moving average 'closing' price and plots it, and then decides to enter a 'long' position or exit it based on whether the two lines have crossed each other. The reasoning is that it 'enters' a position when the average closing price is increasing. This could indicate upwards momentum in prices in the future. It then exits the position when the average closing price is decreasing. This could indicate downwards momentum in prices in the future. This is only speculative, though, but sometimes it can be a very good indicator/strategy to predict future action.
What I've found is that there are a lot of coins that respond very well when the appropriate combination of: 1) type of moving average is chosen (EMA, SMA, RMA, WMA or VWMA) & 2) number of previous bars averaged (typically 10 - 250 bars) are chosen.
Depending on the coin.. each combination of MA and Number of Bars averaged can have completely different levels of success.
Example of Usage:
An example would be that the VWMA works well for BTCUSD (BitStamp), but it has different successfulness based on the time frame. For the 12 hour bar timeframe, with the 66 bar average with the VWMA I found the most success. The next best successful combo I've found is for the 1 Day bar timeframe with the 35 bar average with the VWMA.. They both have a moving average that records about a month, but each have a different successfulness. Below are a few pair combos I think are noticeable because of the net profit, but there are also have a lot of potential coins with different combos:
It's interesting to see the strategy tester change as you change the settings. The below pairs are just some of the most interesting examples I've found, but there might be other combos I haven't even tried on different coin pairs..
Some strategy settings:
BTCUSD (BitStamp) 12 Hr Timeframe : 66 bars, VWMA=> 10,387x net profit
BTCUSD (BitStamp) 1 Day Timeframe : 35 bars, VWMA=> 7,805x net profit
BNBUSD (Binance) 12 Hr Timeframe : 27 bars, VWMA => 15,484x net profit
ETHUSD (BitStamp) 16 Hr Timeframe : 60 bars, SMA => 5,498x net profit
XRPUSD (BitStamp) 16 Hr Timeframe : 33 bars, SMA => 10,178x net profit
I only chose these coin/combos because of their insane net profit factors. There are far more coins with lower net profits but more reliable trade histories.
Also, usually when I want to see which of these strategies might work for a coin pairing I will check between the different Moving Average types, for example the EMA or the SMA, then I also check between the moving average lengths (the number of bars calculated) to see which is most profitable over time.
Features:
-You can choose your preferred moving average: SMA, EMA, WMA, RMA & VWMA.
-You can also adjust the previous number of calculated bars for each moving average.
-I made the background color Green when you're currently in a long position and Red when not. I made it so you can see when you'd be actively in a trade or not. The Red and Green background colors can be toggled on/off in order to see other indicators more clearly overlayed in the chart, or if you prefer a cleaner look on your charts.
-I also have a plot of the Open moving average and Close moving average together. The Opening moving average is Purple, the Closing moving average is White. White on top is a sign of a potential upswing and purple on top is a sign of a potential downswing. I've made this also able to be toggled on/off.
Please, comment interesting pairs below that you've found for everyone :) thank you!
I will post more pairs with my favorite settings as well. I'll also be considering the quality of the trades.. for example: net profit, total trades, percent profitable, profit factor, trade window and max drawdown.
*if anyone can figure out how to change the date range, I woul really appreciate the help. It confuses me -_- *

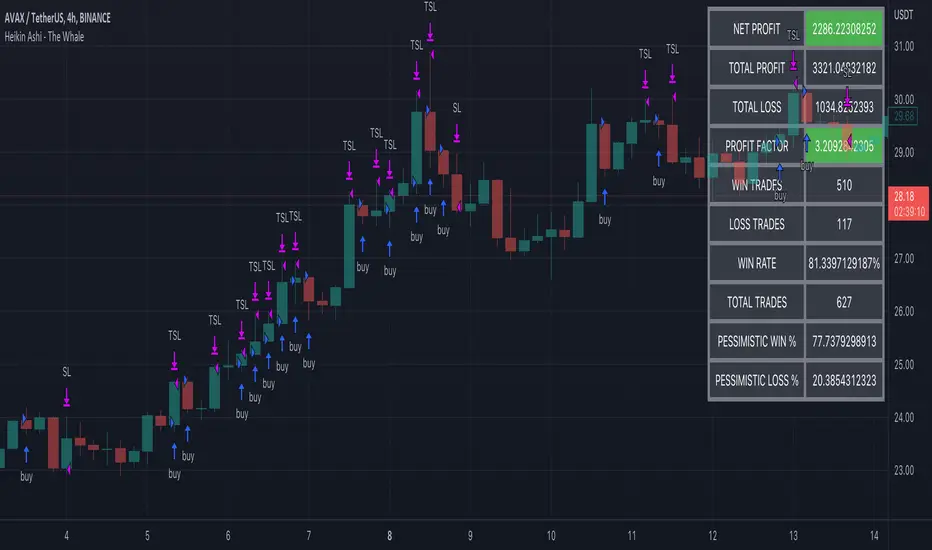
Heikin Ashi - The WhaleThe strategy is based on Heikin Ashi calculation, you do not need to switch the candle to HA.
The HA is used as a base entry, if a candle or two candles are bullish, then is valid to open a position, you can select the validation, one or two candles.
Also, the strategy mainly uses volume indicators as a confluence, you can select VWAP , VWMA , and Volume Oscillator, in addition to ADX which has two ways to validate the entry.
Base entry: One or two bullish HA candles (candles without a lower wick)
Confluence Indicators:
ADX: Will give a positive signal only if ADX is above the threshold, or if +DI is above -DI, or both.
VWAP: will give a positive signal if HA close is above VWAP.
VWMA: composite of 3 MA (20, 25, 50). There are multiple options to set it as confluence, the first option is to check if the short is bigger than the long and long is bigger than the base. The other options are to check the close status, which is bigger than which MA. You can find the description of each option in the strategy box
The sell is based on trailing stop loss (TSL), while the stop loss is based lowest X candle, the strategy will look back to the lowest number of the HA candles and set it as stop loss.
Stochastic Rsi+Ema - Auto Buy Scalper Scirpt v.0.3Simple concept for a scalping script, written for 5 minute candles, optimized for BTC.
1st script I've created from scratch, somewhat from scratch. Also part of the goal of this one is to hold coin as often as possible, whenever it's sideways or not dropping significantly.
Designed to buy on the stochastic bottoms (K>D and rising, and <17)
Then and sell after 1 of 3 conditions;
a. After the price goes back up at least 1 % and then 1-2 period ema reversal
b. After the rsi reversal (is dropping) and K
