NICHI (NuwenPham's Ichimoku)NICHI (NuwenPham’s Ichimoku)
NICHI is a dual-engine Ichimoku indicator designed for modern, high-volatility markets.
It preserves a faithful traditional Ichimoku while introducing an advanced, filter-driven Ichimoku framework for research, visualization, and discretionary trading.
The goal of NICHI is not to replace Ichimoku — but to extend it.
Overview
NICHI includes two independent Ichimoku systems that can be enabled separately or together.
1. Standard Ichimoku
A clean, traditional Hosoda Ichimoku using Donchian midpoints:
Tenkan-sen (short period)
Kijun-sen (medium period)
Senkou Span A & B (forward displaced)
Chikou Span (lagging)
Design choice:
The Standard Ichimoku is intentionally plotted in a separate pane to avoid cluttering the price chart.
It serves as a reference / regime baseline, not a visual overlay.
2. Advanced Ichimoku
The Advanced system keeps the Ichimoku structure intact but replaces the Donchian calculations with selectable smoothing filters.
Each Ichimoku component (Tenkan, Kijun, Senkou B, Chikou) can be calculated using modern filters designed to handle volatility, noise, and regime shifts.
Supported filters include:
McGinley Dynamic (MD)
VWMA (exchange or tick-derived volume)
EMA / DEMA / SMA / SMMA / WMA
ALMA / LSMA / Hull MA
COVWMA / FRAMA / KAMA
50th Percentile
Moving Median
This allows Ichimoku to behave as:
A smoother trend system
A volatility-adaptive framework
A momentum-responsive overlay
Enhanced Cloud (Kumo) Modeling
Advanced Kumo logic includes:
Independent forward offsets for Span A and Span B
Bull / bear regime classification aligned with how the cloud is actually drawn
Adaptive cloud coloring
Neutral cloud state when spans disagree
This avoids misleading regime signals when different offsets are used.
Directional Persistence Tracking
NICHI tracks directional streaks for key components:
Tenkan direction
Kijun direction
Span A direction
Span B direction
These persistence counters stabilize coloring, reduce flicker, and improve visual clarity during transitions.
Bar Coloring Modes (Advanced)
Three bar-coloring frameworks are included.
Kumo-Based
Above cloud → bullish
Below cloud → bearish
Inside cloud → neutral
Tenkan / Kijun-Based
Above both → bullish
Below both → bearish
Chikou-Based
Chikou above past price → bullish
Chikou below past price → bearish
Each mode is intentionally distinct and serves a different trading style.
Moving Average Overlays
NICHI includes four optional moving average overlays (MA1–MA4):
Configurable type, length, width, and source
Intended for bias, confluence, or higher-timeframe context
Controlled as code-level constants by design
What Changed Since BETA
This release promotes NICHI from beta to stable with the following key improvements:
Chikou regime logic fixed:
Chikou comparisons now reference historical price only, eliminating any future lookahead behavior.
Kumo bull/bear alignment clarified:
Cloud regime classification now matches how the cloud is visually drawn when Span A and Span B use different forward offsets.
Kijun direction tracking corrected:
Kijun coloring now reflects Kijun movement, not Tenkan movement.
Bar coloring gated:
Bar coloring is applied only when Advanced Ichimoku is enabled, preventing unintended behavior when using Standard mode alone.
General stability and cleanup:
Minor bug fixes, consistency improvements, and documentation clarity.
Notes
Advanced Ichimoku is intended for research and visualization, not as a turnkey strategy.
Standard Ichimoku remains a faithful baseline.
If reporting issues, please include symbol, timeframe, and a screenshot.
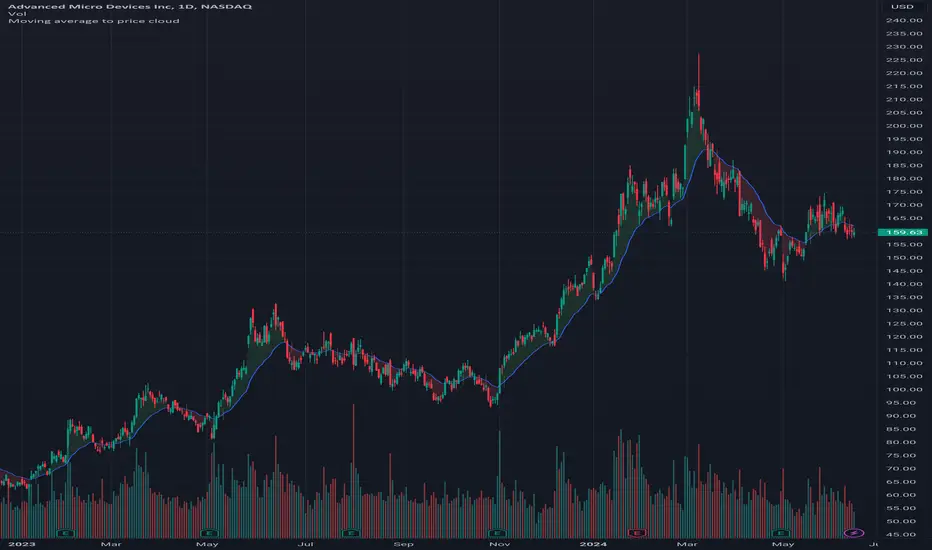
Movingaveragecloud

Moving average to price cloudHi all!
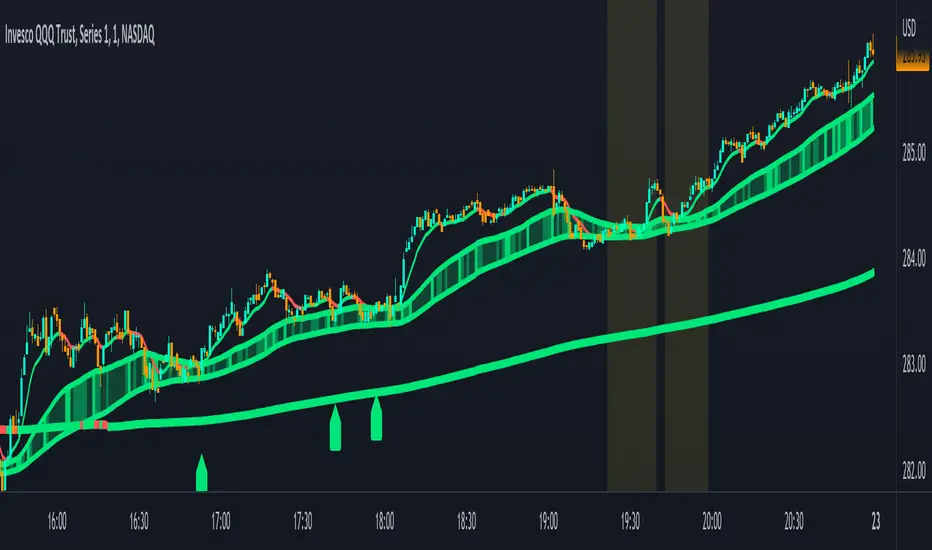
This indicator shows when the price crosses the defined moving average. It plots a green or red cloud (depending on trend) and the moving average. It also plots an arrow when the trend changes (this can be disabled in 'style'->'labels' in the settings).
The moving average itself can be used as dynamic support/resistance. The trend will change based on your settings (described below). By default the trend will change when the whole bar is above/below the moving average for 2 bars (that's closed). This can be changed by "Source" and "Bars".
Settings
• Length (choose the length of the moving average. Defaults to 21)
• Type (choose what type of moving average).
- "SMA" (Simple Moving Average)
- "EMA" (Exponential Moving Average)
- "HMA" (Hull Moving Average)
- "WMA" (Weighted Moving Average)
- "VWMA" (Volume Weighted Moving Average)
- "DEMA" (Double Exponential Moving Average)
Defaults to"EMA".
• Source (Define the price source that must be above/below the moving average for the trend to change. Defaults to 'High/low (passive)')
- 'Open' The open of the bar has to cross the moving average
- 'Close' The close of the bar has to cross the moving average
- 'High/low (passive)' In a down trend: the low of the bar has to cross the moving average
- 'High/low (aggressive)' In a down trend: the high of the bar has to cross the moving average
• Source bar must be close. Defaults to 'true'.
• Bars (Define the number bars whose value (defined in 'Source') must be above/below the moving average. All the bars (defined by this number) must be above/below the moving average for the trend to change. Defaults to 2.)
Let me know if you have any questions.
Best of trading luck!
SuperCloudSupercloud is a MA based Trend Representation. Its different from a normal MA Cloud. Cloud starts from '0' level and rise or fall based on price.
Supercloud is plotted based on the difference of the price movement between various MA's of different length. All MA's are plotted with reference to EMA 200. So when the MA's converge or Diverge or Bounce back we can still be in the Trend unless the Cloud goes below or above Zero Line.
works in all Timeframes.
Up Trend:
-> All MA's are Above Zero and Cloud color is complete green
-> A decrease in Cloud Volume indicates a weaker Momentum
Down Trend:
-> All MA's are Below Zero and Cloud color is complete red
-> A decrease in Cloud Volume indicates a weaker Momentum
Sideways:
-> A Mixed color indicates a Sideways moment.
Cloud Outlines:
1) The outer edge of Cloud shows the actual trend.
2) its based on MA-5, when price is above MA 5 or Below MA 5 a bright green and bright red outlines are plotted.
Buy Signals Confirmation:
upper Outer Cloud must be Bright Green
Cloud under must be fully Shaded Green
Alternatively EMA crossover can be used and confirmed.
Sell Signals Confirmation:
lower Outer Cloud must be Bright Red
Cloud under must be fully Shaded Red
Alternatively EMA cross under can be used and confirmed.
MACD
MACD is also plotted within the cloud.
Color ribbon is used to plot MACD
Histogram is not present. Instead use the width of the MACD Ribbon
Correspondingly Outer Cloud represents the Histogram.
Zero Line:
Zero line is actually EMA5 which is to be treated as EMA200 for our visual representation.
A sideway channel is plotted around Zero line.
When price reaches this sideways Zone price usually get rejections and starts moving side ways.
Trend is established only after price crosses the sideway band.
Sideway is calculated based on mintick of the Asset which varies. a min value equivalent to 10EMA or value 10 must be used for better usage.

Combined Moving Averages + Squeeze & Volume Spike SignalsThis is a set of 4 combined moving averages. Each moving average is a combination of an EMA, SMA, HMA, RMA, WMA and VWMA with the same length as set in your input settings. All 6 of them are added together and then divided by 6 for an average of all of them. This is based on the theory that most traders use their own preference of moving averages, so combining them all should give us a better idea of where price should actually react since we are using the average of what most traders are using on their charts. It also smooths the moving averages out as well so you get a much easier to read moving average than any of them on their own which should help you hold positions longer and time your entries better.
The default lengths used for this indicator are as follows: 10, 50, 100 and 500. These lengths can be updated in the settings. The 10 and 500 will change colors when the individual moving average is less than or greater than its previous value. Price above or below the moving average does not affect the colors. The 50 and 100 are colored based on whether the 50 is greater/less than the 100.
The two middle length moving averages by default are the 50 and 100. This has been turned into a cloud because it is the area where price typically bounces, since tons of traders use the 50 and 100 moving averages. This should be your long/short zone when price is trending.
Each moving average can be set to use a different source such as close, open, high, low, ohlc4, etc. You can also adjust the length of each moving average. Default settings work well, but feel free to customize them to your liking. You can also change the colors of the lines in the settings.
Beware that changing the lengths of MA #2 and MA #3 will change the signals, squeezes and the cloud.
VOLUME SPIKES
The cloud will change to a brighter color when a volume spike is detected. When a major volume spike is detected, it will turn very bright colored green/red according to the direction of the cloud. This notifies you of volume spikes so you have a better idea of how strong the trend is. If the cloud is a dark green/red then that means that volume is less than or equal to the recent median volume.
SIGNALS
There are also signals that will be given when the current candle is in the cloud, the candle is going in the same direction as the cloud, the MA #2 and MA #3 is going in the same direction and a volume spike is detected. These help you identify good entries when markets are trending. Be cautious of these signals when the trend is sideways and not clearly moving in one direction. The signals can be turned on or off in the settings.
SQUEEZE
Many times when moving averages squeeze together, a big move happens shortly after. Because of this I added a yellow background color when a squeeze is detected. It looks at the median value difference of the MA #2 and MA #3 and if the current value difference is less than the median multiplied by the multiplier in the settings then it will change the background color to notify you. The default value of the multiplier is .6, meaning the squeeze signal will only show if the current value difference of the cloud is less than .6 of the median difference. The multiplier can be adjusted in the settings to suit your preferences. Lower values will only show tighter squeezes.
MARKETS
This indicator can be used on all markets including stocks, crypto, futures and forex.
TIMEFRAMES
This indicator can be used on all timeframes.
PAIRINGS
We recommend pairing this combined moving average with Trend Friend Swing Trade And Scalp Signals for extra confluence. Look for price to bounce in the cloud with good volume and a confirming signal from Trend Friend for highly probable moves.
Any 8 Moving Averages - Alerts, Clouds & PercentagesANY 8 MOVING AVERAGES WITH ALERTS, COLOR CHANGING CLOUDS AND PERCENTAGE GAPS
This is a fully customizable moving average cloud with alerts. It has 8 moving averages that can be individually set to any type such as: EMA, SMA, HMA, WMA, VWMA & RMA. Each moving average paints green when price is above it and paints red when price is below it. They include colored clouds between the price and each moving average as well.
You can individually change the length, colors, type of moving average and turn them off for those of you that only want a few moving averages on your chart at once.
There is also a percentage gap table that tells you how far away the price is from each moving average which are labeled accordingly.
You can also set alerts for when price crosses each moving average.
***HOW TO USE***
When all the moving averages are green, buy dips down to the next lower moving average. When all the moving averages are red, short the tops up to the next moving average.
Trade in the direction of the trend and wait for all lines to turn one color before taking trades in that direction.
Make sure there is a big enough percentage gap to the next moving average before taking a trade.
***MARKETS***
This indicator can be used as a signal on all markets, including stocks, crypto, futures and forex.
***TIMEFRAMES***
This moving average can be used on all timeframes.
***TIPS***
Try using numerous indicators of ours on your chart so you can instantly see the bullish or bearish trend of multiple indicators in real time without having to analyze the data. Some of our favorites are our Auto Fibonacci, Directional Movement Index + Fisher Price Action, Volume Profile With Buy & Sell Pressure, Auto Support And Resistance and Money Flow Index in combination with this moving average cloud. They all have unique features to help you make better and faster trading decisions.

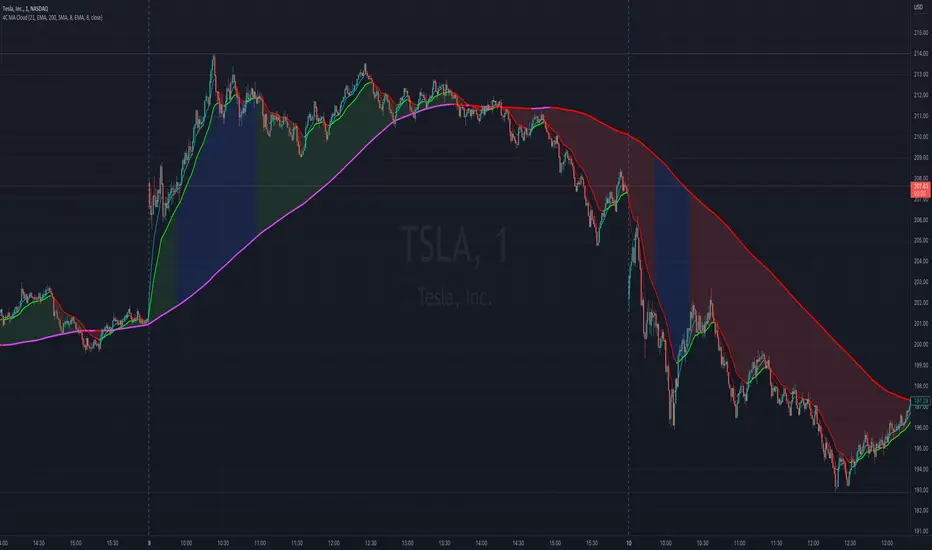
4C Moving Avg CloudThis indicator plots 2 moving averages with a cloud filling the area between the two.
It has the unique ability to choose between multiple moving average types, AND also paints the average based on slope direction, all in one indicator.
Most of the available moving average cloud indictors only allow one type of moving average for both averages together (e.g. 21 EMA with 200 EMA; or 21 SMA with 200 SMA)
The 4C Moving Avg Cloud features the ability to choose a different average type for each of the moving averages, and can be mixed and matched (e.g. 21 EMA with 200 SMA; or 21 RMA with 200 EMA; etc...)
Offers a selection for each of the moving averages to choose between: EMA, SMA, RMA, WMA
Credit: Some aspects of this part of the 4C moving avg cloud indicator were adapted from the "Best Cloud All MA" indicator @author=Daveatt
Another unique aspect of this moving avg cloud indicator is that is paints the moving average lines based on slope direction.
If the slope direction of the avg is up, it is painted one color, and if the avg is sloping down, it is painted another color (default: red).
This slope coloring is based on a 1 period lookback, and cant be adjusted.