Interactive MA Stop Loss [TANHEF]This indicator is "Interactive." Once added to the chart, you need to click the start point for the moving average stoploss. Dragging it afterward will modify its position.
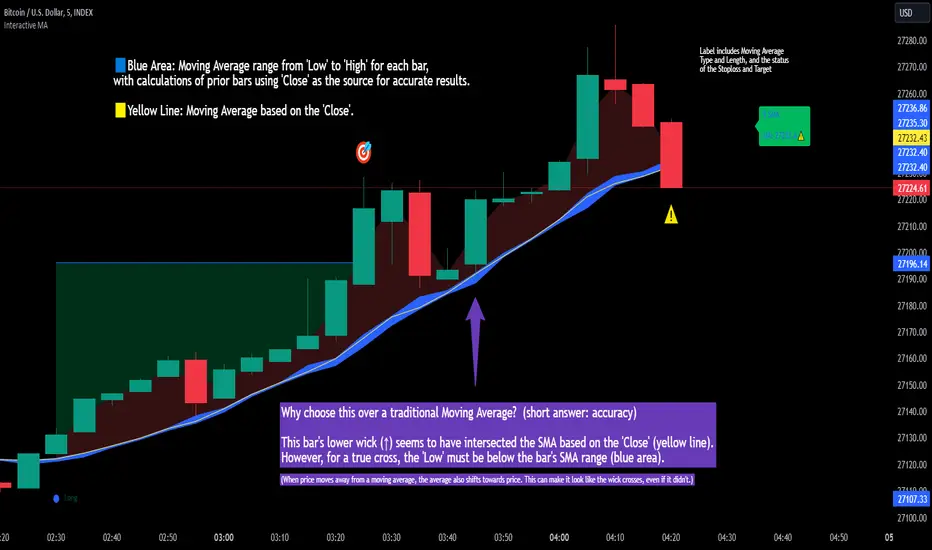
Why choose this indicator over a traditional Moving Average?
To accurately determine that a wick has crossed a moving average, you must examine the moving average's range on that bar (blue area on this indicator) and ensure the wick fully traverses this area.
When the price moves away from a moving average, the average also shifts towards the price. This can make it look like the wick crossed the average, even if it didn't.
How is the moving average area calculated?
For each bar, the moving average calculation is standard, but when the current bar is involved, its high or low is used instead of the close. For precise results, simply setting the source in a typical moving average calculation to 'Low' or 'High' is not sufficient in calculating the moving average area on a current bar.
Moving Average Options:
Simple Moving Average
Exponential Moving Average
Relative Moving Average
Weighted Moving Average
Indicator Explanation
After adding indicator to chart, you must click on a location to begin an entry.
The moving average type can be set and length modified to adjust the stoploss. An optional profit target may be added.
A symbol is display when the stoploss and profit target are hit. If a position is create that is not valid, "Overlapping MA and Bar" is displayed.
Alerts
'Check' alerts to use within indicator settings (stop hit and/or profit target hit).
Select 'Create Alert'
Set the condition to 'Interactive MA''
Select create.
Alert messages can have additional details using these words in between two Curly (Brace) Brackets:
{{stop}} = MA stop-loss (price)
{{upper}} = Upper MA band (price)
{{lower}} = Lower MA band (price)
{{band}} = Lower or Upper stoploss (word)
{{type}} = Long or Short stop-loss (word)
{{stopdistance}} = Stoploss Distance (%)
{{targetdistance}} = Target Distance (%)
{{starttime}} = Start time of stoploss (day:hour:minute)
{{maLength}} = MA Length (input)
{{maType}} = MA Type (input)
{{target}} = Price target (price)
{{trigger}} = Wick or Close Trigger input (input)
{{ticker}} = Ticker of chart (word)
{{exchange}} = Exchange of chart (word)
{{description}} = Description of ticker (words)
{{close}} = Bar close (price)
{{open}} = Bar open (price)
{{high}} = Bar high (price)
{{low}} = Bar low (price)
{{hl2}} = Bar HL2 (price)
{{volume}} = Bar volume (value)
{{time}} = Current time (day:hour:minute)
{{interval}} = Chart timeframe
{{newline}} = New line for text
I will add further moving averages types in the future. If you suggestions post them below.