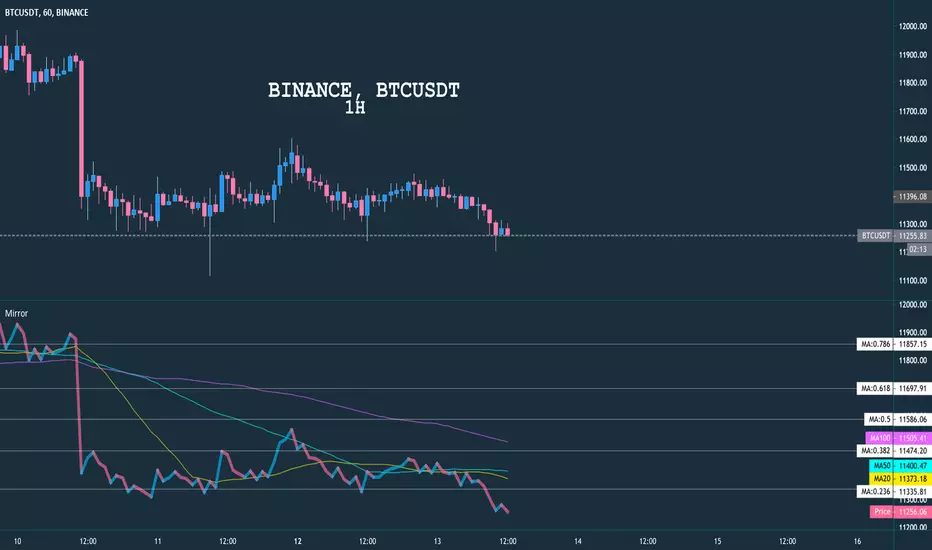
Mirror Chart MultitimeframeDescription
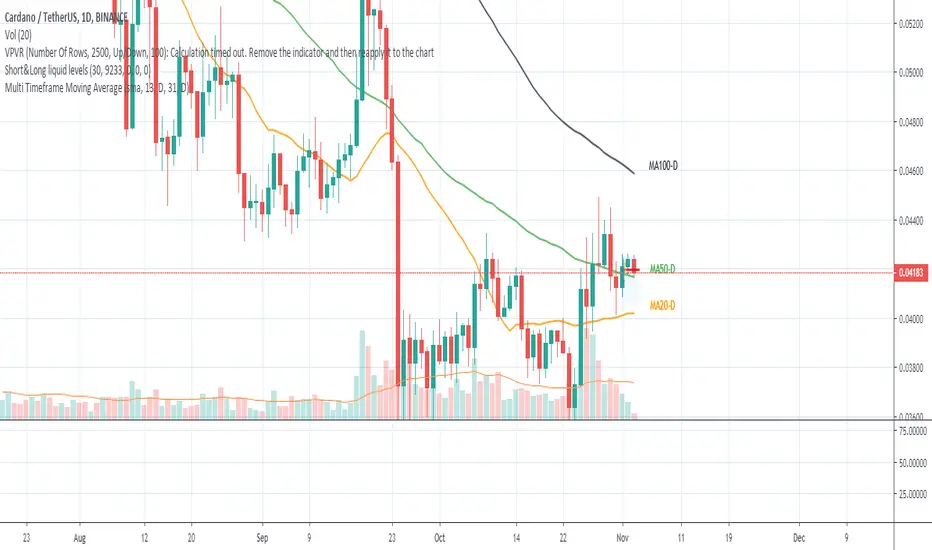
Allow user to display any chart from any timeframe with indicator Moving Average and Auto Fibonacci
Setting
Chart From , please enter your index symbol, example: BINANCE:BTCUSDT or ETHBTC
Timeframe , which time frame to show the chart (no impact with main chart)
MA 20, MA 50, MA 100 , check any MA that you want to display
Fibo Range , enter total candle that will be used for fibo
Show Fibo 0-1 , show fibo line from 0, 0.236 and so on to 1
Example
It shows many charts with different timeframes
Multi-timeframe
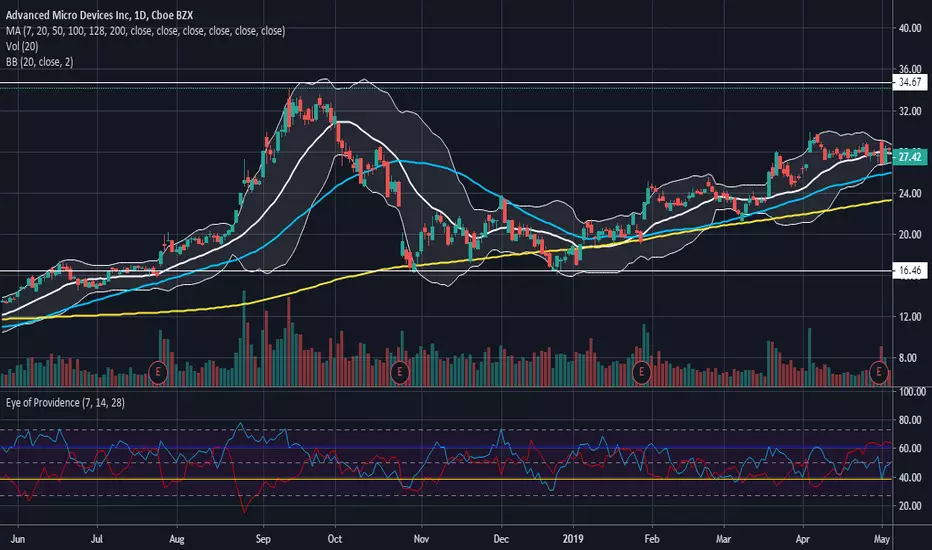
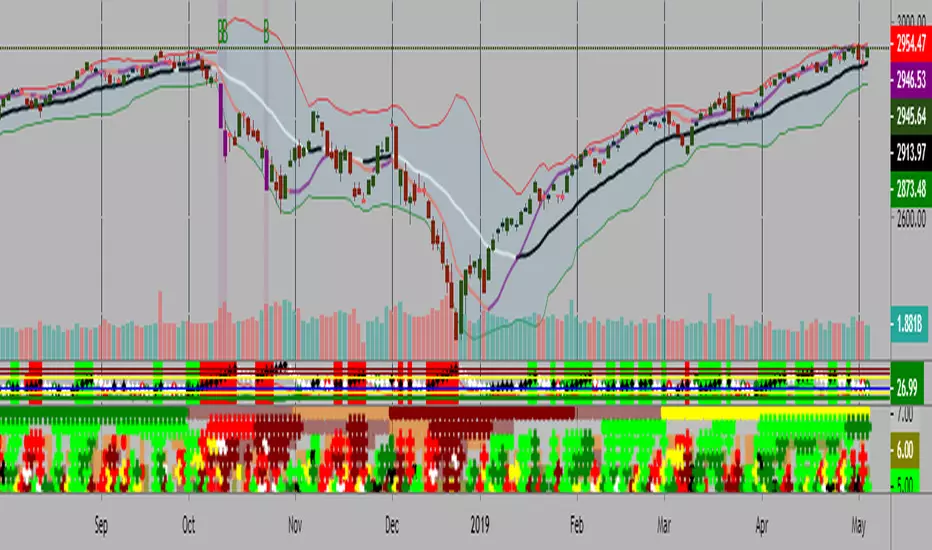
The All Seeing EyeThe All Seeing Eye is the Logarithmic Ultimate Oscillator (marked blue) interposed with a special Choppiness Index I call the "Trend Energy Index" (marked red) that has been averaged over multiple time frames. Key levels are set at the 50 center line, and then 1 and 2 standard deviations from the center line. This oscillator is intended for use in the standard stock market but can very likely be applied to the Forex market as well.
The 50 center line indicates the beginning or end of a trend based on the direction of the cross of the Ultimate Oscillator . Trend Strength is indicated by the position of the Trend Energy Index. Use this oscillator in the same way you would use the Ultimate Oscillator while considering the strength of the trend via the multiple Trend Energy Index. Entry and exit points are identified when the Trend Energy Index is in a trending state or spikes sharply downwards from an energy level near 61.8 and higher than 50. When the Trend Energy Index crosses above the 50 center line, it indicates the trend has ended. When it crosses below the 50 center line, it indicates a trend is beginning. Sharp changes in the direction of the Trend Energy Index at the 1 and 2 standard deviation key levels are usually accompanied by the same reaction from the Ultimate Oscillator indicating the trend may be entering a pullback or consolidation period. The Ultimate Oscillator will tell you the likely direction of the trend based on its slope between time intervals, as well as its position being above or below 50. Again, use the Ultimate Oscillator as you would RSI . Overbought and Oversold levels are indicated at the 2 standard deviation levels from the center line in relation to the Ultimate Oscillator . These levels are 27.2 for oversold and 72.8 for overbought.
The power of this oscillator comes from the reactivity of the Trend Energy Index in alerting you of trend strengthening or weakening of the predominant trend indicated by the Ultimate Oscillator . Pairing these two together produces great accuracy in Identifying reversals, exit points, and entry points. Additionally, the Ultimate Oscillator gives much less false divergence readings than standard RSI , and pairing with the ability of the Trend Energy Index to identify trend strength on any time frame allows great versatility while maintaining accuracy.
Because of the nature of this oscillators design, it is suited for use under any time frame and any volatility level. However, I personally have found it to be most accurate under low to medium-high volatility levels in a weekly time frame or shorter. Accuracy begins to be lost once the time frames are monthly or higher. It is recommended to use this oscillator with a volume indicator and a secondary momentum indicator such as MACD to verify signals from the All Seeing Eye for the highest degree of accuracy to be achieved.
Easy to read and notable trend states to get you started:
Blue line above 50 and red line below 50 = Uptrend
Both blue line and red line below 50 = Downtrend
Blue line 2 standard deviations above 50 and red line 2 standard deviations below 50 = Strong uptrend
Both blue line and red line 2 standard deviations below 50 = Strong downtrend
Red line at 1 standard deviation below 50 = weak trend
Red line at 2 standard deviations below 50 = strong trend
Red line at 1 standard deviation above 50 = consolidation phase (very weak or no trend)
Red line at 2 standard deviations above 50 = dead in the water (no trend at all)
My #1 tip: Pay close attention to the slopes of both lines in this oscillator and their relationship to each other!

Multi Timeframe RSI
This indicator will populate an RSI chart for multiple timeframes on the same chart.
Current Timeframe
15-min
1-hr
4-hr
1D
The point is to more easily see when things are getting oversold or overbought across multiple timeframes at the same time. To help with that, the background will also color green if all your selected timeframes are oversold and red if all your selected timeframes are overbought.
Note: It will only display and use the background colors on your current timeframe and timeframes larger than the current timeframe. So if you are looking at the 4-hr, the 15-min and 1-hr are ignored.

Dollar Cost Average (Data Window Edition)Hi everyone
Hope you had a nice weekend and you're all excited for the week to come. At least I am (thanks to a few coffee but that still counts !!!)
This indicator is inspired from Dollar-Cost-Average-Cost-Basis
EDUCATIONAL POST
The educational post is coming a bit later this afternoon explaining how to use the indicator so I would advise to follow me so that you'll get updated in real-time :) (shameless self-advertising)
1 - What is Dollar-Cost Averaging (DCA)?
Dollar-Cost Averaging is a strategy that allows an investor to buy the same dollar amount of an investment on regular intervals. The purchases occur regardless of the asset's price.
I hope you're hungry because that one is a biggie and gave me a few headaches. Happy that it's getting out of my way finally and I can offer it
This indicator will analyse for the defined date range, how a dollar cost average (DCA) method would have performed vs investing all the hard earnt money at the beginning
2- What's on the menu today ?
Please check this screenshot to understand what you're supposed to see : CLICK ME I'M A SCREENSHOT (I'll repeat this URL one more time below as I noticed some don't read the information on my description and then will come pinging me saying "sir me no understand your indicator, itz buggy sir"
(yes I finally thought about a way to share screenshots on TradingView, took me 4 weeks, I'm slow to understand things apparently)
My indicator works with all asset classes and with the daily/weekly/monthly timeframes
As always, let's review quickly the different fields so that you'll understand how to use it (and I won't get spammed with questions in DM ^^)
- Use current resolution : if checked will use the resolution of the chart
- Timeframe used for DCA : different timeframe to be used if Use current resolution is unchecked
- Amount invested in your local currency : The amount in Fiat money that will be invested at each period selected above
- Starting Date
- Ending Date
- Select a candle level for the desired timeframe : If you want to use the open or close of the selected period above. Might make a diffence when the timeframe is weekly or monthly
3 - Specifications used
I got the idea from this website dcabtc.com and the result shown by this website and my indicator are very interesting in general and for your own trading
The formula used for the DCA calculation is that one : Investopedia Dollar Cost Average
4 - How to interpret the results
"But sir which results ??"...... those ones : CLICK ME I'M A SCREENSHOT :) (strike #2 with the screenshot)
It will draw all the plots and will give you some nice data to analyze in the Data Window section of TradingView
I'm not completely satisfied with the tool yet but the results are very closed to the dcabtc website mentioned above
If you're trading a very bullish asset class (who said crypto ?), it's very interesting to see what a DCA strategy could bring in term of performance. But DCA is not magic, there is a time component which is the day/week/month you'll start to invest (those who invested in crypto beginning of 2018 in altcoins know what I'm talking about and ..............will hate me for this joke)
5 - What's next ?
As said, the educational post is coming next but not only.
Will probably post a strategy tomorrow using this indicator so that you can compare what's performing best between your trading and a dollar cost average method
I'll publish as a protected source this time a more advanced version of that one including DCA forecasts
6 - Suggested alternative (but I'll you doing it)
If you don't want to have this panel in the bottom with the plots and analyze the results in the data window, you can always create an infopanel like shown here Risk-Reward-InfoPanel/ and display all the data there
Hope you'll like it, like me, love it, love me, tip me :)
____________________________________________________________
Feel free to hit the thumbs up as it shows me that I'm not doing this for nothing and will motivate to deliver more quality content in the future. (Meaning... a few likes only = no indicators = Dave enjoying the beach)
- I'm an offically approved PineEditor/LUA/MT4 approved mentor on codementor. You can request a coaching with me if you want and I'll teach you how to build kick-ass indicators and strategies
Jump on a 1 to 1 coaching with me
- You can also hire for a custom dev of your indicator/strategy/bot/chrome extension/python

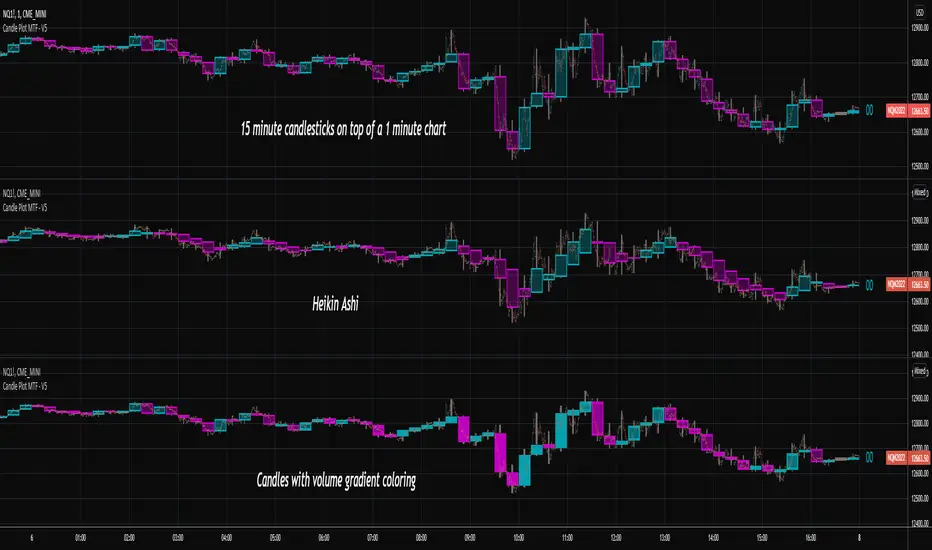
Candlestick Plot MTFPlots the live non-repainting candles for a higher time interval than the chart interval.
Features:
Configuration of the look and feel of the MTF candles.
Live candles update as the price action evolves for the session.
Historical candles can be toggled on/off.
Includes a moving average ribbon that is also MTF, matching the interval chosen.
Please watch this video to understand more:
Multi Timeframe Moving Average Collection | Swing [aamonkey]This is a Multi Timeframe Moving Average Collection (Swing Edition).
Why use it?
- Spot cluster of MAs on one chart
- See support and resistance
- Spot "freefall zones"
In the default settings you will get:
20, 100 and 200 MA of the 1D, W, and the W chart.
The color indicates significance!
From weaker to stronger support/resistance:
green(1D),yellow(W),red(M)
- Length of the MAs is modifiable
- Timeframes of the MAs is modifiable
- Which MAs you want to see
- Colors
Why use this if there is a Swing edition, that can do the same?
You can use this Swing Edition if you don't want to change between the Swing and Scalp timeframes in the settings.
Just turn on of the two on or off.

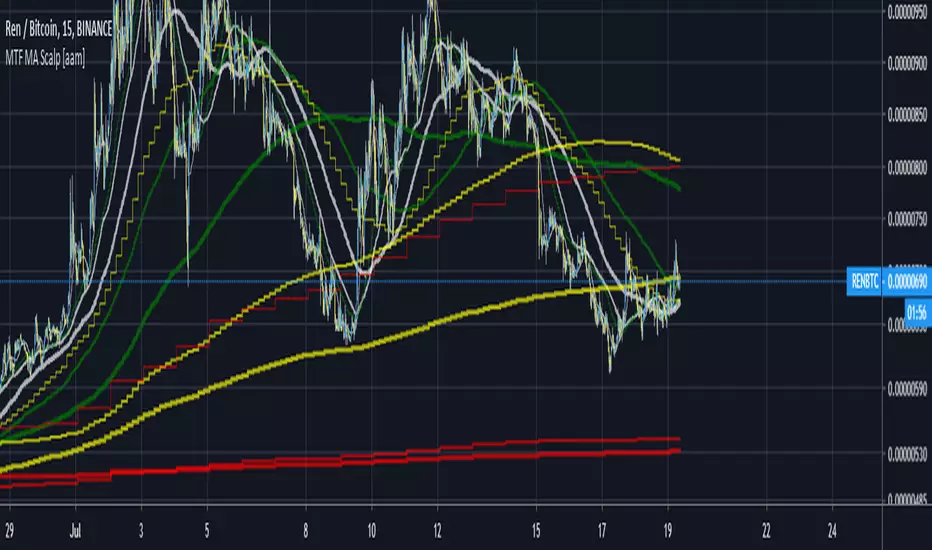
Multi Timeframe Moving Average Collection | Scalp [aamonkey]This is a Multi Timeframe Moving Average Collection (Scalp Edition).
Why use it?
- Spot cluster of MAs on one chart
- See support and resistance
- Spot "freefall zones"
In the default settings you will get:
20, 100 and 200 MA of the 15min, 1h, 4h, and the 1D chart.
The color indicates significance!
From weaker to stronger support/resistance:
white(15min), green(1h),yellow(4h),red(1D)
- Length of the MAs is modifiable
- Timeframes of the MAs is modifiable
- Which MAs you want to see
- Colors
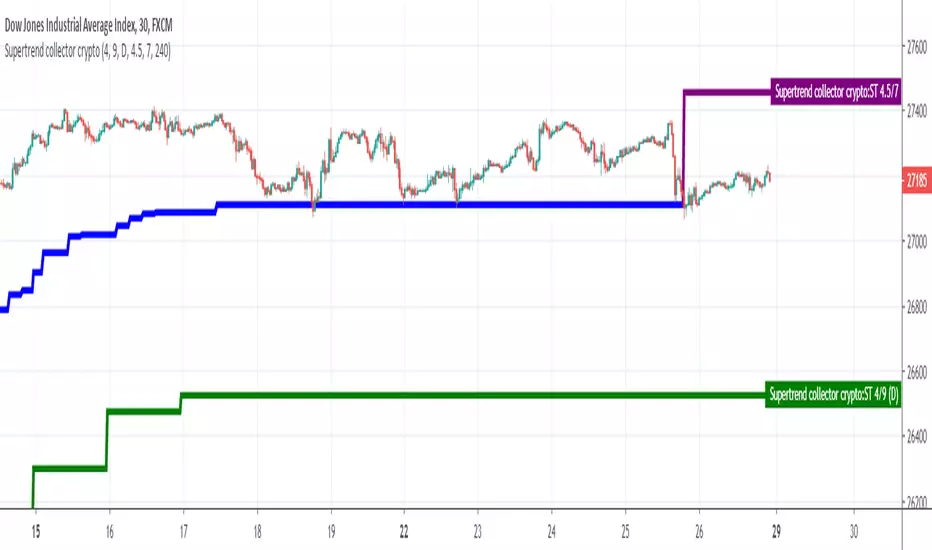
Supertrend collectorHello traders
This is an example of how you can add multiple indicators into a unique one
In this instance, I added two supertrend multitimeframes and draw them on a different timeframe chart
Enjoy
David
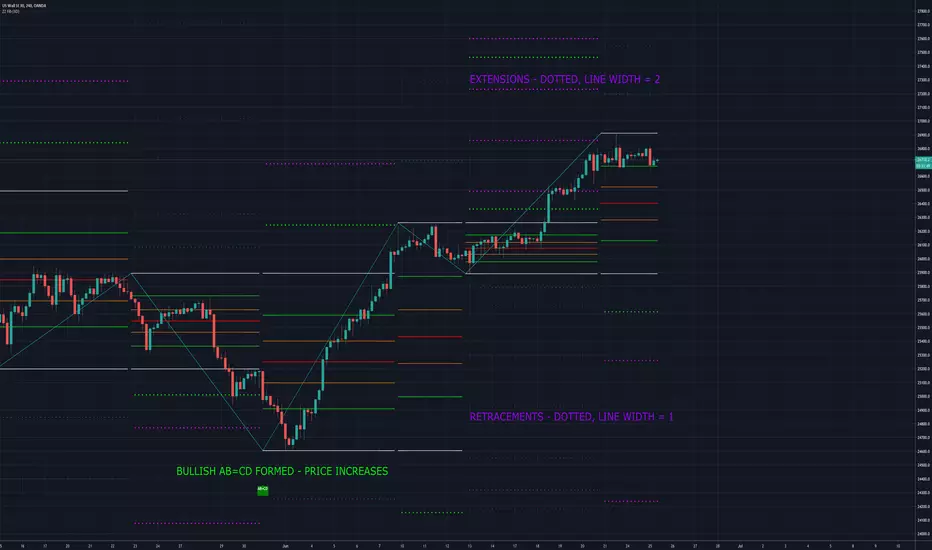
MoT - ZigZag Fibonacci w/Extensions + Chart Pattern RecognitionOne of my favourite indicators we have created over an extremely creative weekend while also watching Bitcoin keep pushing on! The Indicator plots ZigZags and then overlays Fibonacci Levels (With Extensions). I have also programmed the indicator to search for Bullish/Bearish chart patterns in the form of ABC's, ABCD's, 3 Drives, BAT etc etc. This evening we have also added multiple time frame (MTF) options.
Flunki Multi timeframe MTF VWAPsMultiple Timeframe VWAP plots.
Seven of them.
With colour flips and plot horizontal options.
Possibly more VWAP than you need... but you have an on / off option for each.
Enjoy.
Add me on Twitter @flunkimoku or find me in the OneX discord..

[feeble] TrenderEver wondered which way the price is trending??!
feeble Trender BETA™ shows the trend based on middle crossings in different timeframes, volume weighting and volatility(std Deviations)
--The indicator displays the same on any timeframe
--Select a FROM and TO period
--Use DuPLiCaToR to make 12 copies - use values between 0.8-1.2
--Coloured bands go purple when price is below the volume-weighted mIdBaNd!

Multi Time Moving Averageпозволяет выбрать в настройках 2 таймфрейма и 4 МА с разными периодами и отображать выбранные индикаторы на графиках с любым выбранным таймфреймом
Multi-TF Avg BBandsMULTI-TF AVERAGE BBANDS - with signals (BETA)
Overall, it shows where the price has support and resistance, when it's breaking through, and when its relatively low/high based on the magic of standard deviation.
created by gamazama. send me a shout if u find this useful, or if you create something cool with it.
%BB: The price's position in the boilinger band is converted to a range from 0-1. The midpoint is at 0.5
Description of parameters
"BB:Window Length" is the standard BB size of 20 candles.
The indicator plots up to 7 different %BB's on different timescales
They are calculated independently of the timescale you are viewing eg 12h, 3d, 30m will be the same output
You can enter 7 timescales, eg. if you want to plot a range of bbands of the 12h up to 3d graphs, enter values between 0.5 and 3 (days) - you can also select 0 to disable and use less timescales, or select hours or minutes
Take note if you eg. double the main multiplier to 40, it is the same as doubling all your timescales
You can turn the transparency of the 7 x %BB's to 100 to hide them, their average is plotted as a thick cyan line
"Variance" is a measure of how much the 7 BB's agree, and changes colour based on the thresholds used for the strategy
---- TO START FROM SCRATCH ----
- set all except one to ZERO (0), set to 0, and everything after to 0.
Turn ON and right click -> move the indicator to a new pane - this will show you the internal workings of the indicator.
Then there is a few standard settings
"Source Smoothing Amount" applies a basic small sma on the price.
It should be turned down when viewing candles with less information, like 1D or more.
Standard BBands use an SMA, there one uses a blend between VWMA or SMA
Volume Weight settings, the same as SMA at 0, and the same as VWMA at 1
BB^2 is a bband drawn around the average %BB. Adjust the to change its window length
The BB^2 changes color when price moves up or down
Now its time to look at the parameters which affect the buy/sell signals
turn on "show signal range" - you see some red lines
buy and sell each have 4 settings
min/max variance will affect the brigtness of the signal range
range adjust will move the range up/down
mix BB^2 blends between a straight line (0) and BB^2's top or bottom (1)
a threshold of "variance" and "h/l points" is available to generate weaker signals.
these thresholds can be increased to show more weak signals
ONCE YOU ARE HAPPY WITH THE SIGNALS being generated, you can turn OFF , and move it back to the price pane
the indicator then draws a bband around the price to maps some info into the chart:
fills a colour between 0.5 & the mid BB^2 and converts relative to the price chart
draws a line in the middle of the midband.
controls how much these lines diverge from the price - adjust it to reduce noise
converts the signal range (red lines) to be relative to the price chart
if you like, you can adjust the sell & buy signals in the tab from and to and to match the picture. It messes with auto-scaling when moving back to though
enjoy, I hope that is easy enough to understand, still trying to make this more user-friendly.
If you want to send me some token of appreciation - btc: 33c2oiCW8Fnsy41Y8z2jAPzY8trnqr5cFu
I promise it will put a fat smile on my face

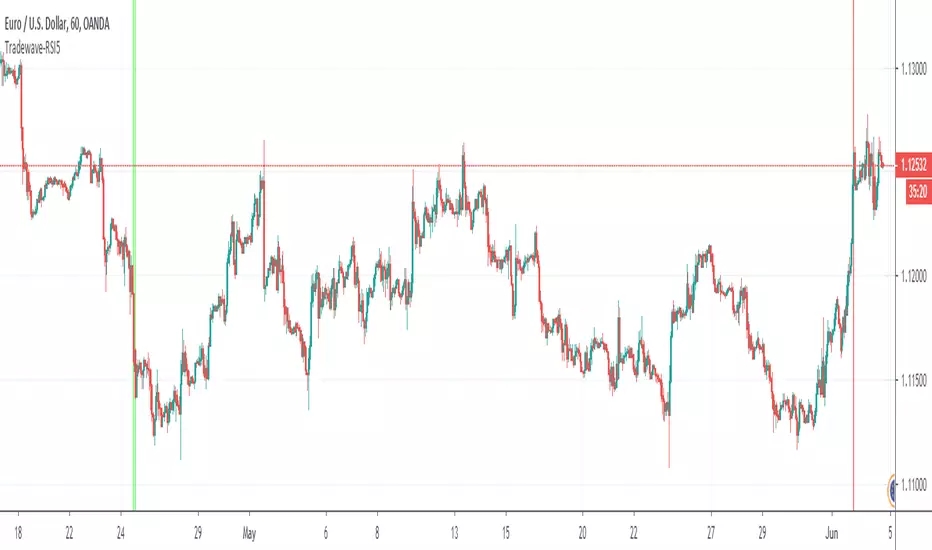
Tradewave-RSI5Calculates the Multi Time Frame RSI Overbought Oversold Conditions.
- Draws a vertical green line when RSI is oversold across 5 time frames of your choice
- Draws a vertical red line when RSI is overbought across 5 time frames of your choice.
Time frames can be modified in indicator settings.
MFI LizardMFI with auto identification of divergence, multi timeframe support and centre line.
Work In Progress

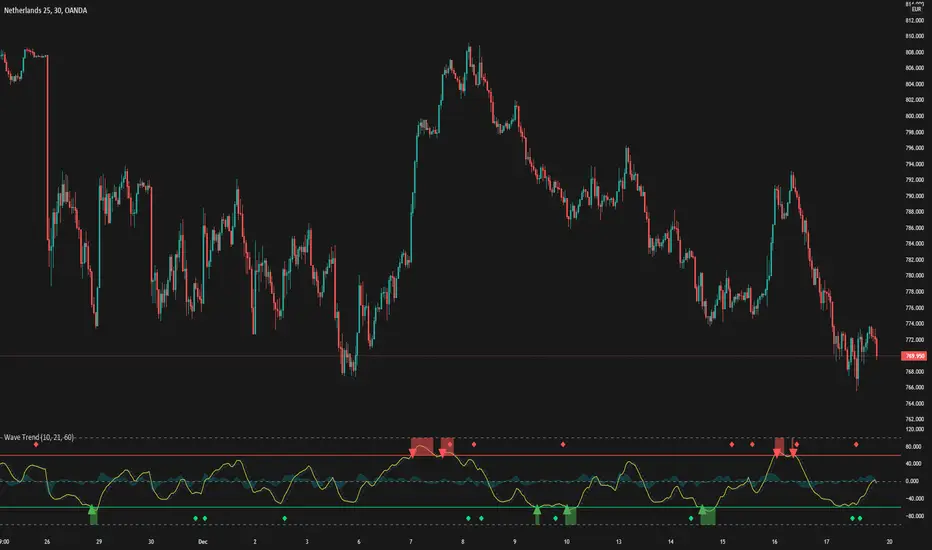
WaveTrendThis is a trend Analysis indicator request by Taleeto
To fully use this script, you will need a security key from him.
It alerts you when to buy or sell based on the market conditions
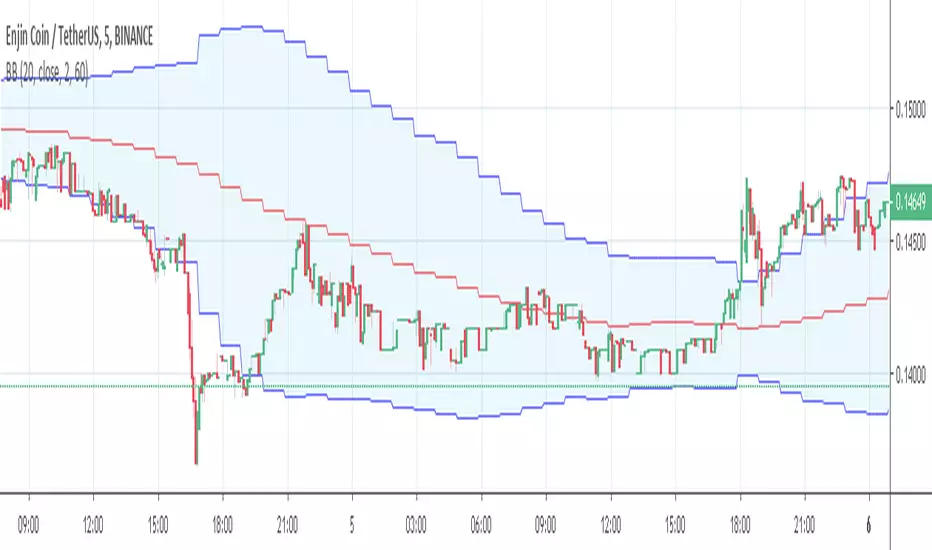
Bollinger Bands Multi Time FrameThis script is for using Bollinger Bands at different time frames. I usually use it at 5m chart while Bollinger Bands at 1 hour resolution.
Kal’s MTF ADX Rangoli RollerKaly MTF ADX Rangoli Roller is a method/study for finding trending stocks, indexes and cryptocurrencies using two different data periods (10, 5) of ADX Overlap over different time-frames (10m, 1H, 4H, 1D, 1W, 1M). In the study, I used 5-Period ADX for all mentioned time-frames. You may use 10-Period ADX for lower time-frames especially 10m and 1H.
Sample Image of the pinescript code(at the end of this post) in Tradingview looks as follows:
Note: Kal's MTF ADX Rangoli Roller is the lower Plot. The upper plot is KAL’s ADX Overlap Technical Study with MACD Filter( )
Description:
----------------
In the study plot, the lowest row is 10m, row above is 1H, row above is 4H, then 1D, then 1W and highest row is 1M
Lime(Bright Green) dot implies Trending Uptrend for that time-frame (first phase)
Green dot implies Trending Uptrend for that time-frame (second phase near exhaustion)
Red dot implies Trending Downward for that time-frame (first phase)
Maroon dot implies Trending Downward for that time-frame (second phase near exhaustion)
Lime cross implies Strong Trending Uptrend for that time-frame (first phase)
Green cross implies Strong Trending Uptrend for that time-frame (second phase near exhaustion)
Red cross implies Trending Strong Downward for that time-frame (first phase)
Maroon cross implies Trending Strong Downward for that time-frame (second phase near exhaustion)
Yellow is ‘Squeeze On’ setting. During the squeeze period, the ADX signals are almost always ineffective. One may wait and watch over during this time. Once the Squeeze is released (i.e. no longer yellow), the trend corresponds to the color of the dots and crosses.
Black is CRSI Overbought condition for that time-frame. It’s best to wait and research for possibility of trend reversal because
1. Profit-booking/trimming happens after CRSI Overbought condition.
2. Large Short-sellers may take huge positions during this time pushing the stock prices up.
White is CRSI Oversold condition for that time-frame. It’s best to wait and research for possibility of trend reversal because
1. Profit-booking/trimming happens after CRSI Oversold conditions.
2. Large buyers may take huge positions during this time pushing the stock prices down.
I am a disabled man. Therefore, I am not able to write in detail here today. More Details will follow as time permits. Please let me know if I am missing anything…
Legal Disclaimer: I published here so I get replies from fellow viewers to educate myself and for my daily expenses. Hence, if anyone uses this script for making their decisions, I am not responsible for any failures incurred.
Safe Trading!
Kal Gandikota
PS: If you found this script interesting and edifying please follow and upvote.
PS2: Please kindly donate for my daily expenses (atleast as you would on streets) at the following addresses:
BTC Wallet: 1NeDC1GvpFa49DFLuT1v28ohFjqtoWXNQ5
ETH Wallet: 0x35e557F39A998e7d35dD27c6720C3553e1c65053
NEO Wallet: AUdiNJDW7boeUyYYNhX86p2T8eWwuELSGr
PS3: For more information on ADX and CRSI, please 'Google' or search here yourself.
PS4: This study is intended for research in creating automated Python Trading Systems using Pandas( steemit.com ).
Screenshots of the pinescript code looks as follows:
10minute Screenshot of Kal's MTF ADX Rangoli Roller (Above)
1 Hour Screenshot of Kal's MTF ADX Rangoli Roller (Above)
4 Hour Screenshot of Kal's MTF ADX Rangoli Roller (Above)
1 Day Screenshot of Kal's MTF ADX Rangoli Roller (Above)
1 Week Screenshot of Kal's MTF ADX Rangoli Roller (Above)
1 Month Screenshot of Kal's MTF ADX Rangoli Roller (Above)
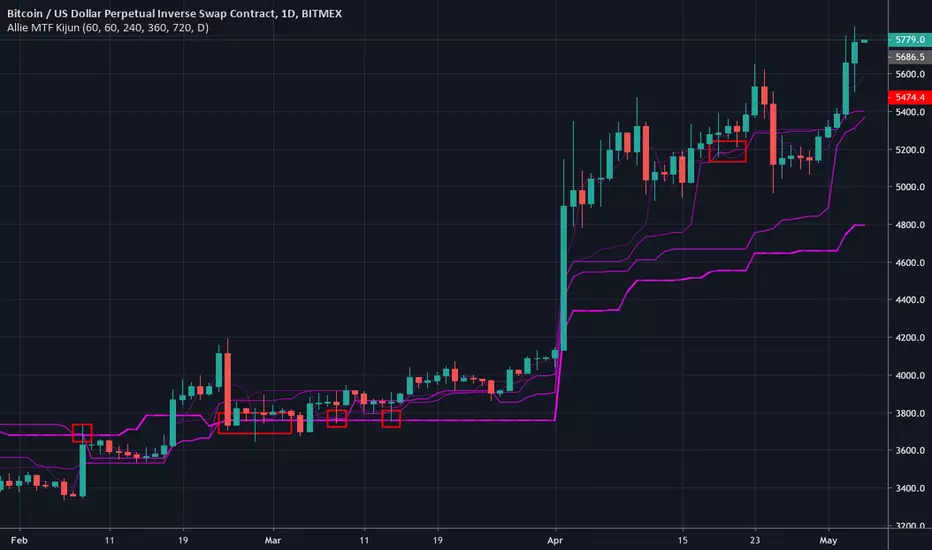
Allie MTF KijunMulti-timeframe kijun. The current timeframe's kijun is represented with dashed line.
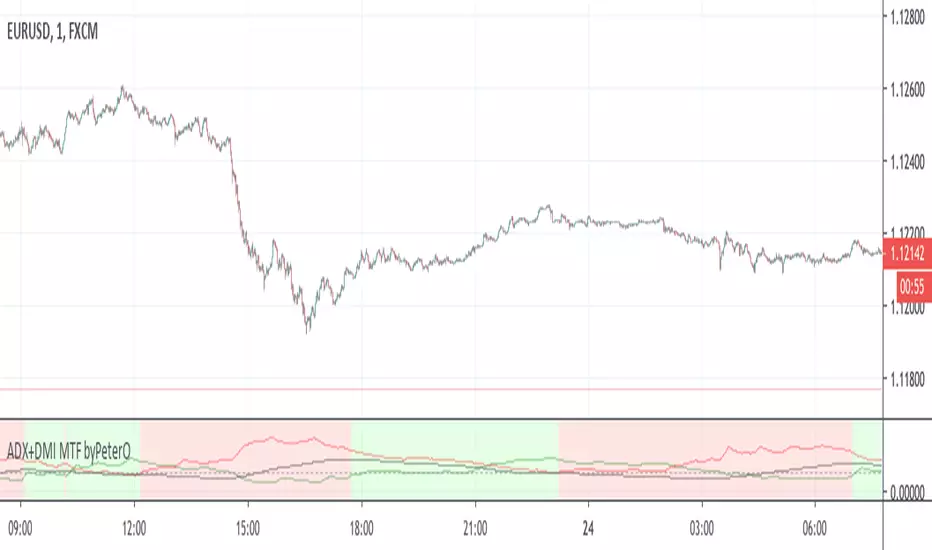
ADX+DMI MTF byPeterOThe goal of this study was to use ADX from Higher Timeframe - to determine trend direction
Why? Because ADX is very sensitive, able to show trend ending without any delay, but not in the middle of it.
Being able to see such immediate trend change on higher timeframe, is a great indicator of trend direction.
Adding just security() calls to 'highest', 'lowest' and 'close' didn't seem right, because it produced some ugly ADX, D+ and D- plotlines.
I wanted to see plotlines, which look exactly like those on actual higher timeframe. Therefore I modified the calculations.
You can read more about my take on (not) using security() calls in my other source code indicator RSI MTF: link in comments.
On top of all that, I added interpretation of DMI readings, because it is not as simple as plus>minus + ADXrising = uptrend.
So GREEN background means higher timeframe uptrend and RED background means downtrend.
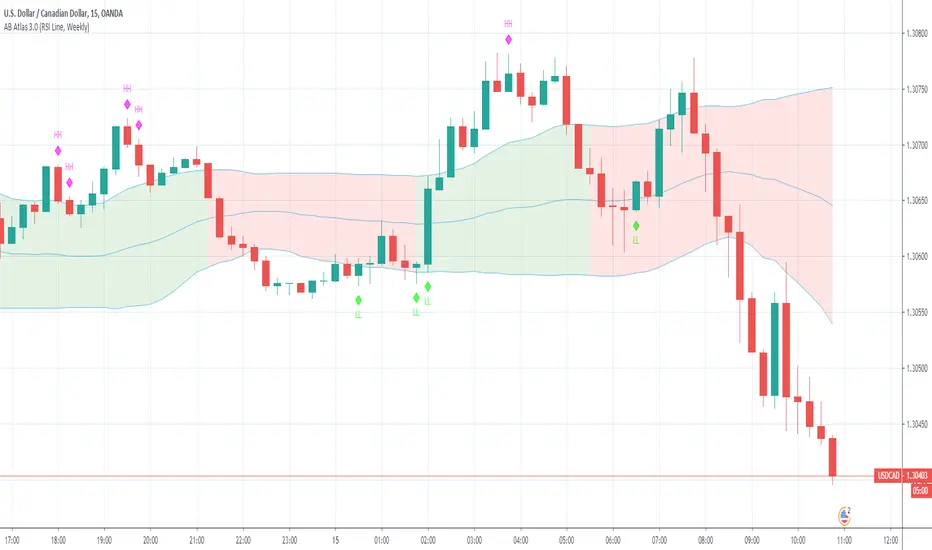
AB Atlas
Arbitrage Band Indicators - Included In The Indicator
Recent Higher High - Yellow Circle
Longer Term Higher High - Black Circle (Above Candle) (with Alerts)
Longer Term Lower Low - Black Circle (Below Candle) (with Alerts)
Buy Trend Exhausted - Red Circles ( Above Candles)
Sell Trend Exhausted - Green Circles ( Below Candles)
Tick colors have been added to the Bands to eliminate any question of the type of trend that is currently in progress
Red Atlas Band - Sell trend in progress
Green Atlas Band Buy Trend in progress
Enjoy,
Arbitrage Trade
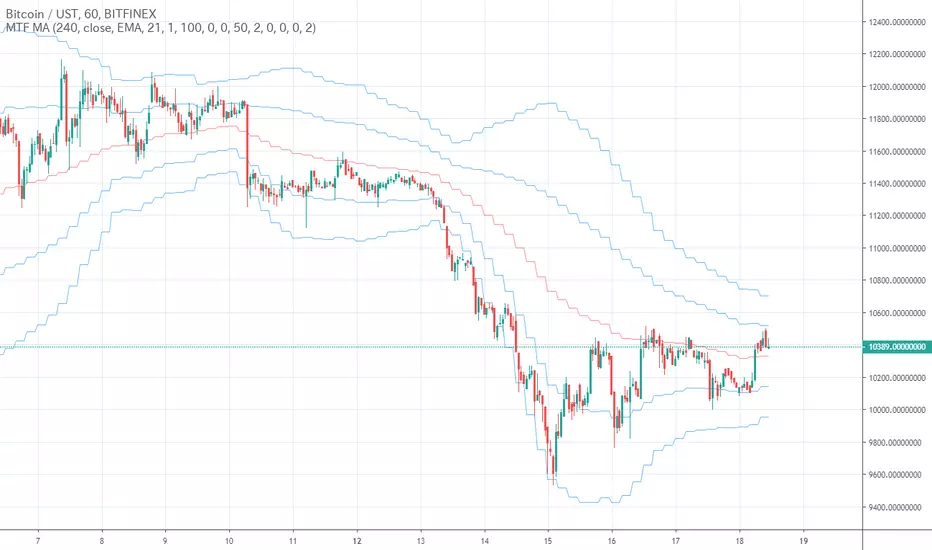
MTF MAIt is just a simple MTF MA.
The types of moving averages that can be selected have been increased considerably
ただのシンプルなMTF MAです。
選択できる移動平均の種類はかなり増やしておきました