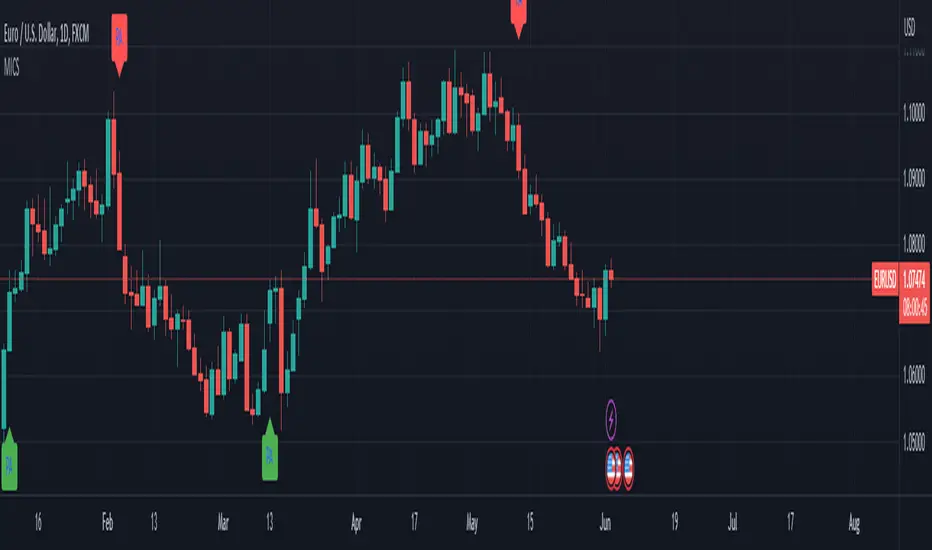
Multi-Indicator Confluence Signals (MICS) - Complete!Now with adjustable settings!
Description:
The Multi-Indicator Confluence Signals (MICS) is a comprehensive trading tool designed to simplify the process of analyzing multiple technical indicators and uncluttering your screen!
You are able to select various pre-existing indicators, including Stochastic, RSI, MACD, EMA, DMI, Bollinger Band and a our very own custom signal we created using only price action calculations which will provide a streamlined view of the market, allowing traders to focus on speed, trade execution, strategy, and chart reading.
We do this by converting the input from the above popular technical indicators and generate clear long and short signals by placing green(long) and/or red(short) arrows directly on the chart.
You have the option to choose which indicators you want to show on the screen and also the option to choose long and/or short signals and it even comes with the option to adjust the settings of each respective pre-existing indicator to your liking, even our very own price action signal!
Example of the settings you can adjust + many more.
Unclutter your screen by going from this image ...(Imagine your own drawings+the above indicators):
To this! (Only long signals displayed in the picture)
Features:
Consolidated signals:
The MICS identifies bull and bearish signals from multiple indicators and presents them in a visual arrow pointing manner, enabling traders to quickly assess potential trade opportunities.
Unique price action signals:
The price action arrows in the MICS trading tool are a unique feature that distinguish it from traditional technical indicators.
These arrows are generated solely based on recent price movement and are calculated using an algorithm that analyzes the strength of recent price action.
The algorithm also considers factors such as the length and intensity of the trend, as well as any notable support or resistance levels.
When the 'Price Action Long' or 'Price Action Short' options are enabled, the MICS will display green or red arrows respectively, indicating potential bullish or bearish signals.
These arrows complement the signals generated by other pre-existing technical indicators in the MICS .
Clutter-free charting:
By removing the need to display individual indicators on the chart, the MICS helps create a cleaner workspace, promoting better focus and decision-making.
Confluence-based trading:
The MICS is not designed to be used as a standalone trading system.
Instead, traders should utilize the signals as confluences to complement their pre-existing trade ideas, leading to more robust and well-informed strategies.
Mashup of Indicators:
Each indicator has its own strengths and weaknesses, but by combining them, the MICS can provide a more comprehensive view of the market.
For example, Stochastic and RSI are commonly used to measure overbought and oversold conditions, while MACD and EMA are used to identify trend direction. DMI, on the other hand, is used to gauge the strength of a trend, while Bollinger Bands can be used to identify potential breakouts.
By combining the signals from these indicators, the MICS can provide traders with a more nuanced view of the market, allowing them to make better-informed trading decisions, quickly!
How They Work Together:
The MICS generates signals by analyzing the input from each individual indicator.
If the indicators show a bullish trend, the MICS will display this by showing the indicators you selected in the settings with green long arrows, indicating a potential long trade.
Conversely, if the indicators show a bearish trend, the MICS will display red short arrows, indicating a potential short trade.
In addition, the MICS uses a unique price action signal generated solely based on recent price movement, calculated using an algorithm that analyzes the strength of recent price action.
This price action signal is a distinguishing feature of the MICS and complements the signals generated by the pre-existing technical indicators.
What Makes the MICS Original?
What makes the MICS unique is its emphasis on providing a clutter-free charting experience.
By displaying only clear long and short signals directly on the chart based on your own selection in the settings, the MICS eliminates the need to have multiple indicators cluttering the screen, allowing traders to concentrate on making informed decisions, quickly!
This price action signal is a also unique feature that sets the MICS apart from other technical indicators.
Multi
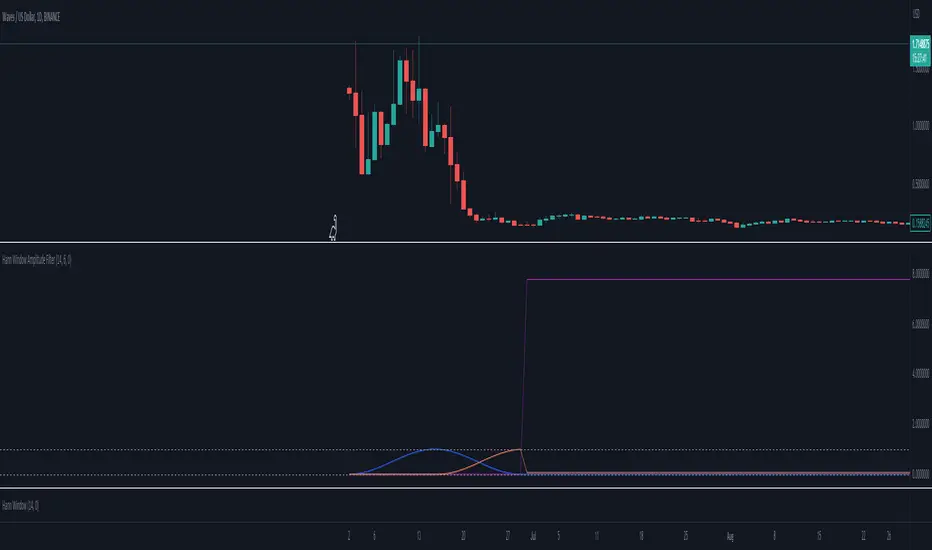
Hann Window Amplitude FilterThis script is designed to implement a multi-signal Hann filter, which is essentially a movable Hann window filter. The purpose of this filter is to allow users to select the periods or frequencies that best align with their trading strategy or market analysis.
The Hann window filter operates by enabling the selection of either lower or higher frequencies. The period of the window is twice the number of signals you wish to filter. As you shift the window by the number of your signals, the signal on one side will have an amplitude of 0, while the other side will have an amplitude of 1.
Continuing to shift the window will result in new values of 0. This feature is particularly useful for further filtering the frequencies or periods that you want to focus on for your trading decisions.
In summary, this script provides a flexible and customizable tool for filtering signals based on their frequency or period, which can be a valuable addition to any trader's technical analysis toolkit.
Price Action (ValueRay)With this indicator, you gain access to up to 5 moving averages from a selection of 15 different types. This flexibility allows you to customize your trading strategy based on your preferences and market conditions. Whether you're a fan of simple moving averages, exponential moving averages, or weighted moving averages, our indicator has got you covered! Additionally, all the MAs are Multi-Time-Frame!
The indicator also provides trading signals. By analyzing market trends and price movements, it generates accurate buy and sell signals, providing you with clear entry and exit points. You can choose between Fast, Mid, and Slow signal speeds.
Trendlines are another crucial aspect of effective trading, and our indicator seamlessly integrates them, helping you visualize the market's direction.
Furthermore, the indicator empowers you with recent highs and lows. By highlighting these key levels, it becomes easier than ever to spot support and resistance areas, aiding you in making well-informed trading choices.
Additionally, you can switch the ADR% (Average Daily Range as a Percentage) on and off. This number instantly provides you with information on how much the stock usually moves per day as a percentage.
Key Features:
Up to 5 Moving Averages, each with its own timeframe.
SMA, EMA, WMA, RMA, Triangular, Volume Weighted, Elastic Volume Weighted, Least Squares, ZLEMA, Hull, Double EMA, Triple EMA, T3, ALMA, KAMA (more to come in future versions).
Recent High and Low Pivot Points acting as support/resistance.
Trendline indicating the current trend.
Buy/Sell Signals (recommended for use as exit points, stop loss, or take profit levels).
Signals can have three different speeds: Fast, Mid, and Slow. You can switch them anytime depending on how quickly or slowly you want to exit a trade.
The predefined colors are best suited for a dark background, and the predefined settings provide a solid starting point that many traders use in their daily work.
Unlock the full potential of your trading strategy with our comprehensive indicator and start making informed trading decisions today!

Moving Averages + BB & R.VWAP StDev (multi-tf)█ Moving Averages + Bollinger Bands and Rolling Volume Weighted Average Price with Standard Deviation Bands (Multi Timeframe)
Multiple moving averages can be independently applied.
The length , type and timeframe of each moving average are configurable .
The lines and colors are customizable too.
This script can display:
Moving Averages
Bollinger Bands
Rolling VWAP and Standard Deviation Bands
Types of Moving Averages:
Simple Moving Average (SMA)
Exponential Moving Average (EMA)
Smoothed Moving Average (SMMA)
Weighted Moving Average (WMA)
Volume Weighted Moving Average (VWMA)
Least Squares Moving Average (LSMA)
Hull Moving Average (HMA)
Arnaud Legoux Moving Average (ALMA)
█ Moving Average
Moving Averages are price based, lagging (or reactive) indicators that display the average price of a security over a set period of time.
A Moving Average is a good way to gauge momentum as well as to confirm trends, and define areas of support and resistance.
█ Bollinger Bands
Bollinger Bands consist of a band of three lines which are plotted in relation to security prices.
The line in the middle is usually a Simple Moving Average (SMA) set to a period of 20 days (the type of trend line and period can be changed by the trader, a 20 day moving average is by far the most popular).
The SMA then serves as a base for the Upper and Lower Bands which are used as a way to measure volatility by observing the relationship between the Bands and price.
█ Rolling VWAP
The typical VWAP is designed to be used on intraday charts, as it resets at the beginning of the day.
Such VWAPs cannot be used on daily, weekly or monthly charts. Instead, this rolling VWAP uses a time period that automatically adjusts to the chart's timeframe.
You can thus use the rolling VWAP on any chart that includes volume information in its data feed.
Because the rolling VWAP uses a moving window, it does not exhibit the jumpiness of VWAP plots that reset.
Based on the previous script :

Market Dynamics Pro [ChartPrime]ChartPrime Market Dynamics Pro is designed to cater to those traders who are more interested in market structures, price action and fundermentals. Analysing volume, key levels in the market, market phases and multi-timeframe can help a trader build a clearer and more actionable view of the market. ChartPrime performs analysis on data in a unique way therefore attempting to give insights into the market otherwise unseen.
Major Features:
Order blocks: The ChartPrime order blocks provide sleek and clear levels in the market where the price might find support and resistance. It is important to note this data isn't availible currently therefore these are derived from data outside of order books. Order blocks are segmented into 4 sections reflecting the volume at a given levels. Low, Medium, High and very high based on relevant and dynamic averages. This allows a trader to identify how significant a level is in the market in a simpler method. Bearish order blocks have a red color bias and bullish order blocks have a green color bias allowing a trader to identify what type of order block it is. The order blocks also dynamically show the remaining volume at that given level.
Pattern Detection: ChartPrime leverages unique pattern identification methods providing earlier and cleaner chart formations. Patterns are commonly used in trading to assess whether bulls or bears are performing optimally in a market or losing strength. ChartPrime identifies; Ascending wedges, descending wedges, symmetrical Triangles, H&S, iH&S, broadening wedges and double tops/bottoms. Patterns often have associated theory behind them for entries and targets that we suggest a trader covers before using this feature. ChartPrime also allow for the user to adjust where a pattern is drawn from. In pattern theory there are 2 main approaches to drawing a formation; from candle body and candle wick. ChartPrime allows for this to be adjusted by a user and also allow for alerts to be set on these patterns.
MTF SR: Taking into account multi timeframes when trading is a key idea. Having ideas of the larger market moves can provide deeper context when trading. ChartPrime Market Dynamics Pro allows for 3 varying SR plots from 3 varying user desired timeframes. These are graded via pivot analysis and grid analysis. This rank is on a 1-10 scale with 1 being the highest rank and 10 is the lowest.
Market Stucutures : These labels are commonly found and used by the Smart Money community. They denote a break of stucture and a chance of character. BOS are labelled when the price breaks a lower low or higher high (in the trending markets) and a CoC occurs when price breaks a trending market pivot. These break a market into clearer breakouts of price action and can help a trader deduce relevant moves. The indicator allows for the user to adjust the detection length of these structures.
Premium and Discount Zones: Premium and Discount zones are underpinned by a simple piece of logic. A premium zone is taken from a higher swing point and the discount from a lower swing point. Although a very generic approach this can show areas in the market that could see a reaction. An asset being in a discount zone implies the price is undervalued. An asset being in a premium zone implies the asset is overpriced or overextended. These are excellent when used in confluence with other SR methods. These naturally will have a delay as they are derived from swing points in a market but still are extremely relevant levels.
Fair Value Gaps: These are gaps in the market where price has seen a highly volatile move and they are assumed to act as magnets in the market. The price may come back and visit these 'gaps' after the move has occured. These are a common technique now used by traders and added to this toolkit for convinience.
Settings:
Order Blocks: Select the scale of the order blocks displayed
BoS/CoC: Toggle these on/off and adjust the lookback on these market structures
Premium/Discount Zones: Toggle on/off and adjust lookback
Enable FVG: Toggle on/off FVGs
Swing Levels: Enable basic swing levels in market
MTF Support/Resistance: Enable and select the relevant timeframe to obtain MTF SR levels on your chart. Up to 3 timeframes at a time.
Predictive Ranges: Toggle on/off
Trend Lines Detection: Toggle on/off trendlines
Wedge Detection: Adjust how patterns are detected; whether from wick or candle body
Toggles provided for relevant patterns.
Example usecases:
ChartPrime order blocks give a deeper insight into market support and resistance levels. Looking for order blocks labelled with High can indicate this level being a significant support or resistance in the market. Adding in further confluences here can assist further in deciding where the price may see a reaction. Take the screenshot below:
Adding in confluences from other timeframes can also help give a broader view. Using the multi time frame graded frame support and resistance levels we can use these to further assist us in finding significant levels in the market.
ChartPrime also provides breaker blocks. These are still significant levels in the market despite being "broken" prior. These too can be used in a classical manor and act as relevant areas in the market. These are particularly effective when used in confluence with Premium and discount zones. We can see in the example below price sees a strong reaction and bounces at these levels.
Market Dynamics Pro provides a comprehensive toolkit of unique features and mixes in the classical concepts allowing for a cleaner charting experience.
All content and indicators provided by ChartPrime are purely for informational & educational purposes only. Past performance does not guarantee future results.
付費腳本

MTF Stationary Extreme IndicatorThe Multiple Timeframe Stationary Extreme Indicator is designed to help traders identify extreme price movements across different timeframes. By analyzing extremes in price action, this indicator aims to provide valuable insights into potential overbought and oversold conditions, offering opportunities for trading decisions.
The indicator operates by calculating the difference between the latest high/low and the high/low a specified number of periods back. This difference is expressed as a percentage, allowing for easy comparison and interpretation. Positive values indicate an increase in the extreme, while negative values suggest a decrease.
One of the unique features of this indicator is its ability to incorporate multiple timeframes. Traders can choose a higher timeframe to analyze alongside the current timeframe, providing a broader perspective on market dynamics. This feature enables a comprehensive assessment of extreme price movements, considering both short-term and longer-term trends.
By observing extreme movements on different timeframes, traders can gain deeper insights into market conditions. This can help in identifying potential areas of confluence or divergence, supporting more informed trading decisions. For example, when extreme movements align across multiple timeframes, it may indicate a higher probability of a significant price reversal or continuation.
To use the Multiple Timeframe Stationary Extreme Indicator effectively, traders should consider a few key points:
- Choose the Timeframes : Select the appropriate timeframes based on your trading strategy and objectives. The current timeframe represents the focus of your analysis, while the higher timeframe provides a broader context. Ensure the chosen timeframes align with your trading style and the asset you are trading.
- Interpret Extreme Movements : Pay attention to extreme movements that breach certain levels. Values above zero indicate a rise in the extreme, potentially signaling overbought conditions. Conversely, values below zero suggest a decrease, potentially indicating oversold conditions. Use these extreme movements as potential entry or exit signals, in conjunction with other indicators or confirmation signals.
- Validate with Price Action : Confirm the extreme movements observed on the indicator with price action. Look for confluence between the indicator's extreme levels and key support or resistance levels, trendlines, or chart patterns. This can provide added confirmation and increase the reliability of the signals generated by the indicator.
- Consider Volatility Filters : The indicator can be enhanced by incorporating volatility filters. By adjusting the sensitivity of the extreme differences calculation based on market volatility, traders can adapt the indicator to different market conditions. Higher volatility may require a longer lookback period, while lower volatility may call for a shorter one. Experiment with volatility filters to fine-tune the indicator's performance.
- Combine with Other Analysis Techniques : The Multiple Timeframe Stationary Extreme Indicator is most effective when used as part of a comprehensive trading strategy. Combine it with other technical analysis tools, such as trend indicators, oscillators, or chart patterns, to form a well-rounded approach. Consider risk management techniques and money management principles to optimize your trading strategy.
---------------------------------------------------------------------------------------------------------------------------------------------------------------
Remember that trading indicators, including the Multiple Timeframe Stationary Extreme Indicator, should not be used in isolation. They serve as tools to assist in decision-making, but they require proper context, analysis, and confirmation. Always conduct thorough analysis and consider market conditions, news events, and other relevant factors before making trading decisions.
It's recommended to backtest the indicator on historical data to assess its performance and effectiveness for your trading approach. This will help you understand its strengths and limitations, allowing you to refine and optimize your usage of the indicator.

Multi-Indicator Confluence Signals *LITE*Description:
Introducing the Multi-Indicator Confluence Signals (MICS), a comprehensive trading tool designed to simplify the process of analyzing multiple technical indicators and uncluttering your screen!
You are able to select various pre-existing indicators, including Stochastic, RSI, MACD, EMA, DMI, Bollinger Bands, and a our own custom signal we created using only price action calculations which will provide a streamlined view of the market, allowing traders to focus on speed, trade execution, strategy, and chart reading.
We do this by converting the input from the above popular technical indicators and generate clear long and short signals by placing green(long) and/or red(short) arrows directly on the chart.
You also have the option to choose which indicators you want to show on the screen and also the option to choose long and/or short signals.
The values we have chosen to generate the signals can be seen in each of the respective indicator input (i) tab in the inputs options.
Here are some examples:
Stoch Long
Will turn on green arrow signals to inform you the smoothed, 14 period stochastic line has crossed over 20.
Stoch short
Will turn on red arrow signals to inform you the smoothed, 14 period stochastic line has crossed under 80.
MA long
Will turn on green arrow signals to inform you when the moving average of the last 21 bars has become larger than the moving average of the last 50 bars.
MA short
Will turn on red arrow signals to inform you when the moving average of the last 21 bars has become smaller than the moving average of the last 50 bars.
RSI Long
Will turn on green arrow signals to inform you when the 14 period rsi value has crossed under 70.
RSI short
Will turn on red arrow signals to inform you when the 14 period rsi value has crossed over 30.
Go from this (Imagine your own drawings+the above indicators):
To this! (Only long signals displayed)
Features :
Consolidated signals:
The MICS identifies bull and bearish signals from multiple indicators and presents them in a visual arrow pointing manner, enabling traders to quickly assess potential trade opportunities.
Unique price action arrows:
The price action arrows in the MICS trading tool are a unique feature that distinguish it from traditional technical indicators.
These arrows are generated solely based on recent price movement and are calculated using an algorithm that analyzes the strength of recent price action.
The algorithm also considers factors such as the length and intensity of the trend, as well as any notable support or resistance levels.
When the 'Price Action Long' or 'Price Action Short' options are enabled, the MICS will display green or red arrows respectively, indicating potential bullish or bearish signals.
These arrows complement the signals generated by other pre-existing technical indicators in the MICS .
Clutter-free charting:
By removing the need to display individual indicators on the chart, the MICS helps create a cleaner workspace, promoting better focus and decision-making.
Confluence-based trading:
The MICS is not designed to be used as a standalone trading system.
Instead, traders should utilize the signals as confluences to complement their pre-existing trade ideas, leading to more robust and well-informed strategies.
Mashup of Indicators:
Each indicator has its own strengths and weaknesses, but by combining them, the MICS can provide a more comprehensive view of the market.
For example, Stochastic and RSI are commonly used to measure overbought and oversold conditions, while MACD and EMA are used to identify trend direction. DMI, on the other hand, is used to gauge the strength of a trend, while Bollinger Bands can be used to identify potential breakouts.
By combining the signals from these indicators, the MICS can provide traders with a more nuanced view of the market, allowing them to make better-informed trading decisions, quickly!
How They Work Together:
The MICS generates signals by analyzing the input from each individual indicator.
If the majority of the indicators show a bullish trend, the MICS will display this by showing the indicators you selected in the settings with green long arrows, indicating a potential long trade.
Conversely, if the majority of the indicators show a bearish trend, the MICS will display red short arrows, indicating a potential short trade.
In addition, the MICS uses a unique price action signal generated solely based on recent price movement, calculated using an algorithm that analyzes the strength of recent price action.
This price action signal is a distinguishing feature of the MICS and complements the signals generated by the pre-existing technical indicators.
What Makes the MICS Original?
What makes the MICS unique is its emphasis on providing a clutter-free charting experience.
By displaying only clear long and short signals directly on the chart based on your own selection in the settings, the MICS eliminates the need to have multiple indicators cluttering the screen, allowing traders to concentrate on making informed decisions, quickly!
This price action signal is a also unique feature that sets the MICS apart from other technical indicators.

RSI MTF DashboardThis is an RSI dashboard, which allows you to see the current RSI value for five timeframes across up to 8 tickers of your choice. This is a useful tool to gauge momentum across multiple timeframes, where you would look to enter a buy with high RSI values across the timeframes (and vice versa for sell positions).
Conversely, some traders use RSI to identify potential areas for reversals, so you would look to buy with low RSI values (and vice versa for sell positions).
In the settings, please select which 5 timeframes you require. Then select which tickers you wish to see, and you will find a dashboard on your chart to show the RSI values. The dashboard can be highlighted when the RSI value shows bearish momentum (a value under 50, of your choice) and bullish momentum (a value over 50, again of your choice). These colours and values are fully customisable.
In the settings you can also select the location of the dashboard, as well as some colour and transparency settings to enable the best possible view on screen.

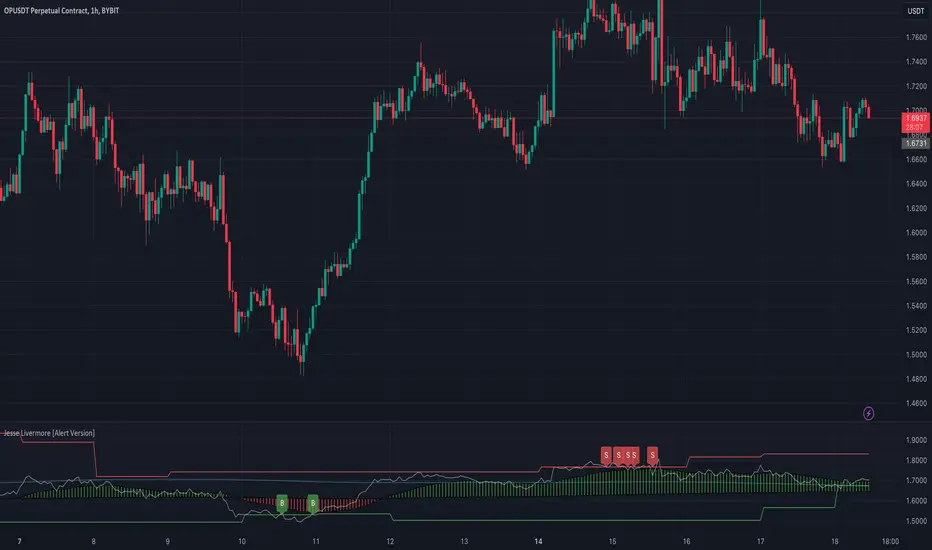
Jesse Livermore Strategy [Buy & Sell]Jesse Livermore was a famous trader who made a fortune in the early 20th century through his unique approach to trading.
While he did not leave behind a single, specific trading strategy that is attributed to him, I have tried to reproduce one.
His trading strategy was based on understanding market trends and sentiment, and he used several technical indicators to identify potential entry and exit points.
Some of the indicators he used include:
Price Action:
Jesse Livermore relied heavily on price action to make trading decisions.
He believed that the price itself was the best indicator of market sentiment, and that by analyzing the price movement, he could identify trends and market behavior.
Volume:
Livermore also used volume to confirm price movements.
He believed that a rise in volume along with a price increase indicated a strong bullish trend, while a decrease in volume with a price increase indicated a weak trend.
Pivot Points:
Another key component of Jesse Livermore's trading strategy was pivot points.
He used pivot points to identify potential support and resistance levels in the market, which he then used to identify potential entry and exit points.
Jesse Livermore outlined a simple trading system: wait for pivotal points before entering a trade.
When the points come into play, trade them using a buffer, trading in the direction of the overall market.
Let the price dictate your actions and stay with profitable trades until there is good reason to exit the trade.
The one I have tried to reproduce it's based on Pivot High and Low looking back 5 Days, and the average price oscillator.
When the price is bellow the support defined line it's time to Buy ( Long Position ), when the Price line is over the Resistance Line it's time to Sell ( Short Position )
This indicator has to be checked, and tried into a Real-Time context, so using the Replay functionality of TradingView is the best way to see and understand how Signals comes
(NB: look back into the chart without Replay should give you wrong Buy/Sell information)
The Indicator can be used on every TimeFrames, but the better ones are 5min - 15min.
I will add the possibility to choose the TimeFrames value for Pivot High and Low.
I will create a version with Alerts for Buy and Sell and the possibility to integrate it with "3commas Bot" where the best deal can be to set a TP to 1% for each Long or Short Entry.
Let's try it and comment for doubts or questions.
TimeFiesta by Billy Rock
Introducing TimeFiesta, a unique and fun digital clock timer for TradingView charts, created by Billy Rock. TimeFiesta is designed to help traders, especially scalpers, stay on top of multiple time frame closes with ease.
Features of TimeFiesta:
Customizable display of timer for Current Time Frame, 15 Minutes, 1 Hour, and 4 Hours.
Options to turn ON/OFF each time frame display as per the user's preference.
Adjustable digital clock text size: Small, Medium, and Large.
Multiple location options for the digital clock timer: Top Center, Top Right, and Bottom Right.
TimeFiesta is the perfect companion for those who need to keep an eye on multiple time frames while trading. Its sleek design and user-friendly interface make it a must- have tool for traders of all levels. With TimeFiesta, you'll never miss a crucial time frame close again!
Give credit where it's due: TimeFiesta is created by the talented Billy Rock. Be sure to try this fantastic tool and enhance your trading experience!

Import Forex Volume from 5 biggest FX Brokers (single/combined) Some Brokers like Forex.com don't show Volume for FX. This indicator allows user to import Volume from a range of FX brokers that DO show volume
-Combine the reported volumes from all five brokers: FXCM, GLOBALPRIME, PEPPERSTONE, Currency.com, OANDA. Or pick a specific broker to import volume from.
-Image above shows combined Volume from the big 5 brokers, with added notes on the 2yr average of various broker's volumes; showing their size in descending order.
-Works across timeframes & FX pairs. Standard color formatting options Added.
//notes:
~default settings pull/combine volume from all 5 brokers. History goes back to Sept 2019 (due to GlobalPrime's later start date in publishing Volume data).
~~toggle ON 'only show FXCM, Pepperstone & Oanda' for a LONGER history, going back to June 2012.
~individual broker feeds: top checkbox toggled OFF, choose your preferred broker.
~~FXCM has both the longest history and the highest volume size of all the brokers.
~Table (toggle on/off) shows the broker feed (which broker(s) volume is on display) and the SMA 100 to give an idea of relative size.
//Cautionary note:
Volume is not as reliable in Forex as it is in Equities/commodities, due to unreported Inter-bank trades; the broker volumes do not give the full picture, but this is a best approximation of combined total volume based on brokers reported volume. The true volume will likely be much higher.
-Thank you @theEccentricTrader for the idea of pulling volume feed from other brokers.

Multi-Symbol Cross Indicator Template - Unleash Your Potential!Unlock your full trading potential with this powerful and versatile Multi-Symbol Cross Indicator Template! This script is designed to make you stand out from the crowd by enabling you to monitor multiple symbols on a single chart for specific events, such as a Golden Cross or Death Cross. With its high adaptability to include various technical indicators, you're in complete control of your trading decisions and market analysis.
By using the built-in request.security function, this template fetches data for your chosen symbols from the selected exchange and calculates the conditions (e.g., moving average crossovers) for each symbol. Although the current implementation focuses on Golden Crosses and Death Crosses, the sky is the limit when it comes to modifying the script to incorporate other technical indicators such as RSI, MACD, or Bollinger Bands.
You, as a discerning trader, can easily customize the script by selecting your preferred exchange and symbols through input options. This flexibility allows you to monitor your favorite markets without the need for any direct code modification, giving you the ultimate adaptability for various trading strategies and market analysis purposes.
Remember, this script is more than just an example or template; it's the key to unleashing your inner trading genius. While it's not intended to be a standalone trading strategy, it serves as the foundation for you to build upon and create your own customized multi-symbol indicators or strategies. You are awesome, and with this Multi-Symbol Cross Indicator Template, there's no doubt that you're on the path to achieving great success in your trading journey!

support and resistance on multi timeframe [parsimaj] Description:
support and resistance and trendline on two timeframes by your choice
This indicator is capable of showing you the current and higher timeframe support and resistance by your strategy choice (two timeframes alongside each other). It also helps you to monitor the trend direction in short and long term by trend lines . You can change the depth of every levels and trend lines from the panel. Use this indicator in all markets because it follows the basic principles of levels but is unique in changing second timeframe by your choice.
_its smart , if the levels are too close together ,it will choose the deeper ones for you.
How it works:
By default, there is no higher timeframe and you can select your desire higher timeframe from the panel. Higher timelines will be displayed thicker and your current levels would be thin lines. (Levels that are higher than the current price will be red and those that are lower will be green). The number of levels to display is also by your choice, the default is 4 levels for each timeframe.
We have two types of trend lines , long terms as trend 1 (blue below and purple above trend line )- short term as trend 2(dashed ones).
Bouncing on levels and breaking trend line are the best triggers for entry and exit points.
Setting:
First, choose your higher timeframe then the depth of levels for each time (current and higher), The deeper it is, the more precise the lines. After that you can set the depth of trend lines by your choice. Trend 1 is the longer term So put it deeper and then set the short trend line (dashed ones) if you want to change it.
We have put the settings in the best mode, but you can also change it according to your strategy and inform us about the results.
This indicator has been obtained with hours of effort and codding , hope you enjoy
Period OpenA very simple indicator that displays the Open of the specified Timeframe
How to use this indicator?
1. Directional Bias
Bullish => Closing Price > Period Open
Bearish => Closing Price < Period Open
2. Support / Resistance
Each Period Open can be used as Support or Resistance
3. Take Profit Targets
Each Period Open can be used as targets for taking profit

Stochastic Oversold / Overbought Multi Time Frame on CandleAt the suggestion of a friend, I prepared this educational indicator to show how to use a Multi time frames on the chart based on the color of The Candle.
This Script calculates the stochastic oscillator for multiple timeframes and displays the overbought/oversold signals on the chart with color coding.
The stochastic oscillator is a momentum indicator that compares a security's closing price to its high-low range over a set number of periods. The indicator oscillates between 0 and 100, with readings above 80 considered overbought and readings below 20 considered oversold.
The indicator has the following input parameters:
%K Length: the number of periods used to calculate the stochastic oscillator (default is 14).
%K Smoothing: the number of periods used to smooth the stochastic oscillator (default is 1).
Three timeframes: The timeframes for which the stochastic oscillator is calculated can be set as 15-minute, 1-hour, or 4-hour intervals. For each timeframe, the user can choose to display the indicator (or not) and set the color of the candle. The user can also set the overbought and oversold levels (default is 80 and 20, respectively).
The indicator calculates the stochastic oscillator using the ta.stoch function from the built-in ta library in PineScript. It then uses the ta.sma function to smooth the stochastic oscillator if specified. Finally, the indicator uses the TimeframFuction to calculate the stochastic oscillator for different timeframes, which is then displayed on the chart using the barcolor function. The color of the candle is set based on whether the stochastic oscillator is overbought or oversold, as determined by the overbought/oversold levels specified by the user.
Note: This code is example for you to use multi timeframe in your indicator or Strategy , also prevent Repainting Calculation

Buy Sell Signal ScannerThis is a higher timeframe scanner that detects whether the market is bullish or bearish according to our Buy Sell Indicator on up to 8 different timeframes. It can also be customized to scan different tickers so you can scan tickers that typically move with or against the ticker you are trading for extra confirmation. The scanner can be configured to use the exact same settings that you use with the Buy Sell Indicator so everything is using the same formula.
For price action identification, scalp mode looks at the candle body, candle wicks and size of the body and wicks and compares all of that to the previous candle to see if it is bullish or bearish. Swing mode will compare the current candle to the last 2 candles and long swing mode will compare the current candle to the last 10 candles. It’s looking for higher highs & lower lows, if the candle body is large or small and much more.
There are also filters that prevent signals from being given when the candle is small or has not made a higher high or lower low compared to the previous candle and multiple other filters to help hold positions longer. Once the price action direction has been confirmed, then the script looks at a massive amount of other calculations to determine if a signal should be given or not. These calculations are made up of all of my best indicators combined into a master signal generator as well as more new calculations from things I have learned over time and tested extensively that have not been made available to the public until now.
Price action as well as many other factors will all have to be confirming the direction before a signal can come in, but it reacts very quickly so it can give early signals at the first sign of reversal. Fine tune your settings to match your Buy Sell Indicator settings to get the same signals on the scanner.
HOW TO USE
The scanner will show the higher timeframe in a table on the side of the chart if no other ticker is selected to scan. The timeframe cell will show as green if that timeframe is currently in a bullish signal and red if that timeframe is currently in a bearish signal. If you set it to use a different ticker, the ticker name and timeframe will show up in the table.
The defaults are set up to scan the same ticker as your chart but on higher timeframes. It is set up for a 1 minute chart by default, but each timeframe can be adjusted to suit your preference all the way up to a 1 year timeframe.
You can set the scanner to look at different tickers as well which is very useful for getting confirmation by setting it to scan other tickers that usually move in the same direction or opposite of the ticker you are trading.
TRADE MODE
The signal settings allow you to match the scanner settings to your settings on the Buy Sell Indicator. There is scalp mode, swing mode and long swing mode. All 3 settings use the same calculations for signals, but they have different price action filters to help hold swings longer. Scalp mode will only be looking at the current bar compared to the previous bar, but swing mode will look at the current bar compared to the previous 2 candles. Long swing mode will compare the current candle to the last 10 candles to hold positions even longer.
There is also a candle trailing length that can be adjusted as well to suit your preference. This adds a filter that ensures the current candle is closing higher than the previous X number of candles you choose for a bull signal and is closing lower than X number of previous candles for a bear signal. Make sure to match these settings to how your Buy Sell Indicator is configured to get matching results.
You can also move the position of the scanner table to any part of the chart in the settings menu at the bottom.
ALERTS
There are alerts set up that will give you a signal when all timeframes are bullish on candle close and another signal that will alert when all timeframes are bearish on candle close. There is also an alert for when the first 4 timeframes & ticker are bullish and the last 4 timeframes & ticker are bearish or the opposite. This is useful for looking at forex markets and setting the first 4 to tickers that move together and the last 4 to tickers that move opposite.
MARKETS
This Buy Sell Signal Scanner can be used on any market with price data such as stocks, crypto, forex and futures.
TIMEFRAMES
This Buy Sell Signal Scanner can be used on any timeframe. And will scan any of our available timeframes between 1 minute and 1 year.
PAIRINGS
We recommend pairing this Buy Sell Signal Scanner with our Buy Sell Indicator so you can get signals and price action colored candles on the ticker you are trading and then use the scanner for confirmation of trend on higher timeframes and trade with the trend.

Multi Timeframe Stochastic RSI ScreenerThis script is also a Stochastic RSI Screener, but it allows users to choose one specific symbol and three timeframes of that symbol to monitor at once.

3 Zigzag for MTF Fib Alert [MsF]Japanese below / 日本語説明は英文の後にあります。
-------------------------
This indicator that automatically displays Fibonacci from each High & Low based on 3 Zigzags. It's useful for multi-timeframe analysis.
For example, Fibonacci calculated from the high and low prices (Zigzag 3 Period=100) of the upper timeframe can be displayed on the lower timeframe.
Also, you can set alerts for each Fibonacci point. It is useful when you are waiting for the price to return to the discount (50% or less) or the premium (50% or more) of the upper timeframe.
"Fib 1 - Crossing 0.00" … Trigger an alert when crossing the 0% line in Fibonacci of Zigzag1
"Fib 1 - Crossing 100.0" … Trigger an alert when crossing the 100% line in Fibonacci of Zigzag1
"Fib 1 - Crossing 23.6" … Trigger an alert when crossing the 23.6% line in Fibonacci of Zigzag1
"Fib 1 - Crossing 38.2" … Trigger an alert when crossing the 38.2% line in Fibonacci of Zigzag1
"Fib 1 - Crossing 50.0" … Trigger an alert when crossing the 50.0% line in Fibonacci of Zigzag1
"Fib 1 - Crossing 61.8" … Trigger an alert when crossing the 61.8% line in Fibonacci of Zigzag1
"Fib 1 - Crossing 76.4" … Trigger an alert when crossing the 76.4% line in Fibonacci of Zigzag1
*Same as Zigzag 1 and Zigzag 2 too.
"Choose Zig Zag Leg for fib" parameter means...
Latest : Calculate Fibonacci based on "the most recent Zigzag line".
Previous : Calculate Fibonacci based on "the previous Zigzag line".
-------------------------
3つのZigzagを元に各High&Lowからフィボナッチを自動で表示するインジケーターです。
Zigzagの期間を工夫することで、マルチタイムフレーム分析に役立ちます。
例えば、以下の設定とした場合:
Zigzag 1 Period … 8
Zigzag 2 Period … 25
Zigzag 3 Period … 100
上位時間足Zigzag(Period=100)の高値安値から形成されるフィボナッチを下位時間足に表示することができるのです。
また、このインジケーターではフィボナッチのポイント毎にアラートの設定が可能です。
上位時間足の割安価格(50%以下)や割高価格(50%以上)に価格が戻ってくるのを待っている時などに力を発揮してくれます。
"Fib 1 - Crossing 0.00" … Zigzag1のフィボナッチにおいて、0%ラインとクロスした場合にアラートを発報します
"Fib 1 - Crossing 100.0" … Zigzag1のフィボナッチにおいて、100%ラインとクロスした場合にアラートを発報します
"Fib 1 - Crossing 23.6" … Zigzag1のフィボナッチにおいて、23.6%ラインとクロスした場合にアラートを発報します
"Fib 1 - Crossing 38.2" … Zigzag1のフィボナッチにおいて、38.2%ラインとクロスした場合にアラートを発報します
"Fib 1 - Crossing 50.0" … Zigzag1のフィボナッチにおいて、50.0%ラインとクロスした場合にアラートを発報します
"Fib 1 - Crossing 61.8" … Zigzag1のフィボナッチにおいて、61.8%ラインとクロスした場合にアラートを発報します
"Fib 1 - Crossing 76.4" … Zigzag1のフィボナッチにおいて、76.4%ラインとクロスした場合にアラートを発報します
※Zigzag1およびZigzag2のフィボナッチも同様
"Choose Zig Zag Leg for fib"パラメータについて:
Latest … 一番新しいZigzagのライン(UpまたはDown)を元にフィボナッチを計算します。
Previous … ひとつ前のZigzagのライン(UpまたはDown)を元にフィボナッチを計算します。

Multi TF High/Low/Open/Close LineNOTE: I'm not sure why the screengrab isn't showing the lines. They are there, and when I share the chart from this link they are there.... idk
This is a requested spin-off version of my previous HLOC for the Daily/Weekly/Monthly that allows users to choose 3 different timeframe units (Mins, Hours, Days, etc...) from the dropdown menu and then select the lookback period in which to draw the HLOC.
I've had quite a few requests to allow users to see multiple lookbacks for the same timeframe unit, mostly weekly, and I did not wish to change that particular script for that purpose. However, I was able to take the existing script and alter it for user input.
This indicator draws a line on the TF 1, TF 2, and TF 3 bar at the High, Low, Open and Close of user input Timeframe unit and selected lookback period.
The lookback period will go back the number of candles entered. So for example if you choose a 5 Min chart with a lookback of 3, the lines will be drawn on the HLOC 3 closed 5 min candles back. Selecting 0 will show data on the current Real-Time candle.
An example of a request I have gotten was for last week, the previous week and the previous month. The settings for that would be: TF 1 - 1 week Lookback 1, TF 2 - 1 week Lookback 2, TF 3 - 1 month Lookback 1.
Each set of lines has an optional identifying label with its own color set that can be shown with or without price value, and has drop down menus for size and style of each set of labels. The TF unit value is displayed on the label, but not the lookback.
So if you are using the hourly on all 3 TF's with different lookback periods, they will all say "60" on the label.
I recommend using the line and label options to distinguish between the different lookback values.
Each set of lines has inputs for line/text color, line width and style and each line argument can be selected independently.
In the chart example I have displayed only the High and Low on three 1 hour TF's with the lookback of 4, 5 and 6 candles with the labels descending in size. With this data I can see that over the last 6 hours the price of ES is in an descending pattern and I should be on alert for a break.
Since I trade ES in RTH on a much lower timeframe, this data can alert me to a bigger picture potential trend change or continuation. I would personally use this with pivot data for timing and look for entries in areas of high volume that moved price to a new
high or low that have not been retested.
I will be looking to add a user input offset for labels in the future. I have had bad luck with it in the past working for a couple weeks and then throwing an error, but I will look into it again soon.
I also recommend going into Chart Settings/Status Line and turning off indicator arguments OR moving the script to the top of the indicator list to avoid obstructed chart view with this indicators arguments. When script allows, I will update it to hide them.

Black RSI (Pro Suite)Black RSI (Pro Suite) is combination of RSI (Relative Strength Index), Volume RSI, Heikin Ashi RSI & other multi Oscillators with multi features into one indicator, features like (Quad Divergences, Multi Time Frame RSI, MTF RSI Panel, Oscillator Support/Resistance/Wedges/Trendlines, Oscillator Moving Average/BBs, Smooth RSI, RSI Price Estimator, Oscillator Over bought/sold Bars, Osc OB/OS Zones, Osc OB/OS Highlights, additionally Black RSI indicator is flexible & completely customizable).
Indicator goal: I have tried my best to organized RSI & other suitable oscillators and oscillator useful tools into one simple and free indicator for Tradingview users (specifically for Tradingview 'basic' subscription users). suggestions are always welcome. please give feedback & appreciate if you like my work.
Black RSI Indicator Features Summary:
Black RSI indicator includes many features mainly relevant to RSI and other Oscillators, these are briefly highlighted below:
Black RSI Dashboard
Multi Oscillators: Choose between multiple oscillators. All oscillators settings are customizable.
Multi Symbol: Multi Symbol Support, applicable on all oscillators
RSI (Relative Strength Index)
VRSI (Volume Relative Strength Index)
HA RSI (Heikin Ashi Relative Strength Index)
OBV (On Balance Volume)
CVD (Comulative Volume Delta)
MFI (Money Flow Index)
UO (Ultimate Oscillator)
MOM (Momentum Oscillator)
ATR (Average True Range)
Stoch (Stochastic Oscillator)
Stoch RSI (Stochastic RSI)
Oscillator Primary Tools ◢
Oscillator Moving Average/Bollinger Bands
Smooth RSI
Multi Timeframe RSI
Multi Timeframe RSI Panel
RSI Price Estimator
Oscillator Support/Resistance/Wedges/Trendlines
Oscillator Moving Average/BBs: Shows Moving Average for selected oscillator.
Smooth Smooth: Smooths out RSI
Multi Timeframe RSI: Displays Multiple Time Frame/Multiple Symbol RSI and converts it and shows it as it is in current time frame without effecting Primary RSI
Multi Timeframe RSI Panel: Displays Multiple Time Frame/Multiple Symbol RSI values of user input specific timeframes in compact panel (max 8 Time frames)
RSI Price Estimator: Calculates RSI estimate price values of 3 different user specific RSI input levels, RSI x MA cross price and RSI future value of user specific price input level.
Oscillator Support/Resistance/Wedges/Trendlines: Draws Trendlines, Wedges and Support & Resistance lines on selected oscillator
Oscillator Quad Divergence ◢
1st Oscillator Divergence: Traditional divergence indicator with enhancements & customization
2nd Oscillator Divergence: Traditional divergence indicator with enhancements & customization
3rd Oscillator Divergence: Advanced Divergence indicator with source selection, RSI/Price threshold, potential divergences & customization
4th Oscillator Divergence: Pivots divergence indicator with flexible pivots selection & customization
Regular bullish divergences are indicated when price is forming lower lows while an oscillator shows higher lows.
Regular bearish divergences are indicated when price is forming higher highs while an oscillator shows lower highs.
While regular divergences indicate trend reversals, hidden divergences indicate a trend continuation.
When the price is making higher lows and the oscillator is showing lower lows, we speak of a bullish hidden divergence.
When the price is making lower highs and the oscillator shows higher highs, it's a bearish hidden divergence.
Oscillator Secondary Tools ◢
Oscillator HH/LL pivots
Osc OB/OS Color Bars
Osc OB/OS Zones
Osc OB/OS Highlights
Background
Oscillator HH/LL pivots: Shows HH/LL pivot points on selected oscillator
Osc OB/OS Color Bars: Plots color chart bars based on RSI, MFI, Stochastic, Stochastic RSI or combine overbought/oversold conditions
Osc OB/OS Zones: Plots Osc OB/OS Zones with user input levels
Osc OB/OS Highlights: Highlight oscillator OB/OS background area
Background: background color customization
+ Primary RSI Settings ▾
- Primary RSI Length: User input RSI Length value
- Primary RSI Source: User RSI Source selection
- RSI Overbought Threshold: Allows the user to set the RSI overbought threshold value. This Overbought Threshold value will also be applied on "RSI Divergence overbought condition", "RSI OB Color Bars" and "Primary RSI Color Schemes
- RSI Oversold Threshold: Allows the user to set the RSI oversold threshold value. The lower band (oversold line) of RSI. This Oversold Threshold value will also be applied on "RSI Divergence oversold condition", "RSI OS Color Bars" and "Primary RSI Color Schemes
- RSI Middle Band: Allows the user to set the RSI middle band value. This value will also applied to "Center Line" color scheme from "Primary RSI Color Schemes" drop menu
- Primary RSI Colors:
Range color specifies a gradient of colors from the overbought to the oversold threshold user inputs from "Primary RSI" section. Color interpolation also a gradient but smoother than Range color. Center Line is similar but is not a gradient, linked to Middle Band ("Primary RSI" section) and changes color with RSI Middle Band. Traditional is simple with Overbought and Oversold colors change.
- RSI Bullish Band: Allows the user to plot extra/optional RSI band on RSI Oscillator (Note: it will not be plotted if "OB/OS Zone only" enabled from "OB/OS Zone Settings" section)
- RSI Bearish Band: Allows the user to plot extra/optional RSI band on RSI Oscillator (Note: it will not be plotted if "OB/OS Zone only" enabled from "OB/OS Zone Settings" section)
+ Primary RSI Smooth Settings ▾
- Smooth Moving Average Type: User selected Smooth MA type. With RSI Smooth enabled, will also effect all RSI Divergences detection (all divergences will be plot according to "Smoothed RSI line")
- Smooth Moving Average Length: User input Smooth MA length value
+ Oscillator Moving Average Settings ▾
- Osc Moving Average Colors: Allows user to select Bullish/Bearish colors of Oscillator Moving Average
- Osc Moving Average Type: Allows user to select Oscillator MA Type
- Osc Moving Average Length: User input Oscillator MA length value
- Osc Moving Average Thickness: User input Oscillator MA thickness
- BB StdDev: user input Bollinger Bands standard deviation value
+ Stochastic Oscillator Settings ▾
- Same as Traditional/Default indicator
+ Stochastic RSI Oscillator Settings ▾
- Same as Traditional/Default indicator
+ Money Index Flow Settings ▾
- Same as Traditional/Default indicator
+ Ultimate Oscillator Settings ▾
- Same as Traditional/Default indicator
+ Momentum Oscillator Settings ▾
- Same as Traditional/Default indicator
+ Average True Range Settings ▾
- Same as Traditional/Default indicator
+ Multi Timeframe RSI Settings ▾
- MTF RSI Time Frame: Allows user to select MTF RSI Time Frame
- MTF RSI Symbol: Allows user to select MTF RSI Time Symbol
- MTF RSI Length: User input MTF RSI length value
- MTF RSI Source: User selected MTF RSI source
- MTF RSI Line Width: User input MTF RSI line thickness value
- Number of Bars for MTF RSI plot
- MTF RSI Color > OB color > OS color : Allows user to select MTF RSI color with additionally Overbought/Oversold colors
+ MTF RSI Panel Settings ▾
- Select MTF RSI Type: If "Primary RSI" or "Volume RSI" selected MTF RSI Panel will show output values based on "Primary RSI" or "Volume RSI" parameters e.g. source, length, but without smooth.
- MTF RSI Panel Symbol: Allows user to select MTF RSI Panel symbol, leave symbol blank or uncheck "checkbox" for current chart symbol
- Show Symbol in Panel: Shows symbol ticker(current or user selected) in MTF RSI Panel
- Panel Background: Allows user to select MTF RSI Panel Background (enable/disable) and Background color selection
- TF1: MTF RSI Timeframe 1 user selection
- TF2: MTF RSI Timeframe 2 user selection
- TF3: MTF RSI Timeframe 3 user selection
- TF4: MTF RSI Timeframe 4 user selection
- TF5: MTF RSI Timeframe 5 user selection
- TF6: MTF RSI Timeframe 6 user selection
- TF7: MTF RSI Timeframe 7 user selection
- TF8: MTF RSI Timeframe 8 user selection
- Panel Top Offset: MTF RSI Panel offset input value
- Position: MTF RSI Panel position selection
- Text Size: MTF RSI Panel text size selection
- Bullish Colors: MTF RSI Panel bullish color selection. (Bullish colors range RSI >75, <75 to >65, <65 to >55)
- Bearish Colors: MTF RSI Panel bearish color selection. (Bearish colors range RSI <45 to >35, <35 to >25, <25)
+ RSI Price Estimator Settings ▾
- Price 1: User input value for RSI future price
- Price 2: User input value for RSI future price
- Price 3: User input value for RSI future price
- Panel Position Offset: User input value for panel position offset
- Price Decimals: User input value for output price decimals in panel
- Show RSI/OscMA cross Price: Enable/Disable RSIxOscillator MA cross future price
- Show RSI Level for Input Price: User input price for future RSI level
- Invisible Background: Enable/Disable Background
Auto Text Color > Auto color change of Panel text according to Dark/Light chart theme
+ Oscillator Support/Resistance Settings ▾
- Show Support line: Allows user to Enable/Disable Oscillator support line
Color > Auto Color: Auto color change of support line according to Dark/Light chart theme
- Show Resistance line: Allows user to Enable/Disable Oscillator resistance line
Color > Auto Color: Auto color display of resistance line according to Dark/Light chart theme
- Lookback lows/highs: User input of Lookback lows/highs value
- Distance threshold: Distance from the line to the low
- Line touch points: Number of points that have to be around the line
- Low/High left bars: User input of Low/High left bars value
- Low/High right bars: User input of Low/High right bars value
- Line style: User selection of line style
- Line thickness: User input of line thickness value
+ Oscillator 1st Divergence Settings ▾
- Divergence Source: User selection of divergence source. "High/Low" (high/low of oscillator/price divergence detection), "Close" (close of oscillator/price divergence detection) and "Both" (Both Close + High/Low of oscillator/price divergence detection). (Note: Traditional Divergence indicator default source is "High/Low")
- Pivot Lookback Right: How many candle to compare on the right side of a candle when deciding whether it is a pivot. The lower the number is, the earlier pivots (and therefore divergences) will be signaled, but the quality of those detections could be lower.
- Pivot Lookback Left: How many candle to compare on the left side of a candle when deciding whether it is a pivot. The lower the number is, the earlier pivots (and therefore divergences) will be signaled, but the quality of those detections could be lower.
- Divergence Max Length (Bars): The maximum length of a divergence (number of bars). If a detected divergence is longer than this, it will be discarded
- Divergence Min Length (Bars): The minimum length of a divergence (number of bars). If a detected divergence is shorter than this, it will be discarded
- Show Divergence as:
- Line Thickness: User input divergence line thickness value
- Label Transparency: it could reduce labels mess on oscillator line, input "100" for label text only without label background
- Labels Text Color: User label text color selection
Auto Text Color > Auto color change of label text according to Dark/Light chart theme
- Bull Divergences: Enable/Disable of Bull divergences
> Color: User selection of Bull divergence color
> Oversold only: It will show Regular Bullish RSI divergences in oversold zone only, RSI oversold threshold can be configure in "Primary RSI Settings" section.
- Bear Divergences: Enable/Disable of Bear divergences
> Color: User selection of Bear divergence color
> Overbought only: It will show Regular Bearish RSI divergences in overbought zone only, RSI overbought threshold can be configure in "Primary RSI Settings" section.
- Hidden Bull Div: Enable/Disable of Hidden Bull divergences
> Color: User selection of Hidden Bull divergence color
- Hidden Bear Div: Enable/Disable of Hidden Bear divergences
> Color: User selection of Hidden Bear divergence color
+ Oscillator 2nd Divergence Settings ▾
- Same as Oscillator 1st Divergence Settings
+ Oscillator 3rd Divergence Settings ▾
- Divergence source: User selection of divergence source . "oscillator" (divergence detection with high/low or close of selected oscillator), "price" (divergence detection with high/low or close of price)
- Bull price source: User selection of Bull price source. Bull price source: "Low" (low of price divergence detection), "Close" (close of price divergence detection) (linked to "price" in "Divergence source")
- Bear price source: User selection of Bear price source. Bear price source: "High" (high of price divergence detection), "Close" (close of price divergence detection) (linked to "price" in "Divergence source")
- Low/High left bars: How many candle to compare on the left side of a candle when deciding whether it is a pivot. The lower the number is, the earlier pivots (and therefore divergences) will be signaled, but the quality of those detections could be lower.
- Low/High right bars: How many candle to compare on the right side of a candle when deciding whether it is a pivot. The lower the number is, the earlier pivots (and therefore divergences) will be signaled, but the quality of those detections could be lower.
- Maximum lookback bars: The maximum length of a divergence (number of bars). If a detected divergence is longer than this, it will be discarded.
- Price threshold: User selection of Price threshold, higher values more lines
- RSI threshold: User selection of RSI threshold, higher values more lines
- Show Lows: Displays lows of RSI
- Show Highs: Displays highs of RSI
- Show Divergence as:
- Line Style:
- Line thickness: User input divergence line thickness value
- Label Transparency: it could reduce labels mess on oscillator line, input "100" for label text only without label background
- Labels Text Color: User label text color selection
Auto Text Color > Auto color change of label text according to Dark/Light chart theme
- Bull Divergences: Enable/Disable of Bull divergences
> Color: User selection of Bull divergence color
> Potential Bull: It will plot potential regular bull divergence with dotted line.
- Bear Divergences: Enable/Disable of Bear divergences
> Color: User selection of Bear divergence color
> Potential Bear: It will plot potential regular bear divergence with dotted line.
- Hidden Bull Div: Enable/Disable of Hidden Bull divergences
> Color: User selection of Hidden Bull divergence color
> Potential H.Bull: It will plot potential hidden bull divergence with dotted line.
- Hidden Bear Div: Enable/Disable of Hidden Bear divergences
> Color: User selection of Hidden Bear divergence color
> Hidden Bear divergence: It will plot potential hidden bear divergence with dotted line.
> Regular Bull oversold only: It will show Regular Bullish RSI divergences in oversold zone only, RSI oversold threshold can be configure in "Primary RSI Settings" section.
> Regular Bear overbought only: It will show Regular Bearish RSI divergences in overbought zone only, RSI overbought threshold can be configure in "Primary RSI Settings" section.
+ Oscillator 4th Divergences Settings ▾
- Upper Length: User pivot input value of draw upper divergence line From
- To Pivot:
- Lower Length: User pivot input value of draw lower divergence line From
- To Pivot:
- Show Divergence as:
- Line Style:
- Line thickness: User input divergence line thickness value
- Label Transparency: it could reduce labels mess on oscillator line, input "100" for label text only without label background
- Labels Text Color: User label text color selection
Auto Text Color > Auto color change of label text according to Dark/Light chart theme
- Bull Divergences: Enable/Disable of Bull divergences
> Color: User selection of Bull divergence color
- Bear Divergences: Enable/Disable of Bear divergences
> Color: User selection of Bear divergence color
- Regular Bull oversold only: It will show Regular Bullish RSI divergences in oversold zone only, RSI oversold threshold can be configure in "Primary RSI Settings" section.
- Regular Bear overbought only: It will show Regular Bearish RSI divergences in overbought zone only, RSI overbought threshold can be configure in "Primary RSI Settings" section.
+ Oscillator HHLL Pivots Settings ▾
- Pivot Length: User input value of HH/LL pivot length
> L.Text Color: User label text color selection
- HH color: User HH Label color selection
- HL color: User HL Label color selection
- LH color: User LH Label color selection
- LL color: User LL Label color selection
+ Oscillator OB/OS Colored Bars Settings▾
- Overbought/Oversold Bars Oscillator: Plots Overbought/Oversold color bars based on RSI, MFI, Stoch, Stoch RSI overbought/oversold threshold conditions separately or combined(when every oscillator reach its OB or OS threshold condition at same time).
- Overbought Bar Color: User RSI OB Bars color selection
- Oversold Bar Color: User RSI OS Bars color selection
+ Primary RSI Range Color ▾
- OB: Overbought Color
- OS: Oversold Color
- Bullish: Bullish Color
- Bearish: Bearish Color
+ Primary RSI Color interpolation ▾
- RSI Color: RSI Color
- OB: Overbought Color
- OS: Oversold Color
+ Primary RSI Center Line Color ▾
- OB: Overbought Color
- Bullish: Bullish Color
- Bearish: Bearish Color
- OS: Oversold Color
+ Primary RSI Traditional Color ▾
- RSI Color: RSI Color
- OB: Overbought Color
- OS: Oversold Color
Osc Overbought/Oversold Zones Settings ▾
- OB/OS Zone Band Lines: Enable/Disable OB/OS Zone Band Lines
- OB/OS Zones only: Only shows OB/OS Zones and disable all RSI band lines except Middle Band. Background will not be effected by this setting.
- Overbought Zone: User input value of Overbought Zone from
> To:
- Oversold Zone: User input value of Oversold Zone from
> To:
Osc Overbought/Oversold Highlights ▾
- Overbought Highlights : Enable/Disable Overbought Highlights
- Oversold Highlights : Enable/Disable Oversold Highlights
- Transparency: Gradient transparency of highlighted area
+ 'Oscillators Color Settings ▾
- Show Osc Symbol label : Enable/Disable of oscillator symbol label. Displays current oscillator symbol, but with "Override Oscillator Symbol" enabled from "Black RSI Dashboard" it will Auto/forcefully displays Override Oscillator Symbol on Oscillator
- Fade out Oscillator line: Fade out the oscillator line color, focusing only the most recent periods prominent for a clearer chart
- Fill Stoch/StochRSI lines: Fills Stoch/Stoch RSI lines
- Oscillator line thickness: user input value of oscillator line thickness
- Oscillator line offset: Shifts the oscillator to the left or to the right on the given number of bars, Default is 0
- OBV Color
- MFI Color
- ATR Color
- UO Color
- MOM Color
- CVD Bullish Color
- CVD Bearish Color
+ Background Setting ▾
- Custom Background Color: User selection of Background color
Authors & Credits: I'd like to THANK to Nabeel Black(myself), LonesomeTheBlue, iFuSiiOnzZ, jmosullivan, zdmre, creengrack, and TradingView for the locally sourced ingredients.
Disclaimer: DYOR. Not financial advice. Not a trading system. I am not affiliated with TradingView or any authors mentioned here; You alone have the sole responsibility of evaluating the script output and risks associated with the use of the script. Trading success is all about following your trading strategy and the indicators should fit within your trading strategy, and not to be traded upon solely. Always trade with confluence and Risk Management.
Feedback & Bug report
if you found any bug in this indicator or any suggestion, please let me know. Please give feedback & appreciate if you like to see more future updates and indicators. Thank you

RSI Multi Alerts MTFThis indicator won't plot anything to the chart.
Please follow steps below to set your alarms based on RSI oversold and overbought levels:
1) Add indicator to the chart
2) Go to settings
3) Choose up to 8 different symbols to get alert notification
4) Choose up to 4 different timeframes
5) Set overbought and oversold levels
6) Once all is set go back to the chart and click on 3 dots to set alert in this indicator, rename your alert and confirm
7) You can remove indicator after alert is set and it'll keep working as expected
What is does:
This indicator will generate alerts based on symbols, timeframes and RSI levels settings.
It will consider overbought and oversold levels to alert in each symbol and each timeframe selected. Once these levels are achieved it will send an alert with the following information:
- Symbol name (BTC, ETH, LTC)
- Specific RSI level achieved (e.g: RSI 30, RSI 70 or any custom level)
- Timeframe (e.g: 5m, 1h, 1D)
- Current symbol price
This script will request RSI OB/OS information through request.security() function from all different symbols and timeframes settings. It also requests symbols' price (close).
Due to Tradingview limitation (40 requests calls) it can only request information for 8 symbols for this script (8 symbols X 4 timeframes = 32 + 8 symbols' price (close) = 40)
Standard symbols are Binance USDT-M Futures but you can choose any symbol from Tradingview.
Standard timeframes are 5m|15m|1h|4h but you can choose from a list.
Standard overbought and oversold levels are 70 and 30 but you can change it to other integer values.
Feel free to give feedbacks on comments section below.
Enjoy!
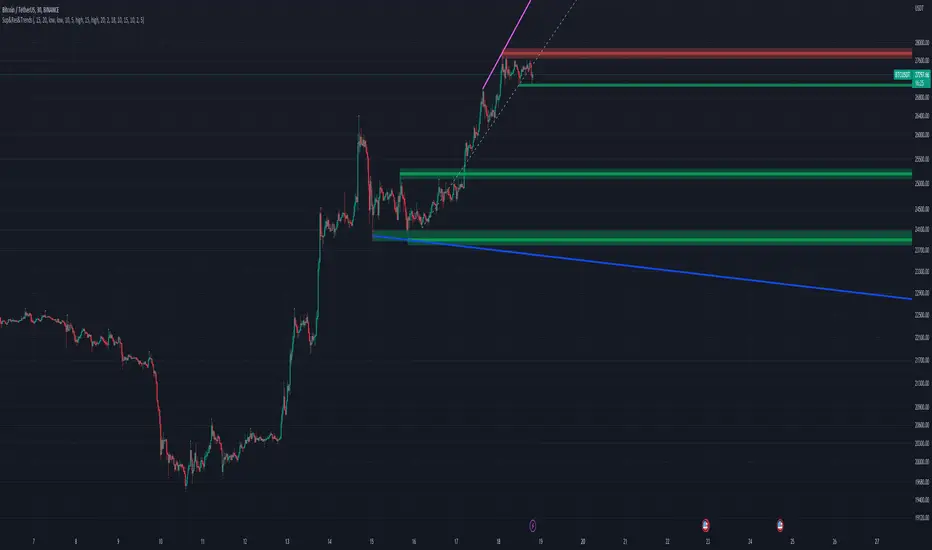
Flying Dragon Trend IndicatorFlying Dragon Trend Indicator can be used to indicate the trend on all timeframes by finetuning the input settings.
The Flying Dragon Trend family includes both the strategy and the indicator, where the strategy supports of selecting the optimal set of inputs for the indicator in each scenario. Highly recommended to get familiar with the strategy first to get the best out of the indicator.
Flying Dragon Trend plots the trend bands into the ribbon, where the colours indicate the trend of each band. The plotting of the bands can be turned off in the input settings. Based on the user selectable Risk Level the trend pivot indicator is shown for the possible trend pivot when the price crosses the certain moving average line, or at the Lowest risk level all the bands have the same colour. The trend pivot indicator is not shown on the Lowest risk level, but the colour of the trend bands is the indicator instead .
The main idea is to combine two different moving averages to cross each other at the possible trend pivot point, but trying to avoid any short term bounces to affect the trend indication. The ingenuity resides in the combination of selected moving average types, lengths and especially the offsets. The trend bands give visual hint for the user while observing the price interaction with the bands, one could say that when "the Dragon swallows the candles the jaws wide open", then there is high possibility for the pivot. The leading moving average should be fast while the lagging moving average should be, well, lagging behind the leading one. There is Offset selections for each moving average, three for leading one and one for the lagging one, those are where the magic happens. After user has selected preferred moving average types and lengths, by tuning each offset the optimal sweet spot for each timeframe and equity will be found. The default values are good enough starting points for longer (4h and up) timeframes, but shorter timeframes (minutes to hours) require different combination of settings, some hints are provided in tooltips. Basically the slower the "leading" moving average (like HMA75 or HMA115) and quicker the "lagging" moving average (like SMA12 or SMA5) become, the better performance at the Lowest risk level on minute scales. This "reversed" approach at the minute scales is shown also as reversed colour for the "lagging" moving average trend band, which seems to make it work surprisingly well.
The Flying Dragon Trend does not necessarily work well on zig zag and range bounce scenarios without additional finetuning of the input settings to fit the current condition.

Multi SMI Ergodic OscillatorThe Multi SMI Ergodic Oscillator (Multi SMIEO) indicator can be used to identify potential buy and sell signals based on the relationship between the TSI and EMA lines.
The script is creating an indicator that plots multiple (3) sets of Time Series Indicator (TSI-Indicator) and Exponential Moving Average (EMA-Signal) lines as a single indicator.
The TSI is a momentum oscillator that helps identify overbought and oversold conditions. It is calculated using the close prices of an asset, a short-term moving average, and a long-term moving average. The script uses three different pairs of input values for the short-term and long-term periods, which can be adjusted by the user.
The EMA is a type of moving average that gives more weight to recent prices. It is calculated by applying a weighting factor to the most recent price, and then adding that weighted value to the previous EMA value. The script uses three different input values for the length of the EMA, which can also be adjusted by the user.
After calculating the TSI and EMA for each set, the script plots them on the same graph, with different colors and widths to differentiate them. The three sets of TSI and EMA lines are plotted to allow the user to compare the results of different periods. The script also plots a horizontal line at zero, which is used as a reference point for the oscillations of the indicator lines.
One way to use this indicator is to look for crossovers between the TSI and the EMA lines. A bullish crossover occurs when the TSI crosses above the EMA. This suggests that the buying pressure is increasing and a potential buy signal is generated. A bearish crossover occurs when the TSI crosses below the EMA. This suggests that the selling pressure is increasing and a potential sell signal is generated.
Some other ways that the indicator can be used include:
1. Identifying trends: The TSI and EMA lines can be used to identify the direction of the trend. An uptrend is present when the TSI and EMA lines are both trending upwards, while a downtrend is present when the TSI and EMA lines are both trending downwards.
2. Overbought and oversold conditions: The TSI can be used to identify overbought and oversold conditions. When the TSI is above the upper limit of the range, the asset is considered overbought and may be due for a price correction. Conversely, when the TSI is below the lower limit of the range, the asset is considered oversold and may be due for a price rebound.
3. Confirming price action: The Multi SMIEO indicator can be used to confirm price action. If a bullish divergence is present, it confirms a potential bullish reversal. If a bearish divergence is present, it confirms a potential bearish reversal.
4. Multiple time frame analysis: By using different periods for the TSI and EMA lines, the indicator can be used to analyze the asset on multiple time frames. It can be useful to compare the results of different periods to get a better understanding of the asset's price movements.
5. Risk management: This indicator can be used as an element of risk management strategy, it can help traders to identify overbought and oversold conditions to set stop loss or take profit levels.
The Multi SMI Ergodic Oscillator (Multi SMIEO) is a versatile indicator that can be used in a number of ways to analyze the price movements of an asset. It can be used to identify potential buy and sell signals, trends, overbought and oversold conditions, and to confirm price action. By using different periods for the TSI and EMA lines, the indicator can also be used to analyze the asset on multiple time frames. However, it is important to remember that indicators are based on historical data, and past performance does not guarantee future results.
It is important to use the indicator as part of a comprehensive trading strategy that includes risk management and other analysis techniques, such as fundamental and technical analysis. It is also important to keep in mind that indicators are not a standalone solution for trading, they should be used in conjunction with other market analysis and research techniques to generate better results.
Lastly, it is important to keep in mind that trading in financial markets comes with a certain level of risk and it is crucial to always have a proper risk management plan in place. Never invest more than you can afford to lose.
