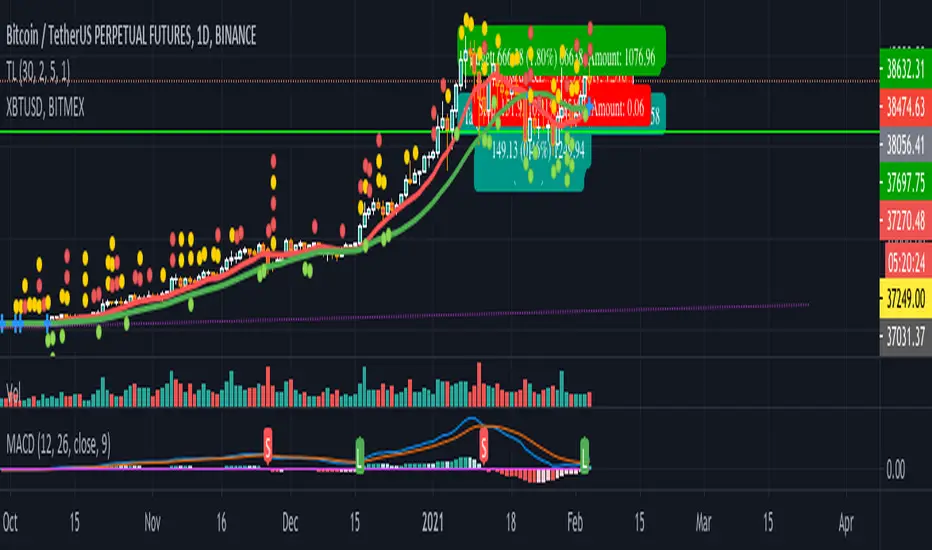
MACD signal with alert (long/short/close) for TV free accountSend MACD alert through email (available for free/pro user):
// 3 - buy
// -2 - short
// 0 - close position
// 1 - ignore
Example buy signal
Alert: STRAT3. BINANCE:BTCUSDTPERP, price = 31080
Example sell signal
Alert: STRAT-2. BINANCE:BTCUSDTPERP, price = 31080
Example close signal
Alert: STRAT0. BINANCE:BTCUSDTPERP, price = 31080
Example ignore signal
Alert: STRAT1. BINANCE:BTCUSDTPERP, price = 31080
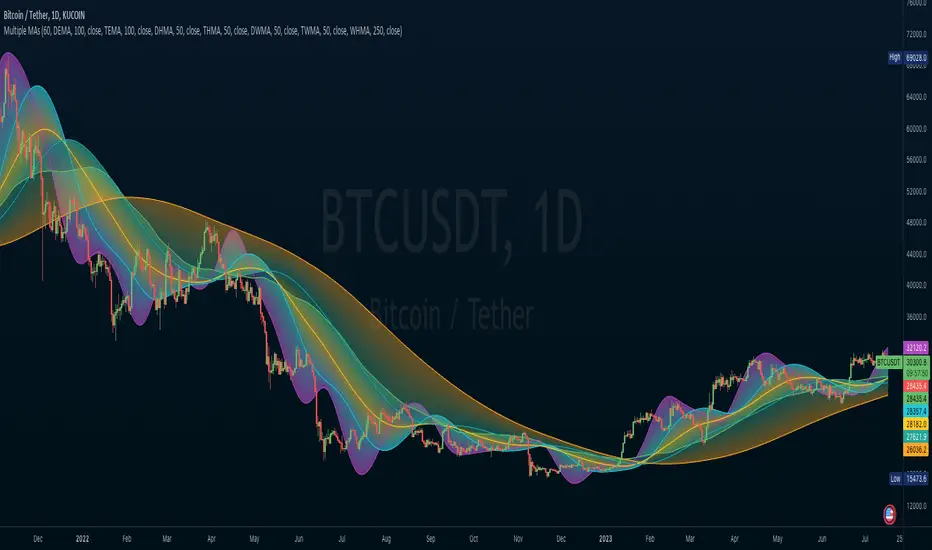
Multiple
Moving Average DoublesThis script plots multiple moving averages each source based on its previous MA, all having the same length.
Input options:
Simple Moving Average ( SMA ) or Exponential Moving Average ( EMA )
One adjustable look back period
Choose how many MA's to display, max. 50
One adjustable line width
It probably works best for long term views to find trends or zones of confluence, and it looks awesome :)
Don't be afraid to share your thoughts or settings in the comments. Enjoy!

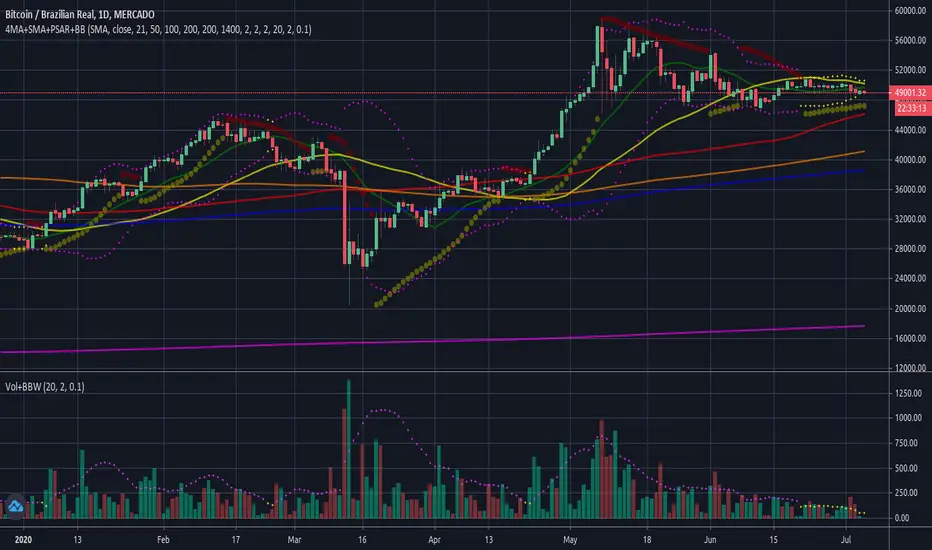
Moving Average ChannelThis indicator will use a moving average to create the channel around the price. It has some settings
Display Settings
Here it's possible to select what the indicator will display, from the middle line to the 3rd band level.
Reversion points will appear when the price cross out the selected band
Swing back option, when active, will make the indicator display the points when the price cross in the selected band
Moving Averages Settings
Here it's possible to select the moving averages settings that will be the basis for the channel calculation.
There are ten moving averages types t be selected, each one will give different entry points
Level Settings
Each level will apply the value on the moving average to get the level bands. All default numbers are from the Fibonacci sequence
When the extra filter is market, the indicator will display the crosses from the price and the selected band and also check if the candle closes in or out the bands.
That filter will check for a possible rejection of the price, providing more accurate movement indications, but fewer signals
Risk Management
In this part, it's possible to display stop loss and target profit levels based on the ATR indicator.
It's possible to select the multiplicator of the ATR to be applied on those levels

Multiple Timeframe Five Moving AveragesThis allows you to plot up to 5 moving averages on your chart at once. You can either use the chart's current timeframe or select a custom timeframe for your 5 moving averages (for example, you can see the 200DMA on your 4h chart without having to adjust the moving average length). You can also choose amongst SMA , EMA , and HULLMA for each MA.

Leavitt Convolutions Multicator - Jay Leavitt, Ph.D.Hot off the press, I present this next generation "Leavitt Convolutions Multicator" employing PSv4.0, originally formulated by Jay Leavitt, Ph.D. for TASC - January 2020 Traders Tips. Basically it's an all-in-one combination of three Leavitt indicators. This triplet indicator, being less than a 60 line implementation at initial release, is a heavily modified version of the original indicator using novel techniques, surpassing Leavitt's original intended design.
Utilizing the "Power of Pine", I included the maximum amount of features I could surmise in an ultra small yet powerful package. Configurations are displayed above in multiple scenarios that should be suitable for most traders.
Features List Includes:
Dark Background - Easily disabled in indicator Settings->Style for "Light" charts or with Pine commenting
AND much, much more... You have the source!
For those of you who are new to Pine Script, this script may also help you understand advanced programming techniques in Pine and how they may be utilized in a most effective manner. Most notably, the script shows how to potentially combine three indicators in one with Pine. This is commonly what my dense intricate code looks like behind the veil, and if you are wondering why there is no notes, that's because the notation is in the variable naming.
The comments section below is solely just for commenting and other remarks, ideas, compliments, etc... regarding only this indicator, not others. When available time provides itself, I will consider your inquiries, thoughts, and concepts presented below in the comments section, should you have any questions or comments regarding this indicator. When my indicators achieve more prevalent use by TV members, I may implement more ideas when they present themselves as worthy additions. As always, "Like" it if you simply just like it with a proper thumbs up, and also return to my scripts list occasionally for additional postings. Have a profitable future everyone!

Multiple MAsYou can set up to 5 moving averages (or more if you know how to edit the script), selecting from SMA, EMA, HMA, WMA, DEMA, TEMA or RMA. Select the source and the period for each MA.
Mayer Multiple [ChuckBanger]The Mayer Multiple is calculated by dividing the current price by 200-day moving average so you have to use daily charts fort it to work properly. This script is design to be a help for deciding when to buy Bitcoin and when it is time to sell your HODL position. This script uses moving average for optimal sell and buy points. In time of writing the average Mayer Multiple is 1.47 for the history of Bitcoin.

Multi Timeframe Bollinger BandsMulti Timeframe Bollinger Bands:
This script calculates and displays the Bollinger Bands for three different timeframes. The timeframes, moving averages and sigma values can be adjusted to personal likings. I publish this with an open visibility, feel free to tinker with it or suggest improvements.
Enjoy,
s0ullight

Function : Multiple Correlation
This script was written to calculate the correlation coefficient (Adjusted R-Squared) for one dependent and two independent variables.(3-way)
Pearson correlation method was used with exponential moving averages as the correlation calculation method.
Use your source ( i use "close" generally ) as the dependent variable.
Inspired by this article : www.real-statistics.com
The Adjusted R-Squared coefficient is used as output, but the R-Squared coefficient is also available in the code.
Adjusted R-Squared is often used for multiple correlations.
It also gives better results in large samples.
Here is the article about the difference of the two coefficients : www.investopedia.com
I wrote this function to increase the efficiency of my Dow Factor I used before.
When my research is over, I will apply the 3-factor correlation to my scripts.
I hope that I will achieve more efficient indicators and oscillators and even strategies.
In this command, I gave a few variable values and plotted them as an example.
I hope this function is useful in your work.
Finally, you can use periods as mutable variables.
The function is recovered from integer loads.
Best regards. Noldo

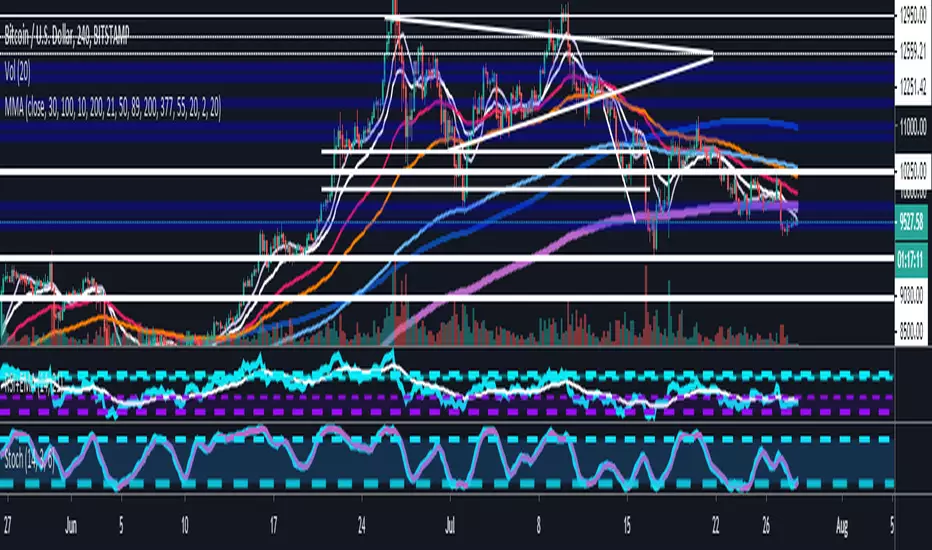
Multiple EMAs with marked zones and custom timeframe supportThis script plots 10 exponential moving averages and marks the areas between them.
The lengths are Fibonacci numbers starting from 5 and ending with 377.
The colors indicate the length of the moving average, green for the shortest and purple for the longest.
The zones between consecutive EMA's (e.g. 5 and 8 ema ) are market according to the color of the greater one in value.
By default the script plots values for the current time frame, but supports custom time frames.
I'm releasing this script with an open visibility. Feel free to suggest improvements!
Enjoy,
s0ullight

別府 Multiple Moving AveragesThis is yet another script that implements multiple moving averages into one indicator. It also identifies SMA golden crosses and candles where price goes above or below the 200 SMA. It also has a few EMAs and SMAs with configurable periods in case you want to try something out and need a weird EMA or SMA. The default EMAs and SMAs use 50, 100, and 200 periods.

[Maco] PUELL MULTIPLEReverse formulated what the closed source version is and releasing open source publicly to give back to the community.
If you have any questions feel free to join our Discord!

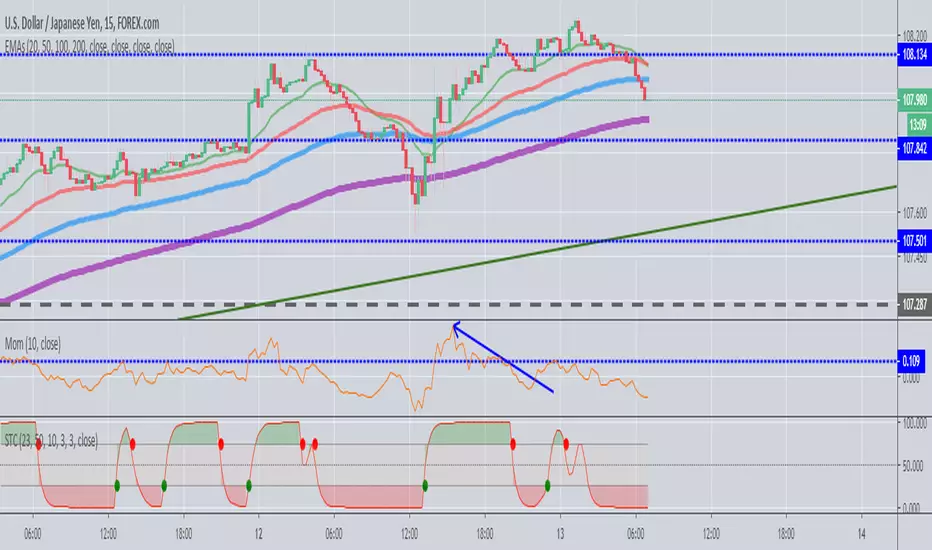
EMAs (20,50,100,200)Ability to plot EMAs (20,50,100,200) in single indicator and can be tweaked according to your trading style.
Multiple Moving AveragesThis is an indicator with 4 moving average slots and 6 exponential moving average slots
It also has bollinger bands and a volume weighted moving average slot
Feel free to edit this and add/remove some and publish your own
Fischy Bands (multiple periods)Just a quick way to have multiple periods. Coded at (14,50,100,200,400,600,800). Feel free to tweak it. Default is all on, obviously not as usable! Try just using 14, and 50.
This was generated with javascript for easy templating.
Source:
```
const periods = ;
const generate = (period) => {
const template = `
= bandFor(${period})
plot(b${period}, color=colorFor(${period}, b${period}), linewidth=${periods.indexOf(period)+1}, title="BB ${period} Basis", transp=show${period}TransparencyLine)
pb${period}Upper = plot(b${period}Upper, color=colorFor(${period}, b${period}), linewidth=${periods.indexOf(period)+1}, title="BB ${period} Upper", transp=show${period}TransparencyLine)
pb${period}Lower = plot(b${period}Lower, color=colorFor(${period}, b${period}), linewidth=${periods.indexOf(period)+1}, title="BB ${period} Lower", transp=show${period}TransparencyLine)
fill(pb${period}Upper, pb${period}Lower, color=colorFor(${period}, b${period}), transp=show${period}TransparencyFill)`
console.log(template);
}
console.log(`//@version=4
study(shorttitle="Fischy BB", title="Fischy Bands", overlay=true)
stdm = input(1.25, title="stdev")
bandFor(length) =>
src = hlc3
mult = stdm
basis = sma(src, length)
dev = mult * stdev(src, length)
upper = basis + dev
lower = basis - dev
`);
periods.forEach(e => console.log(`show${e} = input(title="Show ${e}?", type=input.bool, defval=true)`));
periods.forEach(e => console.log(`show${e}TransparencyLine = show${e} ? 20 : 100`));
periods.forEach(e => console.log(`show${e}TransparencyFill = show${e} ? 80 : 100`));
console.log(' ');
console.log(`colorFor(period, series) =>
c = period == 14 ? color.white :
period == 50 ? color.aqua :
period == 100 ? color.orange :
period == 200 ? color.purple :
period == 400 ? color.lime :
period == 600 ? color.yellow :
period == 800 ? color.orange :
color.black
c
`);
periods.forEach(e => generate(e))
```


Mayer Multiple with simple and weighted moving averageMayer Multiple developed by Trace Mayer gives the ratio of price to 200 daily moving average. Is intended for use on day chart only.
You may select between simple moving average (blue) or weighted moving average (pink). Each version of the Mayer Multiple has its own moving average to chart the trend of the indicator itself over time (shown in orange and green respectively for simple and weighted multiples).
All parameters are however freely configurable in settings.
The threshold value of 2.4 is set for Bitcoin and gives the level under which buys are more likely to lead to profit than not.

Triple Moving Averages with Bollinger BandsCombines 3 moving averages with Bollinger Bands. Each moving average can be configured to be SMA or EMA.

Multiple Moving AveragesThis script shows multiple moving averages and has an indicator when they are about to cross. Depending on the scale you probably will need to adjust the values to have a working cross indicator.
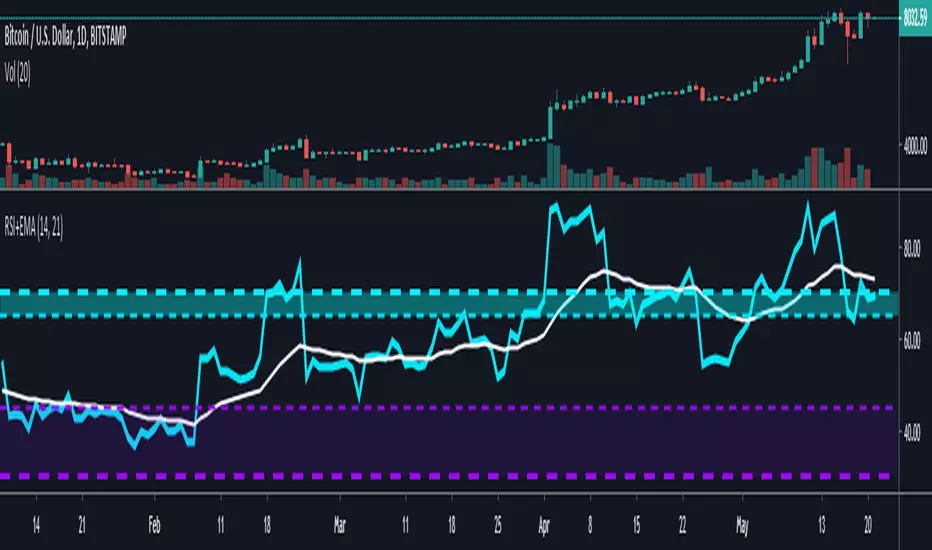
RSI + EMA with Multiple ZonesThis is your traditional RSI chart but with a few modifications
I added an extra zone parameter that you can specify with its own color and line customization.
There is an EMA that tracks the RSI as well.
Moving Average x10 (SMA, EMA)10 configurable Simple and Exponential moving averages combined in one indicator

Multiple MAs - 1ema, 4smaSimple script that allows you to customize the MA's length & color
(1) EMA - exponential moving average
(4) SMA - slow moving averages
Common SMA's are: 10, 50, 100, 200
