Multi EMA (10)Allows you to add and configure up to 10 EMAs to your chart with a single indicator. Enjoy.
Multiplemovingaverage

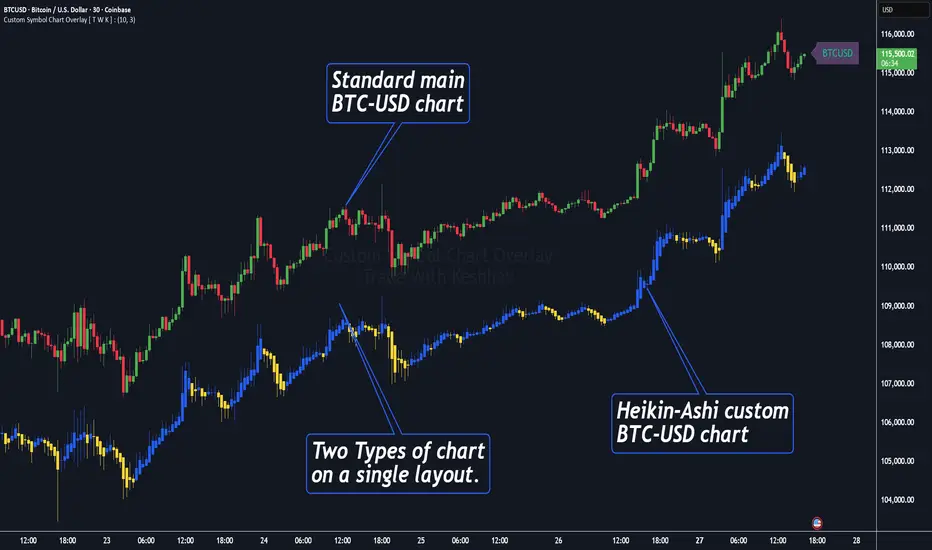
Custom Symbol Chart Overlay [ T W K ] :Custom Symbol Chart Overlay indicator for all types of Trading View account Users ❗
This Indicator has specially designed for apply Custom Symbol / Script on chart, in addition to current Live Chart symbol.
**No need for separate chart layout ( available for Paid Trading View users only! )
▫️▷ : # Indicator have settings for fetch the different Chart types (ex - Heikin-Ashi / standard) data and have the input for this.
all you need is to just select the Chart type. This setting allows user to apply different types of chart on single layout screen.
✔ (ex 1:- Standard current chart of BTCUSD ( SPOT ) with Custom Heikin-Ashi chart of BTCUSD ( PERPETUAL futures ).
✔ (ex 2:- Standard current chart of XAUUSD ( CFDs ) with Custom Standard chart of XAUUSD ( CFDs ) with MA / BB / ST input.
▫️▷ : It has 3 Moving average Lines, Bollinger Bands, and Super Trend input. (*Note:- all Inputs are customizable)
▫️▷ : # Indicator have ⏰ Alerts for automation trading ( #algo ) : Super Trend (3 conditions)
Usage:- This Indicator is helpful for apply Multiple symbols of different chart types on single layout screen.
Compatible with All Devices (Laptop / Mobile / Tablet / PC).
✅ HOW TO GET ACCESS :
Add to favorite and enjoy the true Trading View's sprit of community growth, without any limitations.
🔆If you like any of my Invite-Only indicators , kindly DM and let me know!
⚠ RISK DISCLAIMER :
All content provided by "@TradeWithKeshhav" is for informational & educational purposes only.
It does not constitute any financial advice or a solicitation to buy or sell any securities of any type. All investments / trading involve risks. Past performance does not guarantee future results / returns.
Regards :
Team @TradeWithKeshhav
Happy trading and investing!
Guppy MMA [Alpha Extract]A sophisticated trend-following and momentum assessment system that constructs dynamic trader and investor sentiment channels using multiple moving average groups with advanced scoring mechanisms and smoothed CCI-style visualizations for optimal market trend analysis. Utilizing enhanced dual-group methodology with threshold-based trend detection, this indicator delivers institutional-grade GMMA analysis that adapts to varying market conditions while providing high-probability entry and exit signals through crossover and extreme value detection with comprehensive visual mapping and alert integration.
🔶 Advanced Channel Construction
Implements dual-group architecture using short-term and long-term moving averages as foundation points, applying customizable MA types to reduce noise and score-based averaging for sentiment-responsive trend channels. The system creates trader channels from shorter periods and investor channels from longer periods with configurable periods for optimal market reaction zones.
// Core Channel Calculation Framework
maType = input.string("EMA", title="Moving Average Type", options= )
// Short-Term Group Construction
stMA1 = ma(close, st1, maType)
stMA2 = ma(close, st2, maType)
// Long-Term Group Construction
ltMA1 = ma(close, lt1, maType)
ltMA2 = ma(close, lt2, maType)
// Smoothing Application
smoothedavg = ma(overallAvg, 10, maType)
🔶 Volatility-Adaptive Zone Framework
Features dynamic score-based averaging that expands sentiment signals during strong trend periods and contracts during consolidation phases, preventing false signals while maintaining sensitivity to genuine momentum shifts. The dual-group averaging system optimizes zone boundaries for realistic market behavior patterns.
// Dynamic Sentiment Adjustment
shortTermAvg = (stScore1 + stScore2 + ... + stScore11) / 11
longTermAvg = (ltScore1 + ltScore2 + ... + ltScore11) / 11
// Dual-Group Zone Optimization
overallAvg = (shortTermAvg + longTermAvg) / 2
allMAAvg = (shortTermAvg * 11 + longTermAvg * 11) / 22
🔶 Step-Like Boundary Evolution
Creates threshold-based trend boundaries that update on smoothed average changes, providing visual history of evolving bullish and bearish levels with performance-optimized threshold management limited to key zones for clean chart presentation and efficient processing.
🔶 Comprehensive Signal Detection
Generates buy and sell signals through sophisticated crossover analysis, monitoring smoothed average interaction with zero-line and thresholds for high-probability entry and exit identification. The system distinguishes between trend continuation and reversal patterns with precision timing.
🔶 Enhanced Visual Architecture
Provides translucent zone fills with gradient intensity scaling, threshold-based historical boundaries, and dynamic background highlighting that activates upon trend changes. The visual system uses institutional color coding with green bullish zones and red bearish zones for intuitive market structure interpretation.
🔶 Intelligent Zone Management
Implements automatic trend relevance filtering, displaying signals only when smoothed average proximity warrants analysis attention. The system maintains optimal performance through smart averaging management and historical level tracking with configurable MA periods for various market conditions.
🔶 Multi-Dimensional Analysis Framework
Combines trend continuation analysis through threshold crossovers with momentum detection via extreme markers, providing comprehensive market structure assessment suitable for both trending and ranging market conditions with score-normalized accuracy.
🔶 Advanced Alert Integration
Features comprehensive notification system covering buy signals, sell signals, strong bull conditions, and strong bear conditions with customizable alert conditions. The system enables precise position management through real-time notifications of critical sentiment interaction events and zone boundary violations.
🔶 Performance Optimization
Utilizes efficient MA smoothing algorithms with configurable types for noise reduction while maintaining responsiveness to genuine market structure changes. The system includes automatic visual level cleanup and performance-optimized visual rendering for smooth operation across all timeframes.
This indicator delivers sophisticated GMMA-based market analysis through score-adaptive averaging calculations and intelligent group construction methodology. By combining dynamic trader and investor sentiment detection with advanced signal generation and comprehensive visual mapping, it provides institutional-grade trend analysis suitable for cryptocurrency, forex, and equity markets. The system's ability to adapt to varying market conditions while maintaining signal accuracy makes it essential for traders seeking systematic approaches to trend trading, momentum reversals, and sentiment continuation analysis with clearly defined risk parameters and comprehensive alert integration.

6 Moving Averages Difference TableIndicator Summary: 6 Moving Averages Difference Table (6MADIFF)
This TradingView indicator calculates and plots up to six distinct moving averages (MAs) directly on the price chart. Users have extensive control over each MA, allowing selection of:
Type: SMA, EMA, WMA, VWMA, HMA, RMA
Length: Any positive integer
Color: User-defined
Visibility: Can be toggled on/off
A core feature is the on-chart data table, designed to provide a quick overview of the relationships between the MAs and the price. This table displays:
$-MA Column: The absolute difference between the user-selected Input Source (e.g., Close, Open, HLC3) and the current value of each MA.
MA$ Column: The actual calculated price value of each MA for the current bar.
MA vs. MA Matrix: A grid showing the absolute difference between every possible pair of the calculated MAs (e.g., MA1 vs. MA2, MA1 vs. MA3, MA2 vs. MA5, etc.).
Customization Options:
Input Source: Select the price source (Open, High, Low, Close, HL2, HLC3, OHLC4) used for all MA calculations and the price difference column.
Table Settings: Control the table's visibility, position on the chart, text size, decimal precision for displayed values, and the text used for the column headers ("$-MA" and "MA$").
Purpose:
This indicator is useful for traders who utilize multiple moving averages in their analysis. The table provides an immediate, quantitative snapshot of:
How far the current price is from each MA.
The exact value of each MA.
The spread or convergence between different MAs.
This helps in quickly assessing trend strength, potential support/resistance levels based on MA clusters, and the relative positioning of short-term versus long-term averages.

Daily Moving Averages on Intraday ChartsThis moving average script displays the chosen 5 daily moving averages on intraday (minute) charts. It automatically adjusts the intervals to show the proper moving averages.
In a day there are 375 trading minutes from 9:15 AM to 3:30PM in Indian market. In 5 days there are 1875 minutes. For other markets adjust this data accordingly.
If 5DMA is chosen on a five minute chart the moving average will use 375 interval values (1875/5 = 375) of 5minute chart to calculate moving average. Same 5DMA on 25minute chart will use 75 interval values (1875/25 = 75).
On a 1minute chart the 5DMA plot will use 1875 interval values to arrive at the moving average.
Since tradingview only allows 5000 intervals to lookback, if a particular daily moving average on intraday chart needs more than 5000 candle data it won't be shown. E.g 200DMA on 5minute chart needs 15000 candles data to plot a correct 200DMA line. Anything less than that would give incorrect moving average and hence it won't be shown on the chart.
MA crossover for the first two MAs is provided. If you want to use that option, make sure you give the moving averages in the correct order.
You can enhance this script and use it in any way you please as long as you make it opensource on TradingView. Feedback and improvement suggestions are welcome.
Special thanks to @JohnMuchow for his moving averages script for all timeframes.

@tk · fractal emas█ OVERVIEW
This script is an indicator that plots short, medium and long moving averages for multiple fractals. This script was based on sharks EMAs by rlvs indicator, that plots multiple rays for each fractals into the chart. The main feature of this indicator is the customizability. The calculation itself is simple as moving average.
█ MOTIVATION
The trader can customize all aspects of the plotted data. The text size, extended line length, the moving average type — exponential, simple, etc... — the length of fractal rays, line style, line width and visibility. To keep minimalist, this indicator simplifies the logic of line colors based on the purpose of each moving averages. To prevent overnoise the chart with multiple lines with multiple colors for each fractal timefraes, the trader needs to keep in mind that the all lines with the "short" moving average color for example, will represents the short moving averages lines for all fractals. This logic is applied for medium and long moving averages either.
█ CONCEPT
The trading concept to use this indicator is to make entries on uptrend or downtrend pullbacks when the asset price reaches the short, medium or long moving averages price levels. But this strategy don't works alone. It needs to be aligned together with others indicators like RSI, Chart Patterns, Support and Resistance, and so on... Even more confluences that you have, bigger are your chances to increase the probability for a successful trade. So, don't use this indicator alone. Compose a trading strategy and use it to improve your analysis.
█ CUSTOMIZATION
This indicator allows the trader to customize the following settings:
GENERAL
Text size
Changes the font size of the labels to improve accessibility.
Type: string
Options: `tiny`, `small`, `normal`, `large`.
Default: `small`
SHORT
Type
Select the Short Moving Average calculation type.
Type: string
Options: `EMA`, `SMA`, `HMA`, `VWMA`, `WMA`.
Default: `EMA`
Length
Changes the base length for the Short Moving Average calculation.
Type: int
Default: 12
Source
Changes the base source for the Short Moving Average calculation.
Type: float
Default: close
Color
The base color that will represent the Short Moving Average.
Type: color
Default: color.rgb(255, 235, 59) (yellow)
Fractal Style
The fractal ray line style.
Type: string
Options: `dotted`, `dashed`, `solid`.
Default: `dotted`
Fractal Width
The fractal ray line width.
Type: string
Options: `1px`, `2px`, `3px`, `4px`.
Default: `1px`
Fractal Ray Length
The fractal ray line length.
Type: int
Default: 12
MEDIUM
Type
Select the Medium Moving Average calculation type.
Type: string
Options: `EMA`, `SMA`, `HMA`, `VWMA`, `WMA`.
Default: `EMA`
Length
Changes the base length for the Medium Moving Average calculation.
Type: int
Default: 26
Source
Changes the base source for the Medium Moving Average calculation.
Type: float
Default: close
Color
The base color that will represent the Short Moving Average.
Type: color
Default: color.rgb(0, 230, 118) (lime)
Fractal Style
The fractal ray line style.
Type: string
Options: `dotted`, `dashed`, `solid`.
Default: `dotted`
Fractal Width
The fractal ray line width.
Type: string
Options: `1px`, `2px`, `3px`, `4px`.
Default: `1px`
Fractal Ray Length
The fractal ray line length.
Type: int
Default: 12
LONG
Type
Select the Long Moving Average calculation type.
Type: string
Options: `EMA`, `SMA`, `HMA`, `VWMA`, `WMA`.
Default: `EMA`
Length
Changes the base length for the Long Moving Average calculation.
Type: int
Default: 200
Source
Changes the base source for the Long Moving Average calculation.
Type: float
Default: close
Color
The base color that will represent the Short Moving Average.
Type: color
Default: color.rgb(255, 82, 82) (red)
Fractal Style
The fractal ray line style.
Type: string
Options: `dotted`, `dashed`, `solid`.
Default: `dotted`
Fractal Width
The fractal ray line width.
Type: string
Options: `1px`, `2px`, `3px`, `4px`.
Default: `1px`
Fractal Ray Length
The fractal ray line length.
Type: int
Default: 12
VISIBILITY
Show Fractal Rays · (Short)
Shows short moving average fractal rays.
Type: bool
Default: true
Show Fractal Rays · (Medium)
Shows short moving average fractal rays.
Type: bool
Default: true
Show Fractal Rays · (Long)
Shows short moving average fractal rays.
Type: bool
Default: true
█ FUNCTIONS
The script contains the following functions:
`fn_labelizeTimeFrame`
Labelize timeframe period in minutes and hours.
Parameters:
tf: (string) Timeframe period to be labelized.
Returns: (string) Labelized timeframe string.
`fn_builtInLineStyle`
Converts simple string to built-in line style variable value.
Parameters:
lineStyle: (string) The line style simple string.
Returns: (string) Built-in line style string value.
`fn_builtInLineWidth`
Converts simple pixel string to line width number value.
Parameters:
lineWidth: (string) The line width pixel simple string.
Returns: (string) Built-in line width number value.
`fn_requestFractal`
Requests fractal data based on `period` given an expression.
Parameters:
period: (string) The period timeframe of fractal.
expression: (series float) The expression to retrieve data from fractal.
Returns: (mixed) A result determined by `expression`.
`fn_plotRay`
Plots line after chart bars.
Parameters:
y: (float) Y axis line position.
label: (string) Label to be ploted after line.
color: (color) Line and label color.
length: (int) Line length.
show: (bool) Flag to display the line. (default: `true`)
lineStyle: (string) Line style to be applied. (default: `line.style_dotted`)
lineWidth: (int) Line width. (default: `1`)
Returns: void
`fn_plotEmaRay`
Plots moving average line for a specific period.
Parameters:
period: (simple string) Period of fractal to retrieve
expression: (series float) The expression to retrieve data from fractal.
color: (color) Line and label color.
length: (int) Line length. (default: `12`)
show: (bool) Flag to display the line. (default: `true`)
lineStyle: (string) Line style to be applied. (default: `line.style_dotted`)
lineWidth: (string) Line width. (default: `1px`)
Returns: void
`fn_plotExtendedEmaRay`
Draws extended line for current timeframe moving average.
Parameters:
coordY: (float) Extended line Y axis position.
textValue: (simple string) Extended line label text.
textColor: (color) Extended line text color.
length: (int) Extended length. (default: `5`)
Returns: void

+ Multi-timeframe Multiple Moving Average LinesThis is a pretty simple script that plots lines for various moving averages (what I think are the most commonly used across all markets) of varying lengths of timeframes of the user's choosing. Timeframes range from 5 minutes up to one month, so regardless if you're a scalper or a swing trader there should be something here for you.
There are 8 lines (that can be turned on/off individually), which may seem like a lot, but if you use two averages and want to display four different timeframes for each, you can do that. The nice thing is that because the lines start plotting from the current bar they won't clutter up the screen. And obviously having moving averages from different timeframes on your chart makes price action more difficult to read (I mean sure, you can make them invisible, but who wants to do that all the time).
For each line there are two labels. One with the moving average type, and the other with its specific timeframe. I can't include the moving average length because it's not a string input. If anyone has a workaround for this, let me know, otherwise I would simply recommend setting different colors depending on the length, or if you only use one or two lengths and one or two moving averages this shouldn't be an issue. I had to use two labels because for the label text I couldn't include more than one string input, this is why there is an input for the 'moving average type label distance.'' You will want to adjust this depending on if you are trading crypto, futures, or forex because in some cases there may still be label overlap.
Pretty much everything else is self-explanatory.
I've added alerts. I might need to modify them if I can, because it would be nice for them to state the name and timeframe of the moving average. But I think this will do for now.
Enjoy!

Dragon Multi Moving Averages With labelThis script is for a many?! moving average strategy where the user can select from different types of moving averages, price sources, lookback periods and resolutions.
Features:
- 6 Moving Averages with variable MA types, periods, price sources, resolutions and the ability to disable each individually. Tow of moving averages are disable by default. you can enabel it
- Crossovers are plotted on the chart with detailed information regarding the crossover (Ex: 50 EMA crossed over 100 EMA ). there is only between 1-2, 2-3, 3-4, 4-5, 5-6 moving average cross label.
- Ribbons added and on by default. Optional setting to disable the ribbons. 5 ribbons between MA3 and MA4 and another 5 between MA4 and MA5 and another 5 between MA5 and MA6.

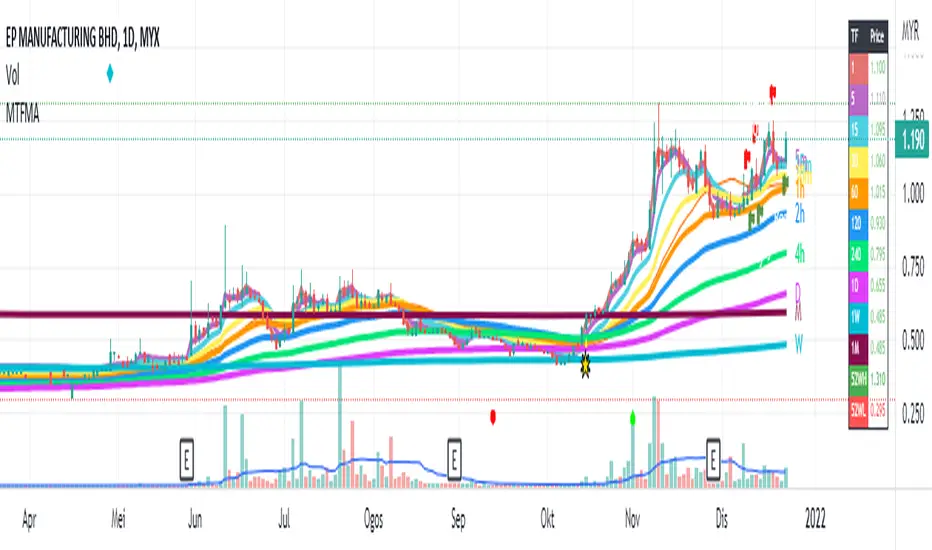
Multiple Timeframe (Moving Average) With InfoThis indicator combine 4 indicator in one pine script : Main indicator is Moving Average in multiple timeframes, Bollinger Band, Crossover Signal, Info Panel, 52Weeks High & 52 Weeks Low.
1)
For multiple moving average, it has 9 difference timeframes.
- Default timeframes is (1minute, 5minutes, 15minutes, 30minutes, 1hour, 4hours, 1Day, 1Week & 1Month). User also have choices to change the option.
- For Moving Average, there also available multiple choice of Moving Average : SMA , EMA , DEMA , VWMA , RMA, WMA . Default Moving Average is EMA (200)
- There also include info panel / table that show TF (Timeframes) for every MAs, & their price. Colors change according to current price. Bullish = Green, Neutral = Neutral, Bearish = Red
There are also function for user to turn on/off :
- (MA) Type & Lenght.
- Multiple MAs.
- Info / Table
User can use multiple line in daily chart to find support & resistance .
Example : For uptrend stock, candle close on top of EMA200 line for 1 hour timeframe. So it's can becomes immediate support, while the other EMAs on below is their next support.
Example :
For downtrend stock, candle close on top of EMA200 line for 5minutes timeframe. So it's become support, while the other EMAs on top is their resistance.
Example :
This Multiple MAs Inspired by xdecow :
www.tradingview.com
Checkout his Multi Timeframe Moving Average here :
2)
This indicator also have Bollingger Band. User have option to turn it on / off. User can use it as a target price if all the EMAs below the candle.
Example :
3)
This indicator also shown 52 Weeks High & 52 Weeks Low. User have option to turn it on / off. Their price also shown at the info panel.
Example :
4)
Crossover Signal. This crossover is default, it happen when candle close on top / near timeframe 5Minutes is (Ready). While candle close below timeframe 5Minutes is (Caution). User can choice other shape if they don't want the text label. To change the crossover for other setup, user can change it under = #2. The crossover only shown in past 10 candle.
Example :
Feel free to use it & comment. Thanks.
Moving Average Multitool CrossoverAs per request, this is a moving average crossover version of my original moving average multitool script .
It allows you to easily access and switch between different types of moving averages, without having to continuously add and remove different moving averages from your chart. This should make backtesting moving average crossovers much, much more easier. It also has the option to show buy and sell signals for the crossovers of the chosen moving averages.
It contains the following moving averages:
Exponential Moving Average (EMA)
Simple Moving Average (SMA)
Weighted Moving Average (WMA)
Double Exponential Moving Average (DEMA)
Triple Exponential Moving Average (TEMA)
Triangular Moving Average (TMA)
Volume-Weighted Moving Average (VWMA)
Smoothed Moving Average (SMMA)
Hull Moving Average (HMA)
Least Squares Moving Average (LSMA)
Kijun-Sen line from the Ichimoku Kinko-Hyo system (Kijun)
McGinley Dynamic (MD)
Rolling Moving Average (RMA)
Jurik Moving Average (JMA)
Arnaud Legoux Moving Average (ALMA)
Vector Autoregression Moving Average (VAR)
Welles Wilder Moving Average (WWMA)
Sine Weighted Moving Average (SWMA)
Leo Moving Average (LMA)
Variable Index Dynamic Average (VIDYA)
Fractal Adaptive Moving Average (FRAMA)
Variable Moving Average (VAR)
Geometric Mean Moving Average (GMMA)
Corrective Moving Average (CMA)
Moving Median (MM)
Quick Moving Average (QMA)
Kaufman's Adaptive Moving Average (KAMA)
Volatility-Adjusted Moving Average (VAMA)
Modular Filter (MF)

Moving Average MultitoolI made this script as a personal tool while backtesting multiple moving averages. It allows you to easily access and switch between different types of moving averages, without having to continuously add and remove different moving averages from your chart.
It also has the option to show the a 14 period average distance between the closing price of an asset and the selected moving average, as a multiple of ATR. This number can be shown by enabling the "Show ATR Between MA and Close" setting. The intention of this value is to quantify and compare the speed of different moving averages across any instrument and any timeframe. The higher the value, the slower the moving average. The lower the value, the faster the moving average.

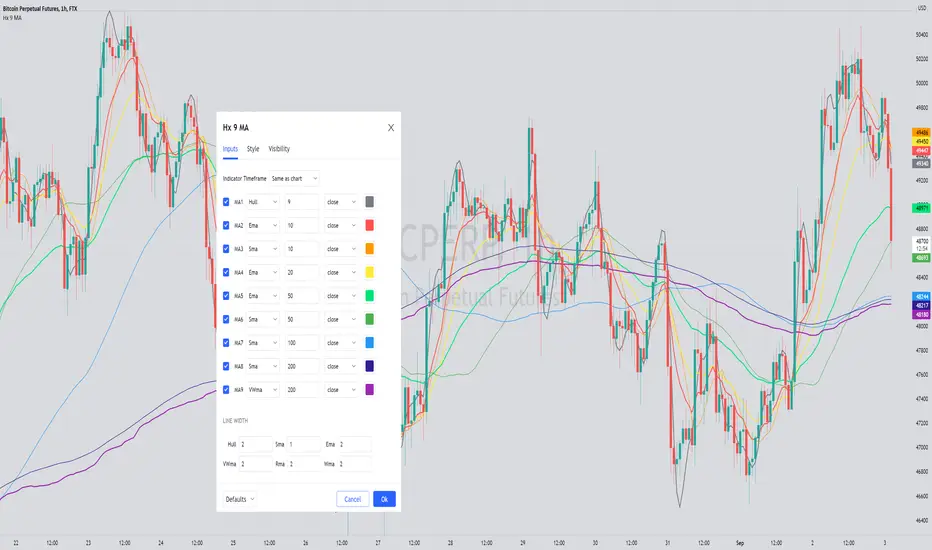
Hx 9 Moving AveragesThis script is designed to handle and provide quick and easy access to up to 9 different moving averages in one indicator and one tab.
Basically, it leverages the 'inline' and 'group' arguments of the 'input' function to provide you with a simple and straightforward way to:
- define your favorite moving averages by choosing type, length, source and color in the same tab and
- decide which moving averages to display in one click on a checkbox.
I do not like to have to select the color of an indicator in another tab. So, I put everything in the Inputs tab.
In addition, I like to "linewidth code" my moving averages so that a sma has a different thickness than an ema for example.
To do so, just define the line width that you want to associate with a moving average type in the "LINE WIDTH" section.
Once parameters are set to your liking, just check / uncheck the moving averages you want to display / hide (and save your settings as default).
This script handles 9 different moving averages and implements sma, wma, ema, vwma, rma (RSI) and hma (Hull).
It can easily be modified to change the number of available moving averages or include other types of moving averages.
The default settings provide an example of commonly used moving averages with associated colors ranked from Hot (more nervous) to Cold (less nervous) with the exception of Hull moving average displayed in gray.
These settings are just an example and are NOT meant to be used as a trading system! DYOR!
Hope it will be useful.
Enjoy and please let me know what you think in the comments.
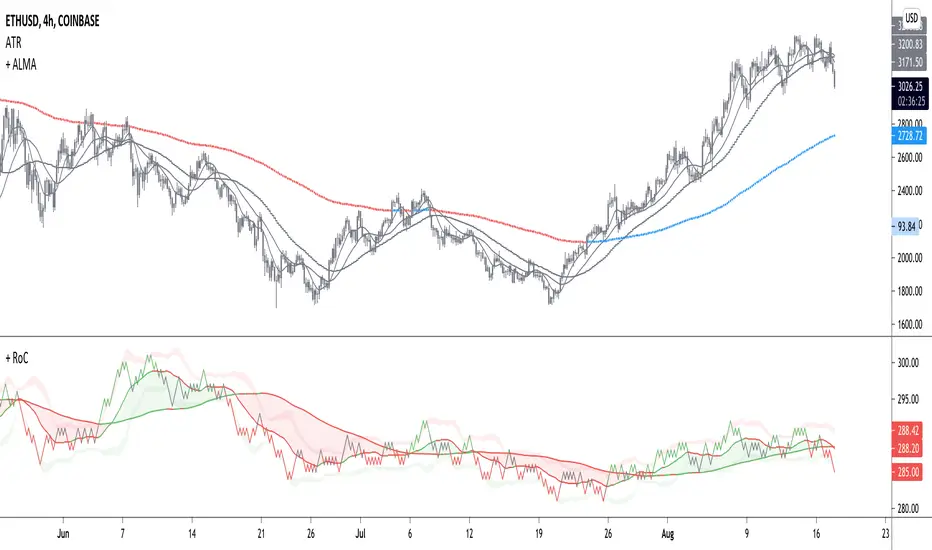
+ Rate of Change (and OBV)The Rate of Change, or RoC, is a momentum indicator that measures the percentage change in price between the current period and the price n periods ago. It oscillates above and below a zeroline, basically showing positive or negative momentum. I applied the OBV's calculation to it, but without the inclusion of volume (also added a lookback period) to see what would happen.
Actually what happened was I was looking at hot-rodding the OBV indicator, but then wondered if I could apply the cumulative calculation to another indicator to see what would happen. Not sure why I chose the Rate of Change, but it seemed a neat idea. And it worked! And so I called it the "Cumulative Rate of Change." I only recently realized that this is actually just the OBV without volume, HOWEVER the OBV does not have a lookback period, and its source is the close of each period. Basically, when you look at the calculation for the OBV you'll notice that it's a cumulative measure of the "change" of the closing price against the previous close times the volume. The Rate of Change is basically that measurement over more than one period, excluding the volume, and is not cumulative. Thus the "Cumulative Rate of Change" is basically an OBV without the volume but with the capability to adjust the lookback period.
Anyway, after days and weeks of playing with the indicator pretty infrequently I did decide that I actually really liked it, especially with the addition of moving averages and bollinger bands. So I decided to play with it a bit more.
I added a drop-down menu to include the standard Rate of Change indicator, and then thought I may as well add the OBV too, in case someone might like to compare that to the C-RoC, or just wants an OBV with myriad moving averages and bollinger bands.
By default I have the indicator set to the "C-RoC" and the lookback is set to 1, but play with longer settings (this is pretty much necessary if using the traditional RoC, which is by default set to 10 in TradingView, and is nigh on useless at 1).
I also recommend playing with the source. 'Close' is nice, but 'ohlc4' provides some very nice signals as well, as it follows the price flow for each period completely, filtering the noisiness of 'close' as source.
Hope you guys like this. With the bollinger bands and your preferred moving average settings this can be a powerful tool for re-entering trades in trend, taking profits, determining momentum swings.
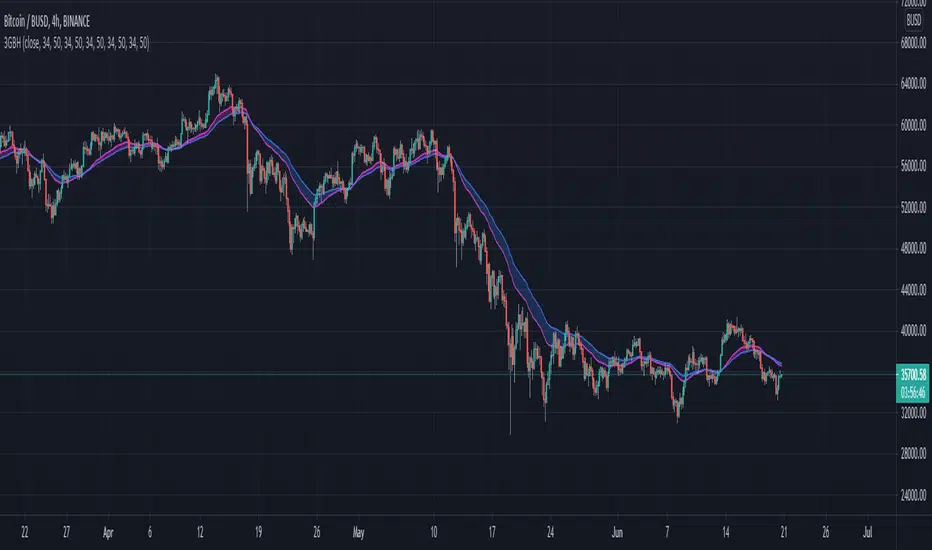
3GBH - Simple HMA'sIncluded in this indicator:
- 3x HMA w/ cloud
(Slow/Fast HMA)
(Signal HMA)
-----
User-friendly.
You can change all the inputs, they are labelled for ease-of-use.
You can toggle On/Off any or all of the options.

3GBH - CCI + HMAsCommodity Channel Index w/ Hull Moving Average's.
Included in this indicator:
- CCI
- 3x HMA's that use the CCI as the source.
-----
User-friendly.
You can change all the inputs, they are labelled for ease-of-use.
You can toggle On/Off any or all of the options.

3GBH - Multiple HMAIncluded in this indicator:
- 3 Hull Moving Averages
- High & Low background fill
-----
You can toggle On/Off, any or all of the HMA's.
-----
User-friendly.
You can change all the inputs, they are labelled for ease-of-use.
You can toggle On/Off any or all of the options.

3GBH - Multiple MA'sIncluded in this indicator:
- Fast/Slow EMA's
- Fast/Slow SMA's
- Fast/Slow WMA's
- Fast/Slow HMA's
- Fast/Slow RMA's
-----
Use of of the type of Moving Averages.
Or use them all.
-----
User-friendly.
You can change all the inputs, they are labelled for ease-of-use.
You can toggle On/Off any or all of the options.
5EMA with resolutionSimply 5 EMA's at once with chosable resolution on different TF instead of viewing at the moment. You can watch on 5m TF and use 1D EMA's for example

Equally Spaced MAThis indicator considers multiple moving averages as band rather than lines.
The band repeats divergence, convergence and reversal.
An evenly spaced moving average is a good way to capture this movement.
Set the interval instead of setting the period individually.
You can also choose the type of moving average.
- SMA
- WMA
- EMA
- HMA

Multiple Moving AveragesThis script adds up to 5 moving averages to your chart - and you can select which moving average type (and timeframe) you want to use for each.
The possible MA type options are:
EMA
SMA
HMA
WMA
DEMA
VWMA
VWAP
You can specify the length of each moving average, and you can override the type of all moving averages with the setting "ALL MA TYPE".
There is also higher-timeframe functionality, so you can select the timeframe for each moving average.
If the "Smooth HTF MA" setting is turned on then the script will fill any gaps in intraday price data by averaging the difference (giving it a regular smooth look), and if it's turned off then the HTF MAs will have a "stepped" look to them. Technically speaking, the non-smoothed setting is more accurate and so it's turned off by default.
And finally, the first option "Color MA 1" will change your first MA's color based on whether price action is above that MA's price or below it. If it's above it then the color turns green, if it's below it then it turns red.
If you set an MA's length to zero it will disable that MA.
The source code is protected but available on my website (link in my profile).
Enjoy! Good luck with your trading :) 😎

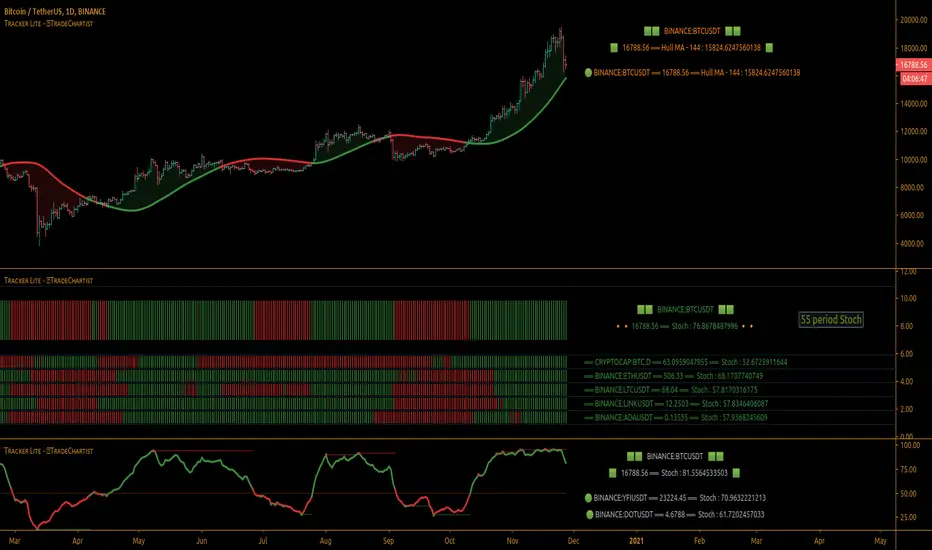
TradeChartist Tracker Lite™TradeChartist Tracker Lite is the lite version of ™TradeChartist Tracker and it is an essential real-time multi Indicator tracking toolkit that can be plotted as a standalone Indicator plot and/or a multi symbol tracker/screener for upto 5 different symbols . The indicators included in the tracker are Stochastic Oscillator, RSI , CCI , 10 different Moving Averages, MACD , Bollinger Bands %B, Net Volume and Heikin Ashi Trend.
===================================================================================================================
™𝗧𝗿𝗮𝗱𝗲𝗖𝗵𝗮𝗿𝘁𝗶𝘀𝘁 𝗧𝗿𝗮𝗰𝗸𝗲𝗿 𝗟𝗶𝘁𝗲 𝗨𝘀𝗲𝗿 𝗠𝗮𝗻𝘂𝗮𝗹
========================================
™TradeChartist Tracker Lite Plot Types
==================================
™TradeChartist Tracker Lite can be used to plot the following.
1. Indicator plot of Chart Symbol on its own, chosen from the 𝗜𝗻𝗱𝗶𝗰𝗮𝘁𝗼𝗿 𝗧𝘆𝗽𝗲 dropdown, enabling 𝐃𝐢𝐬𝐩𝐥𝐚𝐲 𝐈𝐧𝐝𝐢𝐜𝐚𝐭𝐨𝐫 𝐏𝐥𝐨𝐭 (𝐝𝐢𝐬𝐚𝐛𝐥𝐞𝐬 𝐓𝐫𝐚𝐜𝐤𝐞𝐫).
In this example Daily chart of XRP-USDT, 55 period Stochastic is tracked for the chart symbol XRP-USDT.
2. Indicator plot of a Symbol different from the Chart Symbol on its own, chosen from the 𝗜𝗻𝗱𝗶𝗰𝗮𝘁𝗼𝗿 𝗧𝘆𝗽𝗲 dropdown by enabling Tʀᴀᴄᴋ ᴀɴᴏᴛʜᴇʀ Sʏᴍʙᴏʟ's Iɴᴅɪᴄᴀᴛᴏʀ and entering the symbol name in the Sʏᴍʙᴏʟ ᴛᴏ Tʀᴀᴄᴋ input box, whilst keeping 𝐃𝐢𝐬𝐩𝐥𝐚𝐲 𝐈𝐧𝐝𝐢𝐜𝐚𝐭𝐨𝐫 𝐏𝐥𝐨𝐭 (𝐝𝐢𝐬𝐚𝐛𝐥𝐞𝐬 𝐓𝐫𝐚𝐜𝐤𝐞𝐫) enabled.
In this example Daily chart of XRP-USDT, 55 period Stochastic is tracked for the chart symbol BTC-USD.
3. Upto 5 Multiple Symbol Trackers for the Indicator chosen from the 𝗜𝗻𝗱𝗶𝗰𝗮𝘁𝗼𝗿 𝗧𝘆𝗽𝗲 dropdown, by disabling 𝐃𝐢𝐬𝐩𝐥𝐚𝐲 𝐈𝐧𝐝𝐢𝐜𝐚𝐭𝐨𝐫 𝐏𝐥𝐨𝐭 (𝐝𝐢𝐬𝐚𝐛𝐥𝐞𝐬 𝐓𝐫𝐚𝐜𝐤𝐞𝐫) and by entering the number of trackers required in the 𝐍𝐮𝐦𝐛𝐞𝐫 𝐨𝐟 𝐓𝐫𝐚𝐜𝐤𝐞𝐫𝐬 input box under 𝗧𝗿𝗮𝗰𝗸𝗲𝗿 𝗣𝗹𝗼𝘁𝘀 section. Upto 5 Symbols can be tracked and can be input by the user in the input boxes from Sʏᴍʙᴏʟ 1,...Sʏᴍʙᴏʟ 5 . 𝐃𝐢𝐬𝐩𝐥𝐚𝐲 𝐈𝐧𝐝𝐢𝐜𝐚𝐭𝐨𝐫 𝐏𝐥𝐨𝐭 (𝐝𝐢𝐬𝐚𝐛𝐥𝐞𝐬 𝐓𝐫𝐚𝐜𝐤𝐞𝐫) must be disabled for this plot type.
In this example Daily chart of Crypto Total Market Cap, Bollinger Bands %B is tracked for the chart symbol + 5 other Crypto symbols using Multi Symbol Trackers
4. Indicator Tracker labels can be plotted on Price chart by overlaying the Tracker on main chart and by switching from Separate Tracker Pane - Default to Tracker Labels only on Price Scale in the Lᴀʙᴇʟs Dɪsᴘʟᴀʏ Tʏᴘᴇ dropdown box.
In this example chart of 1hr XLM-USDT, Tracker labels of 55 EMA are plotted for 5 different symbols along with the 55 EMA plot of XLM-USDT.
===================================================================================================================
𝗜𝗻𝗱𝗶𝗰𝗮𝘁𝗼𝗿𝘀 𝗜𝗻𝗰𝗹𝘂𝗱𝗲𝗱 𝗶𝗻 ™𝗧𝗿𝗮𝗱𝗲𝗖𝗵𝗮𝗿𝘁𝗶𝘀𝘁 𝗧𝗿𝗮𝗰𝗸𝗲𝗿 𝗟𝗶𝘁𝗲
==================================================
1. Stochastic Oscillator
2. RSI
3. CCI
4. MA - (10 types included)
5. MACD
6. Bollinger Bands %B
7. Net Volume
8. Heikin Ashi Trend
All of the above indicators can be plotted as independent plots of the Chart Symbol or of a different symbol by enabling 𝐃𝐢𝐬𝐩𝐥𝐚𝐲 𝐈𝐧𝐝𝐢𝐜𝐚𝐭𝐨𝐫 𝐏𝐥𝐨𝐭 (𝐝𝐢𝐬𝐚𝐛𝐥𝐞𝐬 𝐓𝐫𝐚𝐜𝐤𝐞𝐫). Some Oscillators have the option of Pʟᴏᴛ Sᴛʏʟᴇ under their relevant sections, and can be plotted as line, area or a histogram.
Oscillators 1-6 require source price, lookback length and smoothing (where available) for the indicator plot. The colour of the tracker blocks is based on the Upper/Lower bands (where available), specified by the user in the respective sections. For example, if the RSI indicator is chosen to be plotted with Upper band at 60 and Lower band at 40 , the tracker blocks and the Indicator plot paint the values between 40 and 60 in neutral colour which can be changed from the settings.
Multi Window US30 example chart below with various indicators from ™TradeChartist Tracker Lite.
Moving Averages (MA) and MACD
------------------------------------------------------
Tracker Lite plots and tracks one of 10 Moving Averages that can be chosen from the MA ᴛʏᴘᴇ and by specifying the MA Lᴇɴɢᴛʜ .
MACD uses EMA as default for calculating the MACD plots and Tracker data using Fᴀsᴛ Lᴇɴɢᴛʜ , Sʟᴏᴡ Lᴇɴɢᴛʜ and Sᴍᴏᴏᴛʜɪɴɢ . To experiment or use a different Moving Average to calculate MACD , disable 𝐔𝐬𝐞 𝐄𝐌𝐀 (Uɴᴄʜᴇᴄᴋ ᴛᴏ ᴜsᴇ MA ғʀᴏᴍ ᴀʙᴏᴠᴇ) and select the required Moving Average from MA ᴛʏᴘᴇ drop down of the 𝟰. 𝗠𝗼𝘃𝗶𝗻𝗴 𝗔𝘃𝗲𝗿𝗮𝗴𝗲 section.
Net Volume and Heikin Ashi Trend
-------------------------------------------------------
Net Volume and Heikin Ashi Trend can be tracked and plotted for up to 5 symbols in addition to the chart symbol, but both Net Volume and Heikin Ashi Trend. Since the colour of the Net Volume depends on candle being bullish or bearish , it can help the user visualize if the current candle close of the symbol tracked is above or below the symbols's candle open.
Note: Bar Replay doesn't update the bar by bar indicator plot for historic bars for symbols other than the chart symbol. However, the Indicator Plot is perfectly usable for the realtime bar as data updates for both the Trackers and the indicator plot in realtime.
===================================================================================================================
𝗠𝘂𝗹𝘁𝗶 𝗦𝘆𝗺𝗯𝗼𝗹 𝗧𝗿𝗮𝗰𝗸𝗲𝗿𝘀/𝗟𝗮𝗯𝗲𝗹𝘀
=============================
Multi Symbol Tracker blocks continuously track the real-time indicator data of up to 5 symbols (in addition to the chart symbol) based on the number of Symbol Trackers preferred in the 𝐍𝐮𝐦𝐛𝐞𝐫 𝐨𝐟 𝐒𝐲𝐦𝐛𝐨𝐥 𝐓𝐫𝐚𝐜𝐤𝐞𝐫𝐬 (𝟎-𝟓) input box under the 𝗧𝗿𝗮𝗰𝗸𝗲𝗿 𝗣𝗹𝗼𝘁𝘀 section, and plots Bull, Bear and Neutral colour coded blocks based on both the indicator selected and settings preferred by the user under the relevant indicator section.
Multi Symbol Tracker Labels also continuously track the real-time indicator data in addition to the last close price (if 𝐒𝐡𝐨𝐰 𝐏𝐫𝐢𝐜𝐞 is enabled under 𝗧𝗿𝗮𝗰𝗸𝗲𝗿 𝗣𝗹𝗼𝘁𝘀 section), which helps user see the real-time changes in the indicator values and price changes of the symbols tracked.
The Tracker Label colours are exactly the same as the Tracker Block colours and are filtered based on the user preferred bands on the Oscillator values. For example, if the user prefers RSI upper band of 60 and lower band of 40 , the range between the values of 40 and 60 will be colour coded in neutral colour which can be changed from the 𝗨𝘀𝗲𝗳𝘂𝗹 𝗘𝘅𝘁𝗿𝗮𝘀 section of the indicator settings.
Note 1: Default settings are based on the Oscillator mid values. Using Upper and Lower bands for oscillators help spot the oversold and overbought zones and also helps spot breakout threshold based on Indicator values specified by the user. Example chart with visual depiction below using RSI .
===================================================================================================================
Frequently Asked Questions
========================
Q: When I load the ™TradeChartist Tracker Lite, why are the values in the labels blurred sometimes?
A: This happens occasionally as shown in the chart below, when the script is loaded for the first time or when a different setting is used.
To resolve this, just hide and unhide the script using the 👁 next to the Indicator title. If it is not visible, just hover the mouse/crosshair over the Indicator Title and it will be visible.
Q: Why does the indicator plot, tracker blocks and labels of Symbols being tracked, not update when I use Bar Replay?
A: As explained in the relevant sections above, historic data for bars and indicators other than chart symbol doesn't update on bar replay. But the chart symbol data does update for every bar on bar replay. This doesn't affect the real-time values and block colours for the symbols tracked.
Q: Can I track real-time values of a currently trading symbol when I'm on a symbol chart that is inactive? For example, can I see labels with real-time BTC values on a Sunday when I'm on a SPX chart when its not in session?
A: Simple answer is no. This is because, the plots are based on bar times of the chart and the symbols are tracked based on the bar time. So if the SPX session ended on Friday, the last known value of the BTC labels will be from Friday and hence it is always recommended to track symbols from a symbol chart that is in session.
Q: Does ™TradeChartist Tracker Lite repaint?
A: This indicator doesn't repaint but it is not recommended to trade a different symbol from the chart based on the real-time data alone without checking if the current symbol chart is in session as inactive price chart will not have updated data on symbols tracked. Also, bar replay doesn't work on data pulled from external symbol data than the chart symbol, but signals confirmed at candle close and confirmed by Tracker blocks with appropriate colour code will be in agreement with the respective indicator and can be double checked for building trust and confidence on the indicator. Also, the indicator is a good companion tool to track various indicators and prices, especially of symbols other than the chart symbol, but, to trade the symbol other than the chart symbol, user must refer to the respective chart.
Q: Can ™TradeChartist Tracker Lite be connected to other indicators as external source?
A: Yes. ™TradeChartist Tracker Lite can be connected to another script and there are several use cases in doing so. A couple of examples are shown below.
1. ™TradeChartist Tracker Lite Bollinger Bands %B 𝗜𝗻𝗱𝗶𝗰𝗮𝘁𝗼𝗿 𝗣𝗹𝗼𝘁 connected to ™TradeChartist Plotter to plot Divergences on the 4hr XAU-USD main price chart.
2. ™TradeChartist Tracker Lite 55 period Stochastic 𝗜𝗻𝗱𝗶𝗰𝗮𝘁𝗼𝗿 𝗣𝗹𝗼𝘁 connected to ™TradeChartist Plug and Trade as Oscillatory Signal with 0/0 to generate trade signals with Targets and performance information on trades.
More Example Charts
==================
===================================================================================================================
Best Practice: Test with different settings first using Paper Trades before trading with real money
The indicator is a good companion tool to track various indicators and prices, especially of symbols other than the chart symbol, but, to trade the symbol other than the chart symbol, user must refer to the respective chart.
===================================================================================================================
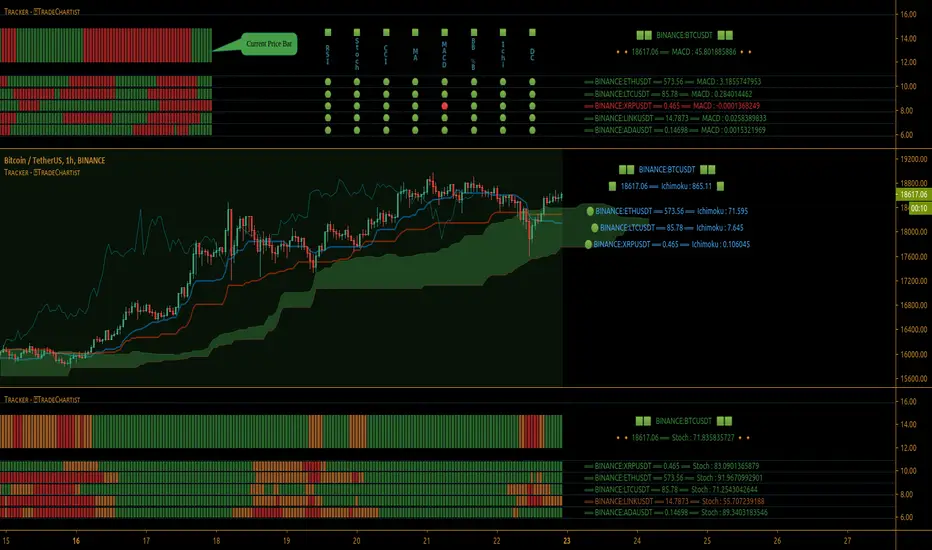
TradeChartist Tracker™𝗧𝗿𝗮𝗱𝗲𝗖𝗵𝗮𝗿𝘁𝗶𝘀𝘁 𝗧𝗿𝗮𝗰𝗸𝗲𝗿 is an essential real-time multi Indicator tracking toolkit that can be plotted as a standalone Indicator plot, a multi symbol tracker/screener for upto 10 different symbols and a visual scorecard for upto 5 different symbols. The indicators included in the tracker are Stochastic Oscillator, RSI, CCI, 15 different Moving Averages, MACD, Bollinger Bands %B (including Bollinger Bands and Breakout Signals), Ichimoku Cloud (including Breakout signals), Donchian Channels Oscillator (including Donchian Channels and Breakout Signals), Net Volume and Heikin Ashi Trend.
===================================================================================================================
™𝗧𝗿𝗮𝗱𝗲𝗖𝗵𝗮𝗿𝘁𝗶𝘀𝘁 𝗧𝗿𝗮𝗰𝗸𝗲𝗿 𝗨𝘀𝗲𝗿 𝗠𝗮𝗻𝘂𝗮𝗹
=====================================
™TradeChartist Tracker Plot Types
==============================
1. Indicator plot of Chart Symbol on its own , chosen from the 𝗜𝗻𝗱𝗶𝗰𝗮𝘁𝗼𝗿 𝗧𝘆𝗽𝗲 dropdown, enabling 𝐃𝐢𝐬𝐩𝐥𝐚𝐲 𝐈𝐧𝐝𝐢𝐜𝐚𝐭𝐨𝐫 𝐏𝐥𝐨𝐭 (𝐝𝐢𝐬𝐚𝐛𝐥𝐞𝐬 𝐓𝐫𝐚𝐜𝐤𝐞𝐫/𝐒𝐜𝐨𝐫𝐞𝐜𝐚𝐫𝐝).
In this example Daily chart of XRP-USDT, 55 period Stochastic is tracked for the chart symbol XRP-USDT.
2. Indicator plot of a Symbol different from the Chart Symbol , chosen from the 𝗜𝗻𝗱𝗶𝗰𝗮𝘁𝗼𝗿 𝗧𝘆𝗽𝗲 dropdown by enabling Tʀᴀᴄᴋ ᴀɴᴏᴛʜᴇʀ Sʏᴍʙᴏʟ's Iɴᴅɪᴄᴀᴛᴏʀ and entering the symbol name in the Sʏᴍʙᴏʟ ᴛᴏ Tʀᴀᴄᴋ input box, whilst keeping 𝐃𝐢𝐬𝐩𝐥𝐚𝐲 𝐈𝐧𝐝𝐢𝐜𝐚𝐭𝐨𝐫 𝐏𝐥𝐨𝐭 (𝐝𝐢𝐬𝐚𝐛𝐥𝐞𝐬 𝐓𝐫𝐚𝐜𝐤𝐞𝐫/𝐒𝐜𝐨𝐫𝐞𝐜𝐚𝐫𝐝) enabled.
In this example Daily chart of XRP-USDT, 55 period Stochastic is tracked for the BTC-USD (different from chart symbol XRP-USDT).
3. Tracker Plot of up to 10 Multiple Symbol Trackers for the Indicator chosen from the 𝗜𝗻𝗱𝗶𝗰𝗮𝘁𝗼𝗿 𝗧𝘆𝗽𝗲 dropdown, by disabling 𝐃𝐢𝐬𝐩𝐥𝐚𝐲 𝐈𝐧𝐝𝐢𝐜𝐚𝐭𝐨𝐫 𝐏𝐥𝐨𝐭 (𝐝𝐢𝐬𝐚𝐛𝐥𝐞𝐬 𝐓𝐫𝐚𝐜𝐤𝐞𝐫/𝐒𝐜𝐨𝐫𝐞𝐜𝐚𝐫𝐝) and by entering the number of trackers required in the 𝐍𝐮𝐦𝐛𝐞𝐫 𝐨𝐟 𝐓𝐫𝐚𝐜𝐤𝐞𝐫𝐬 input box under 𝗧𝗿𝗮𝗰𝗸𝗲𝗿 𝗣𝗹𝗼𝘁𝘀 section. Upto 10 Symbols can be tracked and can be input by the user in the input boxes from Sʏᴍʙᴏʟ 1,...Sʏᴍʙᴏʟ 10 . 𝐃𝐢𝐬𝐩𝐥𝐚𝐲 𝐈𝐧𝐝𝐢𝐜𝐚𝐭𝐨𝐫 𝐏𝐥𝐨𝐭 (𝐝𝐢𝐬𝐚𝐛𝐥𝐞𝐬 𝐓𝐫𝐚𝐜𝐤𝐞𝐫/𝐒𝐜𝐨𝐫𝐞𝐜𝐚𝐫𝐝) must be disabled for this plot type.
In this example Daily chart of Crypto Total Market Cap, Bollinger Bands %B is tracked for the chart symbol + 10 other Crypto symbols using Multi Symbol Trackers
4. Visual Scorecards of up to 5 Symbols for 8 indicators (all except Net Volume and HA Trend) can be plotted with real-time data by enabling 𝗗𝗶𝘀𝗽𝗹𝗮𝘆 𝗩𝗶𝘀𝘂𝗮𝗹 𝗦𝗰𝗼𝗿𝗲𝗰𝗮𝗿𝗱 - (𝟓 𝐓𝐫𝐚𝐜𝐤𝐞𝐫𝐬 𝐋𝐢𝐦𝐢𝐭). 𝐃𝐢𝐬𝐩𝐥𝐚𝐲 𝐈𝐧𝐝𝐢𝐜𝐚𝐭𝐨𝐫 𝐏𝐥𝐨𝐭 (𝐝𝐢𝐬𝐚𝐛𝐥𝐞𝐬 𝐓𝐫𝐚𝐜𝐤𝐞𝐫/𝐒𝐜𝐨𝐫𝐞𝐜𝐚𝐫𝐝) must be disabled for this plot type.
For the same example Daily chart of Crypto Total Market Cap as above, Visual Scorecard is plotted for 5 Symbols as shown.
5. Indicator Tracker labels can be plotted on Price chart by overlaying the Tracker on main chart and by switching from Separate Tracker Pane - Default to Tracker Labels only on Price Scale in the Lᴀʙᴇʟs Dɪsᴘʟᴀʏ Tʏᴘᴇ dropdown box.
In this example chart of 1hr XLM-USDT, Tracker labels of 55 EMA are plotted for 10 different symbols along with the 55 EMA plot of XLM-USDT.
Indicator plot that doesn't fit on price scale can be visualised using a second Tracker added to chart as shown in the ETH-USDT example below tracking Net Volume.
===================================================================================================================
𝗜𝗻𝗱𝗶𝗰𝗮𝘁𝗼𝗿𝘀 𝗜𝗻𝗰𝗹𝘂𝗱𝗲𝗱 𝗶𝗻 ™𝗧𝗿𝗮𝗱𝗲𝗖𝗵𝗮𝗿𝘁𝗶𝘀𝘁 𝗧𝗿𝗮𝗰𝗸𝗲𝗿
==============================================
1. Stochastic Oscillator
2. RSI
3. CCI
4. MA - (15 types included)
5. MACD
6. Bollinger Bands %B + Optional plots of Bollinger Bands and Breakout Signals
7. Ichimoku Cloud Oscillator + Optional plots of Ichimoku Cloud and Breakout Signals
8. Donchian Channels + Optional plots of Donchian Channels and Breakout Signals
9. Net Volume
10. Heikin Ashi Trend
All of the above indicators can be plotted as independent plots of the Chart Symbol or of a different symbol by enabling 𝐃𝐢𝐬𝐩𝐥𝐚𝐲 𝐈𝐧𝐝𝐢𝐜𝐚𝐭𝐨𝐫 𝐏𝐥𝐨𝐭 (𝐝𝐢𝐬𝐚𝐛𝐥𝐞𝐬 𝐓𝐫𝐚𝐜𝐤𝐞𝐫/𝐒𝐜𝐨𝐫𝐞𝐜𝐚𝐫𝐝). Some Oscillators have the option of Pʟᴏᴛ Sᴛʏʟᴇ under their relevant sections, and can be plotted as line, area or a histogram.
Oscillators 1-8 (except 4) require source price, lookback length and smoothing (where available) for the indicator plot. The colour of the tracker blocks is based on the Upper/Lower bands (where available), specified by the user in the respective sections. For example, if the RSI indicator is chosen to be plotted with Upper band at 60 and Lower band at 40, the tracker blocks and the Indicator plot paint the values between 40 and 60 in neutral colour which can be changed from the settings.
Multi Window BTC-USDT 1hr example chart below with various indicators from ™TradeChartist Tracker.
Note: The tracker colour is exactly colour of the Indicator Plot. The Visual Scorecard , however uses the mid values and doesn't take into account the bands specified by the user. For example, RSI score is green on the Visual Scorecard as long as RSI is above 50 and doesn't get affected by the user specified upper/lower band and this applies to all Oscillators. This is shown in the 1hr BTC-USDT chart below.
Moving Averages (MA) and MACD
------------------------------------------------------
Tracker plots and tracks one of 15 Moving Averages that can be chosen from the MA ᴛʏᴘᴇ and by specifying the MA Lᴇɴɢᴛʜ .
MACD uses EMA as default for calculating the MACD plots and Tracker data using Fᴀsᴛ Lᴇɴɢᴛʜ , Sʟᴏᴡ Lᴇɴɢᴛʜ and Sᴍᴏᴏᴛʜɪɴɢ . To experiment or use a different Moving Average to calculate MACD, disable 𝐔𝐬𝐞 𝐄𝐌𝐀 (Uɴᴄʜᴇᴄᴋ ᴛᴏ ᴜsᴇ MA ғʀᴏᴍ ᴀʙᴏᴠᴇ) and select the required Moving Average from MA ᴛʏᴘᴇ drop down of the 𝟰. 𝗠𝗼𝘃𝗶𝗻𝗴 𝗔𝘃𝗲𝗿𝗮𝗴𝗲 section.
Bollinger Bands %B + Optional plots of Bollinger Bands and Breakout Signals
---------------------------------------------------------------------------------------------------------------------------
Bollinger Bands %B is a companion oscillator for Bollinger Bands and helps depict where the price is, in relation to the Bollinger Bands. To plot the actual Bollinger Bands, enable Dɪsᴘʟᴀʏ Bᴏʟʟɪɴɢᴇʀ Bᴀɴᴅs and to plot the Bollinger Bands Breakout Signals, enable Sʜᴏᴡ BB Bʀᴇᴀᴋᴏᴜᴛ Sɪɢɴᴀʟs , with 𝐃𝐢𝐬𝐩𝐥𝐚𝐲 𝐈𝐧𝐝𝐢𝐜𝐚𝐭𝐨𝐫 𝐏𝐥𝐨𝐭 (𝐝𝐢𝐬𝐚𝐛𝐥𝐞𝐬 𝐓𝐫𝐚𝐜𝐤𝐞𝐫/𝐒𝐜𝐨𝐫𝐞𝐜𝐚𝐫𝐝) enabled.
Ichimoku Cloud Oscillator + Optional plots of Ichimoku Cloud and Breakout Signals
------------------------------------------------------------------------------------------------------------------------------------
Ichimoku Cloud Oscillator helps visualize the current price in relation to the breakout support/resistance of the Ichimoku Cloud using strict Ichimoku Cloud criteria (including Chikou Span agreeing with the breakout etc.). To plot the actual Ichimoku Cloud, enable Dɪsᴘʟᴀʏ Iᴄʜɪᴍᴏᴋᴜ Cʟᴏᴜᴅ and to plot the Kumo Breakout Signals, enable Sʜᴏᴡ Kᴜᴍᴏ Bʀᴇᴀᴋᴏᴜᴛ Sɪɢɴᴀʟs , with 𝐃𝐢𝐬𝐩𝐥𝐚𝐲 𝐈𝐧𝐝𝐢𝐜𝐚𝐭𝐨𝐫 𝐏𝐥𝐨𝐭 (𝐝𝐢𝐬𝐚𝐛𝐥𝐞𝐬 𝐓𝐫𝐚𝐜𝐤𝐞𝐫/𝐒𝐜𝐨𝐫𝐞𝐜𝐚𝐫𝐝) enabled.
Cloud Settings form the fundamental factor for this indicator to detect the breakouts. The settings for the Ichimoku Cloud is Automatic (detects right settings for the symbol type) by default, but this can be changed to Classic or 24/7 Crypto , based on the user preference from the settings under 𝐂𝐥𝐨𝐮𝐝 𝐓𝐲𝐩𝐞, which also includes a manual input option. Ichimoku traders can experiment different settings combinations under manual settings to suit their trading frequency and timeframe traded.
Donchian Channels + Optional plots of Donchian Channels and Breakout Signals
-------------------------------------------------------------------------------------------------------------------------------
Donchian Channels comprises of three plots - a upper band, a lower band and a mean line (or mid line of the channel). The upper band is based on highest high of N periods specified by the user and the lower band is based on the lowest low of N periods specified by the user. These channels help spot price breaching high or low of last N periods clearly, thereby aiding the trader to understand the price action of any symbol better on any given timeframe.
Donchian Channels Oscillator helps visualize the current price in relation to the Mean line of the Donchian Channels of user specified lookback period (specified in the Dᴏɴᴄʜɪᴀɴ Cʜᴀɴɴᴇʟ Lᴇɴɢᴛʜ input box). The sensitivity of the oscillator can be adjusted using smoothing factor in the Sᴍᴏᴏᴛʜɪɴɢ input box. To plot the actual Donchian Channels, enable Dɪsᴘʟᴀʏ Dᴏɴᴄʜɪᴀɴ Cʜᴀɴɴᴇʟs and to plot the Donchian Channels Breakout Signals, enable Sʜᴏᴡ DC Bʀᴇᴀᴋᴏᴜᴛ Sɪɢɴᴀʟs , with 𝐃𝐢𝐬𝐩𝐥𝐚𝐲 𝐈𝐧𝐝𝐢𝐜𝐚𝐭𝐨𝐫 𝐏𝐥𝐨𝐭 (𝐝𝐢𝐬𝐚𝐛𝐥𝐞𝐬 𝐓𝐫𝐚𝐜𝐤𝐞𝐫/𝐒𝐜𝐨𝐫𝐞𝐜𝐚𝐫𝐝) enabled.
Note: Using smoothing factor more than 1 doesn't reflect the actual Donchian Channels Mean line and also impacts the Tracker block colours.
Net Volume and Heikin Ashi Trend
-------------------------------------------------------
Net Volume and Heikin Ashi Trend can be tracked and plotted for up to 10 symbols in addition to the chart symbol, but both Net Volume and Heikin Ashi Trend are not included in the Visual Scorecard. Since the colour of the Net Volume depends on candle being bullish or bearish, it can help the user visualize if the current candle close of the symbol tracked is above or below the symbols's candle open.
Note: Bar Replay doesn't update the bar by bar indicator plot for historic bars for symbols other than the chart symbol. However, the Indicator Plot is perfectly usable for the realtime bar as data updates for both the Trackers and the Scorecard in realtime.
===================================================================================================================
𝗩𝗶𝘀𝘂𝗮𝗹 𝗦𝗰𝗼𝗿𝗲𝗰𝗮𝗿𝗱
=================
Visual Scorecard plots a green Bull or a red Bear Score colour plot for each Indicator from RSI to Donchian Channels Oscillator against every symbol tracked for up to 5 symbols max (First 5 symbols under 𝗧𝗿𝗮𝗰𝗸𝗲𝗿 𝗣𝗹𝗼𝘁𝘀 section). The gap between the scores can be adjusted using gap factor under Gᴀᴘ Fᴀᴄᴛᴏʀ ʙᴇᴛᴡᴇᴇɴ Sᴄᴏʀᴇs dropdown.
Visual Scorecard scoring method
----------------------------------------------------
RSI > 50 - 🟢
RSI < 50 - 🔴
Stoch > 50 - 🟢
Stoch < 50 - 🔴
CCI > 0 - 🟢
CCI < 0 - 🔴
Close price above MA plot - 🟢
Close price below MA plot - 🔴
MACD > 0 - 🟢
MACD < 0 - 🔴
Bollinger Bands %B > 50 - 🟢
Bollinger Bands %B < 50 - 🔴
Ichimoku Bullish Kumo Trend - 🟢
Ichimoku Bearish Kumo Trend - 🔴
Donchian Channels Oscillator > 0 (or close price above DC Mean Line) - 🟢
Donchian Channels Oscillator < 0 (or close price below DC Mean Line) - 🔴
Note: Bar Replay doesn't update the bar by bar scores/tracker data for historic bars for symbols other than the chart symbol. However, the Scorecard is perfectly usable for the realtime bar as data updates for both the Trackers and the Scorecard in realtime.
===================================================================================================================
𝗠𝘂𝗹𝘁𝗶 𝗦𝘆𝗺𝗯𝗼𝗹 𝗧𝗿𝗮𝗰𝗸𝗲𝗿𝘀/𝗟𝗮𝗯𝗲𝗹𝘀
=============================
Multi Symbol Tracker blocks continuously track the real-time indicator data of up to 10 symbols (in addition to the chart symbol) based on the number of Symbol Trackers preferred in the 𝐍𝐮𝐦𝐛𝐞𝐫 𝐨𝐟 𝐒𝐲𝐦𝐛𝐨𝐥 𝐓𝐫𝐚𝐜𝐤𝐞𝐫𝐬 (𝟎-𝟏𝟎) input box under the 𝗧𝗿𝗮𝗰𝗸𝗲𝗿 𝗣𝗹𝗼𝘁𝘀 section, and plots Bull, Bear and Neutral colour coded blocks based on both the indicator selected and settings preferred by the user under the relevant indicator section.
Multi Symbol Tracker Labels also continuously track the real-time indicator data in addition to the last close price (if 𝐒𝐡𝐨𝐰 𝐏𝐫𝐢𝐜𝐞 is enabled under 𝗧𝗿𝗮𝗰𝗸𝗲𝗿 𝗣𝗹𝗼𝘁𝘀 section), which helps user see the real-time changes in the indicator values and price changes of the symbols tracked.
The Tracker Label colours are exactly the same as the Tracker Block colours and are filtered based on the user preferred bands on the Oscillator values. This is slightly different to the Visual Scorecard Colour coding as the range between the user preferred bands is colour coded in a neutral colour, whereas the Scorecard uses only Bull and Bear Colours as explained in the 𝗩𝗶𝘀𝘂𝗮𝗹 𝗦𝗰𝗼𝗿𝗲𝗰𝗮𝗿𝗱 heading above. For example, if the user prefers RSI upper band of 60 and lower band of 40, the range between the values of 40 and 60 will be colour coded in neutral colour which can be changed from the 𝗨𝘀𝗲𝗳𝘂𝗹 𝗘𝘅𝘁𝗿𝗮𝘀 section of the indicator settings.
Note 1: Default settings are based on the Oscillator mid values and hence the Tracker Blocks match with the Visual Scorecard colour codes. Using Upper and Lower bands for oscillators help spot the oversold and overbought zones and also helps spot breakout threshold based on Indicator values specified by the user. Example chart with visual depiction below using RSI.
Note 2: Bar Replay doesn't update the bar by bar scores/tracker data for historic bars for symbols other than the chart symbol. However, the Tracker blocks/labels are perfectly usable for the realtime bar as data updates for both the Trackers and the Scorecard in realtime.
===================================================================================================================
Frequently Asked Questions
========================
Q: When I load the ™TradeChartist Tracker, why are the values in the labels blurred sometimes?
A: This happens occasionally as shown in the chart below, when the script is loaded for the first time or when a different setting is used.
To resolve this, just hide and unhide the script using the 👁 next to the Indicator title. If it is not visible, just hover the mouse/crosshair over the Indicator Title and it will be visible.
Q: Why does the indicator plot, tracker blocks and labels of Symbols being tracked, not update when I use Bar Replay?
A: As explained in the relevant sections above, historic data for bars and indicators other than chart symbol doesn't update on bar replay. But the chart symbol data does update for every bar on bar replay. This doesn't affect the real-time values and block colours for the symbols tracked.
Q: Can I track real-time values of a currently trading symbol when I'm on a symbol chart that is inactive? For example, can I see labels with real-time BTC values on a Sunday when I'm on a SPX chart when its not in session?
A: Simple answer is no. This is because, the plots are based on bar times of the chart and the symbols are tracked based on the bar time. So if the SPX session ended on Friday, the last known value of the BTC labels will be from Friday and hence it is always recommended to track symbols from a symbol chart that is in session.
Q: Does ™TradeChartist Tracker repaint?
A: This indicator doesn't repaint but it is not recommended to trade a different symbol from the chart based on the real-time data alone without checking if the current symbol chart is in session as inactive price chart will not have updated data on symbols tracked. Also, bar replay doesn't work on data pulled from external symbol data than the chart symbol, but signals confirmed at candle close and confirmed by Tracker blocks with appropriate colour code will be in agreement with the respective indicator and can be double checked for building trust and confidence on the indicator.
Q: Can ™TradeChartist Tracker be connected to other indicators as external source?
A: Yes. ™TradeChartist Tracker can be connected to another script and there are several use cases in doing so. A couple of examples are shown below.
1. ™TradeChartist Tracker 's Bollinger Bands %B 𝗜𝗻𝗱𝗶𝗰𝗮𝘁𝗼𝗿 𝗣𝗹𝗼𝘁 connected to ™TradeChartist Plotter to plot Divergences on the 4hr XAU-USD main price chart.
2. ™TradeChartist Tracker 's 𝐁𝐫𝐞𝐚𝐤𝐨𝐮𝐭 𝐓𝐫𝐞𝐧𝐝 𝐈𝐝𝐞𝐧𝐭𝐢𝐟𝐢𝐞𝐫 connected to ™TradeChartist Plug and Trade as Oscillatory Signal with 0/0 to generate trade signals with Targets and performance information on trades.
More Example Charts
==================
===================================================================================================================
Best Practice: Test with different settings first using Paper Trades before trading with real money
===================================================================================================================
This is not a free to use indicator. Get in touch with me (PM me directly if you would like trial access to test the indicator)
Premium Scripts - Trial access and Information
Trial access offered on all Premium scripts.
PM me directly to request trial access to the scripts or for more information.
===================================================================================================================
Multiple Moving Averages in one indicatorHi, that's an "enhanced" version of this indicator gently published by myfye13 .
Here's the things I've implemented:
Up to 8 moving averages
Now you can set the source of each moving average
Now you can set the length of each moving average.
Hope this will help especially those who have an indicato limit or who use multiple emas and don't wan't to see a stack of indicators list on the upper left of the chart.
