Consolidation Zones Volume Delta | Flux ChartsGENERAL OVERVIEW:
The Consolidation Zones Volume Delta | Flux Charts indicator is designed to identify and visualize consolidation zones on the chart. Rather than only outlining areas of sideways price movement, the indicator analyzes volume activity occurring inside each consolidation zone. This is done by aggregating lower-timeframe volume data into the higher-timeframe consolidation range, allowing users to see how buying and selling activity evolves while price remains in a range.
What is the theory behind the indicator?:
The indicator is built around three core analytical concepts that guide how consolidation zones are detected and evaluated.
1. Consolidation as a structural phase
Periods of consolidation are characterized by reduced directional movement and compressed price ranges. During these phases, price action often alternates within a defined high–low boundary, creating a structure that can be objectively measured and tracked over time.
2. Volume behavior inside consolidation
While price may appear balanced within a consolidation range, volume activity inside that range can vary. The indicator evaluates volume contributions occurring within the vertical boundaries of the consolidation zone by using lower-timeframe data and weighting each candle’s volume based on its overlap with the zone. This produces an internal volume delta profile that reflects how buying and selling volume accumulates throughout the consolidation.
Delta behavior inside a zone may show:
Persistent dominance of buying or selling volume
Alternating shifts between buyers and sellers
Periods of relatively balanced participation
3. Markets consolidate in multiple ways, one detection method is not enough
Markets do not consolidate in a single, uniform way. To account for this, the indicator includes three distinct consolidation detection methods. Each method is calculated objectively, does not repaint, and targets a different type of sideways or low-expansion price behavior:
Candle Compression
ADX Low Trend Strength
Visual Range Boundaries
CONSOLIDATION ZONES VOLUME DELTA FEATURES:
The Consolidation Zones Volume Delta indicator includes 4 main features:
Consolidation Zones
Volume Delta
Standard Deviation Bands
Alerts
CONSOLIDATION ZONES:
🔹What is a Consolidation Zone?
A consolidation zone is a defined price range where market movement becomes compressed and price remains contained within clear upper and lower boundaries for a sustained period of time. During this phase, price does not establish a strong directional trend and instead oscillates within a relatively narrow range.
🔹Consolidation Zone Detection
The indicator automatically detects consolidation zones using three independent, rule-based methods. Each method evaluates a different market condition and can be selected individually depending on how you want consolidation to be defined. Regardless of the method used, all zones are calculated objectively and finalized once confirmed.
◇ Candles (Candle Compression)
The Candles method identifies consolidation by detecting periods of candle compression and reduced range expansion. A candle is considered part of a consolidation sequence when:
The candle body is small relative to its total range
The candle’s high–low range is smaller than the short-term Average True Range (ATR)
ATR is calculated using a 4-period average true range and is used as a volatility reference. If consecutive candles continue to meet these compression conditions, the indicator increments an internal count.
Under the Consolidation Candles section in the settings, you’ll find two controls.
Min. Consolidation Candles setting
This defines how many consecutive compressed candles are required before a consolidation zone is confirmed. Candle compression is determined using candle structure and short-term ATR, ensuring that only periods of reduced range expansion are counted. Once the minimum threshold is reached, the indicator creates a consolidation zone using the highest high and lowest low formed during the compressed sequence.
Mark Consolidation Candles
When enabled, the indicator highlights candles that meet the compression criteria, making it easy to visually identify which candles contributed to the formation of the consolidation zone.
◇ ADX (Low Trend Strength)
The ADX method identifies consolidation based on weak or declining trend strength rather than candle structure. This method uses the Average Directional Index (ADX) to determine when directional movement is reduced.
ADX is calculated using directional movement values that are smoothed over time. When ADX remains below a user-defined threshold, price is treated as being in a low-trend market. While this condition persists, the indicator tracks the highest high and lowest low formed during the low-trend period.
Under the ADX Settings section in the settings, you’ll find the following controls.
ADX Length
Defines the lookback period used to calculate directional movement for ADX.
ADX Smoothing
Controls the smoothing applied to the ADX calculation.
ADX Threshold
Sets the level below which ADX must remain for the market to be considered consolidating.
Consolidation Strength
Defines how many consecutive candles’ ADX must stay below the threshold before a consolidation zone is confirmed. Once this requirement is met, the indicator creates a consolidation zone using the accumulated high and low from the low-trend window.
Mark Candles Below Threshold
When enabled, the indicator highlights candles where ADX remains below the threshold.
◇ Visual Range
The Visual Range method identifies consolidation by detecting clearly defined horizontal price ranges where price remains contained for a sustained period of time. The indicator continuously tracks the rolling highest high and lowest low across recent candles. When price remains inside the same high–low boundaries without breaking above or below the range, an internal counter advances.
Under the Visual Range section in the settings, you’ll find the following control.
Min. Candles in Range
Defines how many consecutive candles must remain fully contained within the same high–low range before a consolidation zone is confirmed. Once this requirement is met, the indicator creates a consolidation zone using the established range boundaries.
🔹Consolidation Zone Settings
◇ Invalidation Method
Users can choose how Consolidation Zones are invalidated, selecting between Close Break or Wick Break.
Close Break: A Consolidation Zone is invalidated when a candle closes above/below the zone.
Wick Break: A Consolidation Zone is invalidated when a candle’s wick goes above/below the zone.
◇ Merge Overlapping Zones
When enabled, overlapping Consolidation Zones are automatically combined into one unified zone.
◇ Show Last
This setting determines how many Consolidation Zones are displayed on your chart. For example, setting this to 5 will display the 5 most recent zones.
VOLUME DELTA:
Delta Volume visualizes how buying and selling volume accumulates inside each consolidation zone. Instead of using the full candle volume, the indicator isolates only the volume that occurs within the vertical boundaries of the zone. This allows you to see whether bullish or bearish volume is dominating while price remains range-bound. The visualization updates in real time while the zone is active and reflects cumulative participation rather than individual candles.
🔹How Volume Delta is Calculated
Delta Volume is calculated using lower-timeframe data and applied to the higher-timeframe consolidation zone.
Each candle’s volume is split into bullish or bearish volume based on candle direction.
Lower-timeframe candles are pulled using the selected delta timeframe.
For each lower-timeframe candle, only the portion of volume that vertically overlaps the consolidation zone is counted.
Volume is weighted by the amount of overlap between the candle’s range and the zone’s range.
Bullish and bearish volume are accumulated over time to form a running, cumulative delta profile for the zone.
🔹Volume Delta Settings
◇ Enable
Turns the Delta Volume visualization on or off. Consolidation zones continue to plot when disabled.
◇ Show Delta %
Displays the percentage breakdown of bullish versus bearish volume inside the consolidation zone. Percentages are derived from cumulative volume totals.
◇ 3D Visual
When enabled, the delta blocks are extended diagonally using a depth offset derived from the instrument’s daily ATR. This creates visible side faces and top faces for the delta blocks, simulating depth without altering any calculations. The 3D effect is purely visual. It does not change how volume is calculated, weighted, or accumulated.
Users can control the intensity of the 3D effect choosing a value between 1 and 5. Increasing this value increases:
The horizontal offset of the delta blocks
The vertical depth projection applied to the volume faces
Higher values produce a more pronounced 3D appearance by pushing the delta visualization further away from the consolidation box. Lower values keep the visualization flatter and closer to the box boundaries. The depth scaling is normalized using ATR, so the effect adapts proportionally to the instrument’s volatility.
◇ Volume Delta Display Style
Controls how bullish and bearish volume are displayed inside the Consolidation Zone:
Horizontal: Volume is split top-to-bottom within the zone
Vertical: Volume is split left-to-right across the zone
◇ Timeframe
Defines the lower timeframe used for Volume Delta calculations. When a timeframe is selected, the indicator pulls lower-timeframe price and volume data and maps it into the higher-timeframe consolidation zone. Each lower-timeframe candle is evaluated individually. Only the portion of its volume that vertically overlaps the consolidation zone is included, and that volume is weighted based on the candle’s overlap with the zone’s price range. If the Timeframe field is left empty, the indicator defaults to using the chart’s current timeframe for delta calculations.
Using a lower timeframe increases the granularity of the delta calculation, allowing volume changes inside the zone to be measured more precisely. Using a higher timeframe produces a smoother, less granular delta profile.
Please Note: Delta rendering is automatically limited to available lower-timeframe data to prevent incomplete or distorted visuals when historical lower-timeframe volume is unavailable due to TradingView data limits.
STANDARD DEVIATION BANDS:
Standard Deviation Bands project measured price distance away from a confirmed consolidation zone using the size of that zone as the reference unit. Rather than calculating volatility from historical price dispersion, the bands are derived directly from the height of the consolidation range itself. Each band represents a fixed multiple of the consolidation zone’s height and is plotted symmetrically above and below the zone.
🔹How the bands are calculated
Once a consolidation zone is finalized, the indicator calculates the zone height as:
Zone Height = Zone High − Zone Low
This value becomes the base measurement for all deviation calculations. For each enabled band:
Upper bands are placed above the consolidation zone’s high
Lower bands are placed below the consolidation zone’s low
The distance of each band from the zone is calculated by multiplying the zone height by the selected band multiplier. These band levels are fixed relative to the consolidation zone and do not recalculate based on future price movement.
🔹Standard Deviation Band Settings
◇ Band 1
Enables the first deviation band above and below the consolidation zone. The Band 1 multiplier defines how far the band is placed from the zone in terms of zone height. For example, a multiplier of 1 plots the band one full zone height above and below the consolidation range.
◇ Band 2
Enables a second deviation band at a greater distance from the consolidation zone. Band 2 uses its own multiplier and is calculated independently of Band 1, allowing multiple expansion levels to be displayed simultaneously.
◇ Fill Bands
When enabled, the area between the consolidation zone and each deviation band is filled with a semi-transparent color. Upper fills apply to bands above the zone, and lower fills apply to bands below the zone. Fills are static and tied directly to the consolidation zone boundaries.
◇ Color Customization
Each deviation band has independent color controls for:
Upper band lines and fills
Lower band lines and fills
This allows users to visually distinguish between bullish and bearish extensions as well as between multiple deviation levels.
ALERTS:
Users can create alerts for the following:
New Consolidation Zone Formed
Consolidation Zone Break
UNIQUENESS:
This indicator combines multiple consolidation detection methods with lower-timeframe volume delta analysis inside each consolidation zone. It visualizes bullish and bearish volume using weighted overlap logic and optional 3D rendering for improved clarity. Users can choose how volume is displayed, apply structure-based deviation bands, and enable alerts for new zones and zone breaks. All features are rule-based, configurable, and designed to work together within a single framework.
Multitimeframe

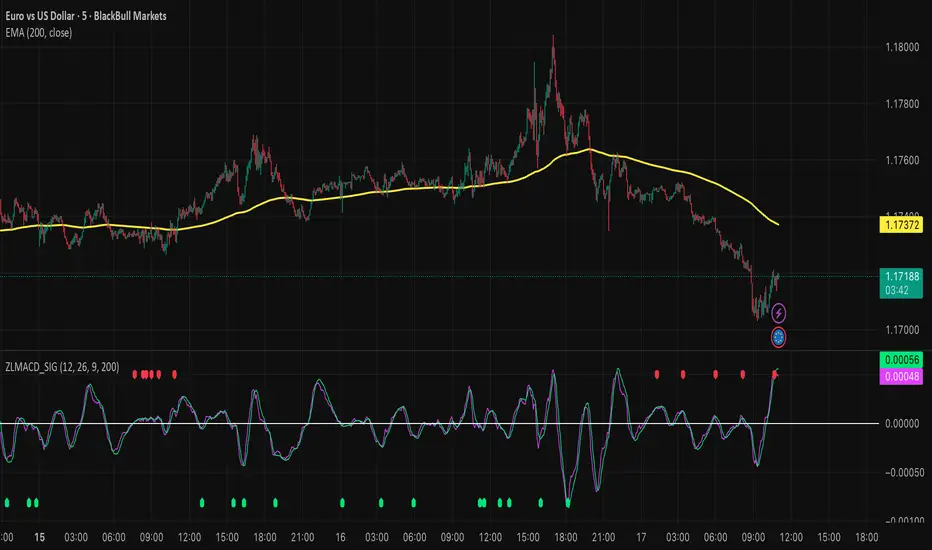
Enhanced Swing Trading Confluence [Hidden Div Bonus + Dashboard]powerful swing trading indicator combining multiple confluence factors for high-probability setups.
This indicator identifies premium long and short opportunities by requiring alignment across:
• Trend direction (price above/below 200 EMA + optional 50/100/200 EMA stacking)
• RSI oversold/overbought conditions (with optional strict crossover requirement)
• MACD line/signal crossover
• Price touching Bollinger Band extremes
• Optional Bollinger Band squeeze (low volatility contraction)
• Optional volume spike confirmation
Features:
• Clean entry arrows for ready signals
• Real-time confluence dashboard showing which conditions are met
• Accurate regular RSI divergence detection (reversal signals)
• Hidden RSI divergence detection (trend continuation signals)
• Optional use of recent hidden divergence as a bonus confirmation filter
• Customizable inputs and alerts
Ideal for swing traders seeking multi-factor confirmation before entries. Works across all markets and timeframes. Alerts fire only when full confluence is achieved for disciplined, high-quality trade setups.

Structure Lite - Automatic Major Trend LinesStructure Lite — Automatic Major Trend Lines
Structure Lite automatically detects and plots major market structure using higher-timeframe pivot highs and lows.
It is designed to provide a clean, lightweight view of primary support and resistance without manual drawing or chart clutter.
This script focuses only on major structure and intentionally excludes short-term noise, advanced liquidity concepts, or signal logic.
Features
Automatically plots major resistance (red) and major support (green) trend lines
Uses higher-period pivots to reflect macro / swing structure
Lines extend right for forward projection
Keeps only the most recent major levels to reduce clutter
Optional toggle to hide all trend lines for a clean chart view
How to Use
Add the indicator to your chart
Adjust Major Pivot Period to control how swing-based the structure is
Higher values = fewer, more important levels
Lower values = more responsive structure
Use the plotted lines to:
Identify higher-timeframe support and resistance
Contextualize price action and trend bias
Toggle Hide All Trend Lines to quickly remove structure without removing the indicator
This tool is intended for context and structure awareness, not trade signals.
Design Philosophy
Structure Lite is intentionally minimal:
No alerts
No buy/sell signals
No predictions
No performance claims
It is built as a foundational structure tool that can be combined with the user’s own methodology.
Notes
Some inputs reference advanced features available in a separate professional version
These options are disabled here and included only for interface consistency
No external links, promotions, or monetization are included in this script
Disclaimer
Educational and informational purposes only.
This script does not provide financial advice or trade recommendations.
Past market behavior does not guarantee future results.
© 2025 GammaBulldog

FVG MTF Consensus OscillatorFVG MTF Consensus Oscillator
A multi-timeframe, multi-component oscillator that combines momentum, deviation, and slope analysis across multiple timeframes using Zeiierman's Chebyshev-filtered trend calculation. This indicator identifies potential turning points with zone-based signal classification and timeframe consensus filtering.
Backed by ML/Deep Learning evaluation on ES Futures data from 2015-2024.
🎯 Concept
Traditional oscillators suffer from two major weaknesses:
Single measurement - relying on one metric makes them susceptible to noise
Single timeframe - missing the bigger picture leads to fighting the trend
The FVG MTF Consensus Oscillator addresses both issues by combining three independent measurements across three timeframes into a weighted consensus signal.
The Three Components
Momentum - How fast is the trend moving?
Deviation - How far has price stretched from the trend?
Slope - What is the short-term directional bias?
The Three Timeframes
TF1 (Chart) - Your current chart timeframe (lowest weight)
TF2 (Medium) - Typically 1H or 4H (medium weight)
TF3 (High) - Typically 4H or Daily (highest weight)
By requiring agreement across multiple components AND multiple timeframes, the oscillator filters out noise while capturing meaningful, high-probability market movements.
🔧 How It Works
The Core: Chebyshev Type 1 Filter
At its heart, this indicator uses a Chebyshev Type 1 low-pass filter (inspired by Zeiierman's FVG Trend) to extract a clean trend line from price action. Unlike simple moving averages, the Chebyshev filter offers:
Sharper cutoff between trend and noise
Minimal lag for a given smoothness level
Controlled overshoot via the ripple parameter
Three Oscillator Components
1. Momentum Component
Momentum = Current Trend Value - Previous Trend Value
Measures the velocity of the trend. High positive values indicate strong upward acceleration, while high negative values show downward acceleration.
2. Deviation Component
Deviation = Close Price - Trend Value
Measures how far price has stretched away from the trend line. Useful for identifying overextended conditions and mean reversion opportunities.
3. Slope Component
Slope = Change in Trend over 3 bars
Captures the short-term directional bias of the trend itself, helping confirm trend changes.
Normalization & Component Consensus
Each component is individually normalized to a -100 to +100 scale using adaptive scaling. The oscillator output is a weighted average of all three components, allowing you to emphasize different aspects based on your trading style.
Multi-Timeframe Weighting
The final oscillator value combines all three timeframes using configurable weights:
Combined = (TF1 × Weight1 + TF2 × Weight2 + TF3 × Weight3) / Total Weight
Default weights (1, 2, 3) ensure higher timeframes have more influence, keeping you aligned with the dominant trend while timing entries on lower timeframes.
📊 Zone System
The oscillator uses a fuzzy zone system to classify market conditions:
ZoneRangeInterpretationSignal ColorNeutral-5 to +5No clear bias, avoid tradingGrayContinuation±5 to ±25Trend pullback, continuation setupsAquaDeep Swing±25 to ±50Extended move, stronger setupsGreenReversalBeyond ±50Extreme extension, reversal potentialOrange
When "Show Zone Background" is enabled, the background shading darkens as the oscillator moves into more extreme zones, providing instant visual feedback.
📈 Signal Interpretation
Turn Signals
The indicator plots triangular markers when the oscillator changes direction:
▲ Triangle Up (bottom): Oscillator turning up from a low
▼ Triangle Down (top): Oscillator turning down from a high
Signal Quality by Zone
Not all signals are equal. The signal color indicates which zone the turn occurred in:
ColorZoneProbabilityBest UseGrayNeutralLowAvoid or use very tight stopsAquaContinuationModerateTrend continuation entriesGreenDeep SwingHigherSwing trade entriesOrangeReversalHighestCounter-trend with caution
Timeframe Consensus Filter
Signals only fire when the required number of timeframes agree on direction. With default settings (TF Consensus = 2), at least 2 of 3 timeframes must be moving in the same direction for a signal to trigger.
This prevents:
Taking longs when higher timeframes are bearish
Taking shorts when higher timeframes are bullish
Whipsaws during timeframe disagreement
Trend Coloring
The combined oscillator line changes color based on trend direction:
Light purple (RGB 240, 174, 252): Majority of timeframes trending up
Dark purple (RGB 84, 19, 95): Majority of timeframes trending down
Info Table
When MTF is enabled, a table in the top-right corner displays:
Current oscillator values for each timeframe (TF1, TF2, TF3)
Combined value (CMB)
Color coding: Green = rising, Red = falling
⚙️ Settings Guide
Timeframe Settings
SettingDefaultDescriptionEnable Multi-TimeframeOnMaster switch for MTF functionalityTF1 (Chart)"" (current)First timeframe, typically your chart TFTF2 (Medium)60Second timeframe, typically 1HTF3 (High)240Third timeframe, typically 4HTF1/TF2/TF3 Weight1 / 2 / 3Influence of each TF on combined signal
Timeframe Tips:
Keep TF1 ≤ TF2 ≤ TF3 (ascending order)
For day trading: 5m / 15m / 1H
For swing trading: 1H / 4H / Daily
For position trading: 4H / Daily / Weekly
Display Settings
SettingDefaultDescriptionShow All TimeframesOffDisplay individual TF oscillator linesShow Combined LineOnDisplay the weighted combined oscillatorShow Zone BackgroundOffShade background based on current zone
Trend Filter Settings
SettingDefaultDescriptionTrend Ripple4.0Filter responsiveness (1-10). Higher = faster but more overshootTrend Cutoff0.1Cutoff frequency (0.01-0.5). Lower = smoother trendNormalization Length50Lookback for scaling. Longer = more stable
Component Weights
SettingDefaultDescriptionMomentum Weight1.0Emphasis on trend speedDeviation Weight1.0Emphasis on price stretch from trendSlope Weight1.0Emphasis on short-term trend direction
Component Tips:
For trend-following: Increase Momentum and Slope weights
For mean reversion: Increase Deviation weight
Set any weight to 0 to disable that component
Zone Thresholds
SettingDefaultDescriptionNeutral Zone5Inner boundary (±5 = neutral)Continuation Zone25Middle boundary for continuation setupsDeep Swing Zone50Outer boundary for reversal zone
Adjust based on instrument volatility. More volatile instruments may need wider zones.
Signal Filters
SettingDefaultDescriptionSignal Cooldown3Minimum bars between signalsMin Turn Size2.0Minimum oscillator change for valid turnTF Consensus Required2Minimum TFs agreeing for signal (1-3)
💡 Usage Examples
Example 1: Trend Continuation (Dip Buying)
Setup: Uptrend confirmed by higher timeframes
Check the info table - TF2 and TF3 should show green (rising)
Wait for TF1 to pull back, oscillator enters Continuation zone
Enter on Aqua ▲ signal (turn up with TF consensus)
Stop below recent swing low
Target: Previous high or next resistance
Why it works: You're buying a dip in an established uptrend with multi-timeframe confirmation.
Example 2: Deep Swing Entry
Setup: Extended move showing exhaustion
Oscillator reaches Deep Swing zone (±25 to ±50)
At least 2 TFs start showing the same direction
Enter on Green signal indicating momentum exhaustion
Use tighter stop as the move is already extended
Target: Return to Continuation zone or trend line
Why it works: Extended moves tend to mean-revert. The zone system identifies these opportunities.
Example 3: Reversal Setup (Advanced)
Setup: Extreme extension with diverging timeframes
Oscillator reaches Reversal zone (beyond ±50)
Watch for TF1 to turn while TF3 is still extended
Enter on Orange signal - this is counter-trend!
Use smaller position size and wider stops
Target: Return to Deep Swing or Continuation zone
Why it works: Extreme extensions eventually correct. The orange signal marks high-probability reversal points.
Example 4: Avoiding Bad Trades
What to avoid:
Gray signals in Neutral zone - No edge, random noise
Signals against TF3 direction - Fighting the dominant trend
Signals without TF consensus - Timeframe disagreement = choppy market
Multiple signals in quick succession - Let cooldown filter work
🔬 Multi-Timeframe Analysis Tips
Reading the Info Table
The info table shows real-time oscillator values:
| TF1 | TF2 | TF3 | CMB |
| 23.5 | 45.2 | 67.8 | 52.1 |
All green: Strong uptrend across all timeframes
All red: Strong downtrend across all timeframes
Mixed colors: Potential transition or consolidation
Timeframe Alignment States
TF1TF2TF3Interpretation↑↑↑Strong bull - look for long entries↓↓↓Strong bear - look for short entries↑↑↓Pullback in downtrend - caution on longs↓↓↑Pullback in uptrend - caution on shorts↑↓↑Choppy - reduce position size↓↑↓Choppy - reduce position size
The Power of Consensus
With TF Consensus = 2, signals only fire when 2+ timeframes agree. This single filter eliminates most whipsaws and keeps you aligned with the dominant trend.
For more conservative trading, set TF Consensus = 3 (all timeframes must agree).
⚠️ Important Notes
This indicator does not predict the future. It measures current market conditions and momentum across multiple timeframes.
Always use proper risk management. No indicator is 100% accurate.
Combine with price action. The oscillator works best when confirmed by support/resistance, candlestick patterns, or other confluence factors.
Respect the higher timeframe. When TF3 disagrees, trade smaller or sit out.
Zone signals are probabilistic. Orange (reversal) signals have higher probability but aren't guaranteed reversals.
Adjust settings per instrument. Default settings are optimized for ES Futures but may need tuning for other markets.
🧪 ML/Deep Learning Background
The default parameters and zone thresholds were evaluated using machine learning techniques on ES Futures data spanning 2015-2024. This included:
Optimization of component weights
Zone threshold calibration
Timeframe weight balancing
Signal filter tuning
While past performance doesn't guarantee future results, the parameters represent a data-driven starting point rather than arbitrary defaults.
🙏 Credits
This indicator is inspired by Zeiierman's Multitimeframe Fair Value Gap (FVG) indicator, specifically utilizing concepts from his Chebyshev Type 1 filter implementation for trend calculation.
Original indicator: Multitimeframe Fair Value Gap – FVG (Zeiierman)
📝 Changelog
v1.0
Initial release
Three-component consensus oscillator (Momentum, Deviation, Slope)
Multi-timeframe support with weighted combination
Fuzzy zone classification system
Configurable component and timeframe weights
TF consensus filter for signal quality
Signal cooldown and minimum turn size filters
Real-time info table with TF values
Optional zone background shading

BB Squeeze Screener 15MPurpose: Detects Bollinger Band squeeze conditions across symbols/timeframes for fast scanning in the TradingView Screener. Default timeframe = 15m, but can be duplicated for 1h / 4h / 1D columns.
How it works: computes a normalized BB width, compares it to its SMA and flags when width falls below the configured threshold (squeeze ON). Output = 1 (squeeze) or 0 (no squeeze).
Inputs: Timeframe, BB Length, SMA Length, Threshold. Use separate columns per timeframe for multi‑TF scanning.
Usage: Publish the script, add it as a Screener column, then filter for =1 and combine with Vol 24h / Market Cap filters to reduce noise. Good workflow: Mode = 15m (intraday), 1h (swing), 4h/1D (higher‑TF confirmations).
Notes: This is a volatility filter (not directional). Combine with momentum/volume filters or a breakout rule for entries. Backtest rules on your watchlist before live use.
Disclaimer: Educational tool only — not financial advice. Use proper risk management.

ICT MTF FVG BPR Toolkit [D4A}The ICT MTF FVG BPR Toolkit encompasses the following 5 components:
- Fair Value Gaps - current timeframe
- Fair Value Gaps - higher timeframe
- BPR - Balanced Price Range
- Long Wicks - which are considered to be gaps by ICT
- Immediate Rebalance - it leaves no gaps, but is as important in assessing current workflow
This is advanced Fair Value Gaps script that uses trading methodology taught by ICT trader. To use it effectively it requires at least some basic knowledge of Smart Money Concepts (SMC) as outlined in ICT's lectures found on YT. I may publish another SMC related scripts in future if this kind of tool is useful to anybody.
The idea behind this work, is to have all the necessary tools related to Fair Value Gaps in one script that is easy to use (requires SMC knowledge), fully customizable and will keep the chart as clutter free as possible. Since, I could not find a ready-made script which would tick all my requirements, I created this new script, partially by borrowing some ideas and code from existing open source projects that I liked. Rather than re-inventing the wheel, I focused on adopting and improving existing solutions and have them work together in one tool that could present the information accurately and in a polished way, where the trader can customize almost everything. Full credit goes to other coders, who tackled this subject before me, but particularly to:
QuantVue
LuxAlgo
pmk07
The script have these unique features:
- Can present FVGs from up to 3 different timeframes at any given interval
- The amount and interval of higher timeframe FVGs is fully customizable
- FVGs can be displayed based on size
- Volume Imbalance can be included as part of FVG (as recommended by ICT)
- Higher timeframe FVGs can have quadrants displayed along with C.E. (based on ATR filter)
- Both current and higher timeframe FVGs can be displayed in different ways depending on price interactions
- BPR which works on current timeframe only
- Long Wick detection logic has been slightly changed from the original LuxAlgo code
- Immediate Rebalance code has been simplified and re-focused on clarity
-----------------
Disclaimer
The information contained in my Scripts/Indicators/Ideas/Algos/Systems does not constitute financial advice or a solicitation to buy or sell any securities of any type. I will not accept liability for any loss or damage, including without limitation any loss of profit, which may arise directly or indirectly from the use of or reliance on such information.
All investments involve risk, and the past performance of a security, industry, sector, market, financial product, trading strategy, backtest, or individual's trading does not guarantee future results or returns. Investors are fully responsible for any investment decisions they make. Such decisions should be based solely on an evaluation of their financial circumstances, investment objectives, risk tolerance, and liquidity needs.
My Scripts/Indicators/Ideas/Algos/Systems are only for educational purposes!

MTF rsi/stoch imdI just built this indicator.
It displays a multi-timeframe (MTF) table directly on the chart, showing Stoch RSI K and RSI values per timeframe.
Cell background colors are driven by predefined value ranges, while text color turns green or red depending on whether the value is rising or falling compared to the previous candle on the same timeframe.
The RSI color conditions are based on the levels 36, 46, 56, and 65.
The Timeframe Pack selector works as follows:
Pack 1 (BNC): 3m, 9m, 27m, 1h, 81m, 3h, 9h, 12h, 1D, 3D, 1W, 9D
Pack 2: 1h through 24h
Pack 3: 1D through 24D
Pack 4 (Custom): fully user-defined timeframes via the 24 slots
Only when Pack 4 (Custom) is selected do the custom timeframe slots apply; in Packs 1–3 they are ignored.
All visual behavior (box colors, text colors, transparency, or a single-color override) is configurable under Style, and the entire table can be toggled on or off.


Trappp's Advanced Multi-Timeframe Trading ToolkitThis comprehensive trading script by Trappp provides a complete market analysis framework with multiple timeframe support and resistance levels. The indicator features:
Key Levels:
· Monthly (light blue dashed) and Weekly (gold dashed) levels for long-term context
· Previous day high/low (yellow) with range display
· Pivot-based support/resistance (pink dashed)
· Premarket levels (blue) for pre-market activity
Intraday Levels:
· 1-minute opening candle (red)
· 5-minute (white), 15-minute (green), and 30-minute (purple) session levels
· All intraday levels extend right throughout the trading day
Technical Features:
· EMA 50/200 cross detection with alert labels
· Candlestick pattern recognition near key levels
· Smart proximity detection using ATR
· Automatic daily/weekly/monthly updates
Trappp's script is designed for traders who need immediate visual reference of critical price levels across multiple timeframes, helping identify potential breakouts, reversals, and pattern-based setups with clear, color-coded visuals for quick decision-making.

Zero Lag MACD and EMA 200 with SignalsZero Lag MACD with EMA Filter and Smart Signals
This indicator is an enhanced version of the traditional MACD that uses Zero Lag EMA calculations to provide faster and more responsive signals for scalping and day trading.
Key Features:
🎯 Zero Lag Technology - Uses double-smoothed EMA calculations to eliminate lag and provide earlier signals compared to standard MACD
📊 Clean Visualization - Displays histogram with MACD and Signal lines for clear trend analysis
🔍 Smart Signal Logic - Only shows valid trading signals based on strict conditions:
Buy Signal (Green dot at bottom): Triggers when price is above 200 EMA AND MACD crosses Signal line from below AND crossover occurs below zero line
Sell Signal (Red dot at top): Triggers when price is below 200 EMA AND MACD crosses Signal line from above AND crossover occurs above zero line
🔔 Built-in Alerts - Easy alert setup for both buy and sell signals so you never miss a trading opportunity
📈 200 EMA Filter - Incorporates trend filter to avoid counter-trend trades and improve signal quality
⚙️ Fully Customizable - Adjust all parameters:
Fast EMA Length (default: 12)
Slow EMA Length (default: 26)
Signal Length (default: 9)
EMA Filter Length (default: 200)
How to Use:
-Add the indicator to your chart
-Look for green dots (buy signals) when price is in an uptrend above 200 EMA
-Look for red dots (sell signals) when price is in a downtrend below 200 EMA
-Set up alerts by clicking "Create Alert" and selecting "Buy Signal" or "Sell Signal"
-Use signals in conjunction with your trading strategy and risk management
Best Practices:
-Works best on 1-15 minute timeframes for scalping
-Combine with support/resistance levels for confirmation
-Use proper stop-loss and take-profit levels
-Not all signals will be profitable - use proper risk management
-Signals are filtered to reduce noise and false entries
Color Scheme:
Histogram: Red (bearish) / Cyan (bullish)
MACD Line: Fuchsia/Pink
Signal Line: Lime/Green
Buy Signal: Green dot (bottom)
Sell Signal: Red dot (top)
This indicator is perfect for traders who want a cleaner, faster-responding MACD with built-in trend filtering and clear entry signals. Free to use and customize!
[TradingPulse] - Overlay+ PRO ScalpingTrade like a don on 1 min scalps.
sdäajdfkjsKLÖJfd#
sf
dasfd
asfa
dadf
affdsa
affda
adfs

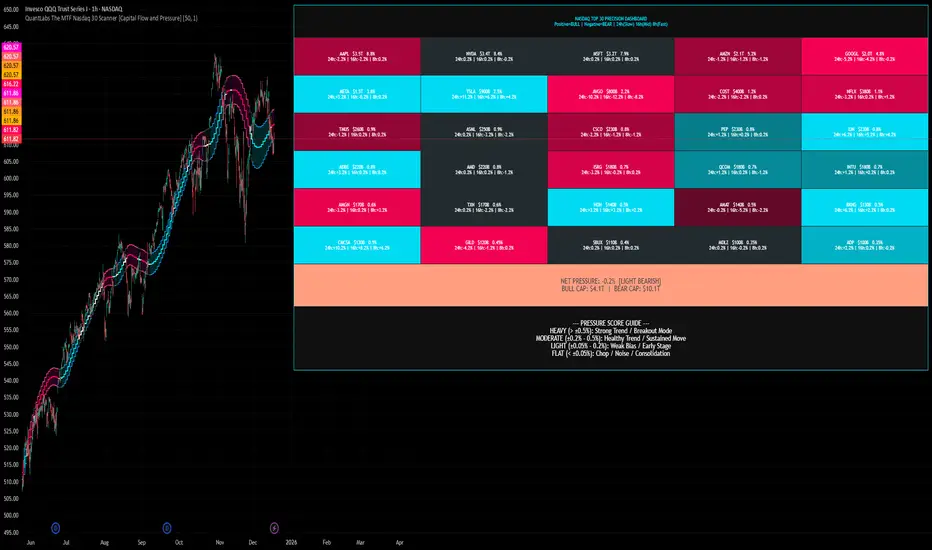
QuantLabs The MTF Nasdaq 30 Scanner [Capital Flow and Pressure]Trading the QQQ (Nasdaq) without knowing what the Generals (Apple, Nvidia, Microsoft) are doing is like driving at night with your headlights off. You might see the road right in front of you, but you'll miss the turn coming up.
The QuantLabs MTF Nasdaq 30 Scanner is not just a trend indicator, it is a professional-grade Market Dashboard that visualizes the heartbeat of the entire Nasdaq 100.
Why You Need This
Standard indicators lag. They tell you what happened after the move. This Heatmap tracks the Real-Time Capital Flow of the Top 30 companies that actually move the index ($Trillions in Market Cap).
Key Features
1. The "Spectacular" Precision Heatmap
Organized by Market Cap Size (AAPL/NVDA first).
Instantly spot divergent behavior. Is the market rallying, or is it just Nvidia holding everything up? The Heatmap reveals the truth instantly.
Colors: Neon Cyan (Bullish) vs Hot Pink (Bearish).
2. Triple Spectrum Technology (3-in-1 Timeframes) Why look at one timeframe when you can see three? Every cell in the dashboard displays the trend distance for:
8h (Fast): For scalping entries.
16h (Mid): For swing trends.
24h (Slow): For the major "Big Picture" bias.
Values denote % distance from the Flux Ribbon.
3. The "Net Pressure" Gauge (The Speedometer) A predictive summary footer that calculates the Weighted Pressure of the entire market.
HEAVY (> 0.5%): Strong Trend / Breakout Mode.
MODERATE (0.2% - 0.5%): Healthy, sustained move.
FLAT: Chop / Noise. Stay out.
It also shows exactly how much Capital ($Trillions) is sitting Bullish vs Bearish.
How to Trade with It
Check the "Net Pressure": If it says MODERATE BULLISH, you are looking for Longs only.
Scan the Top Row: Are the "Big 5" (AAPL, NVDA, MSFT...) aligned with the pressure?
Wait for Alignment: If the 8h, 16h, and 24h metrics all turn Cyan, that is a "Quantum Lock"—a high probability breakout signal.
Simple. Powerful. Neon. Add it to your chart and stop guessing the direction.
Credits: Built with 💜 by David James @ QuantLabs
Nifty Hierarchical Macro GuardOverview
The Nifty Hierarchical Macro Guard is a "Market Compass" indicator specifically designed for Indian equity traders. It locks its logic to the Nifty 50 Index (NSE:NIFTY) and applies a strict hierarchy of trend analysis. The goal is simple: prioritize the long-term trend (Monthly/Weekly) to decide if you should even be in the market, then use the short-term trend (Daily) for precise exit timing.
This script ensures you never ignore a macro "crash" signal while trying to trade minor daily fluctuations.
The Color Hierarchy (Priority Logic)
The indicator uses a "Top-Down" filter. Higher timeframe signals override lower timeframe signals:
Level 1: Monthly (Ultra-Macro) — Deep Maroon
Condition: Nifty 10 EMA is below the 20 EMA on the Monthly chart.
Action: This is the highest priority. The background will turn Deep Maroon, overriding all other colors. This is your "Forget Trading" signal. The long-term structural trend is broken.
Level 2: Weekly (Macro Warning) — Dark Red
Condition: Monthly is Bullish, but Nifty 10 EMA is below the 20 EMA on the Weekly chart.
Action: The background turns Dark Red. This indicates a significant macro correction. You should stay out of fresh positions and protect capital.
Level 3: Daily (Tactical) — Light Red / Light Green
Condition: Both Monthly and Weekly are Bullish (Green).
Action: The background will now react to the Daily 10/20 EMA cross.
Light Green: Nifty is healthy; safe for fresh positions.
Light Red: Tactical exit signal. Nifty is seeing short-term weakness; exit positions quickly.
Key Features
Symbol Locked: No matter what stock you are viewing (Reliance, HDFC, Midcaps), the background only reacts to NSE:NIFTY.
Clean Interface: No messy lines or labels on the price chart. The information is conveyed purely through background color shifts.
Customizable: Change the MA types (EMA/SMA) and lengths (e.g., 10/20 or 20/50) in the settings.
Macro Dashboard: A small, transparent table in the top-right corner displays exactly which timeframe is currently controlling the background color.
How to Use for Nifty Strategy
Stay Out: If the chart is Deep Maroon or Dark Red, do not look for "buying the dip." Wait for the macro health to return.
Take Exits: If the background is Light Green and suddenly turns Light Red, it means the Daily Daily 10/20 cross has happened. Exit your Nifty-sensitive positions immediately.

Bar CountCount K bars based on sessions
Support at most 3 sessions
Customize the session's timezone and period
Set steps between each number
Use with the built-in Trading Session indicator is a great convenience

UT Bot + SMC PRO (PROP) + VISUAL SIGNALS-DE ALEJANDRO PONCEHOW TO USE THEM TOGETHER (GOLDEN RULE)
Reading Sequence
UT → without B Bounce / pullback
B → without UT Weak break
UT → B (same direction) ✅ Valid setup
UT ↔ Opposite Bs Noise / range


Time & Price Confirmation (TPC)This one i am in the midst of trying to make better but for now its actually making money.
Core Concept:
Uses SuperTrend on two timeframes: Higher Timeframe (HTF) for trend direction and Lower Timeframe (LTF) for entry timing
Only signals trades when BOTH timeframes align
Key Components:
HTF Time (Higher Timeframe) - Checks if the main trend is strong:
🟢 Healthy = Strong trend, good momentum
🟠 Slowing = Trend weakening but still valid
🔴 Tired = Trend exhausted, avoid trading
LTF Confirm (Lower Timeframe) - Waits for price confirmation via:
SuperTrend flip (trend reversal)
Displacement candle (large range breakout)
Strong momentum move
Action Signals:
🚀 ENTER = Both HTF healthy + LTF confirmed (best setup)
⏳ HOLD = HTF still good but waiting for LTF confirmation
⏹️ NO TRADE = HTF tired or conditions not met

Multi-Timeframe High Low Marking LinesThis indicator automatically draws clean horizontal lines at the high and low of the previous 10 periods (adjustable) for four different timeframes simultaneously: Daily, Weekly, Monthly, and Quarterly.
Perfect for marking key support/resistance levels across multiple timeframes on any chart.
Key features:
• Shows previous 10 highs and lows per timeframe (change to 5, 15, 20 etc. in settings)
• Lines extend 20 bars to the right so they remain visible (adjustable)
• Individual on/off switch for each timeframe
• Clean blue lines, max 500 lines limit respected
• Works perfectly on any chart timeframe (1-minute to monthly)
• No repainting – lines only appear after the period has closed
Use cases:
Spot major daily/weekly/monthly support & resistance at a glance
Trade breakouts and reversals with higher-timeframe confirmation
Combine with your existing strategy (ICT, SMC, price action)
Ideal for stocks, forex, crypto and futures
Settings explained:
Timeframe 1–4 → Choose any timeframe (D, W, M, 3M already preset)
Show/Hide → Turn any timeframe on or off instantly
Periods to show → How many previous highs/lows you want visible
Extend lines → How far right each line continues (default 20 bars)
Completely free to use.
If you like it, please add to favorites and leave a comment – it helps other traders find it!
Enjoy cleaner charts and stronger confluence.
Happy trading!

Roan Algoindicator that gives real-time trade signals without repainting or lag. It works on all markets and on all timeframes.
the best unique chart analysis, custom indicators, and market view. Join our global community of traders and investors.

Big Trades Whale Detector [Volume Anomalies] By HKOverview The "Big Trade Detector" helps you spot institutional footprints by identifying volume anomalies that act as outliers compared to recent history. It uses statistical analysis (Standard Deviation) to filter out noise and highlight only significant buying or selling pressure.
Features:
Volume Decomposition: Approximates buy/sell volume based on price action within the candle (Close vs. Range).
3-Tier Detection: Uses dynamic thresholds to categorize volume spikes into Small, Medium, and Extreme events.
Smart Calculation: Compares current volume against the previous average to detect sudden shifts in momentum.
Visuals:
Green Circles (Below Bar): Unusual Buying Pressure (Support defense or Breakout).
Red Circles (Above Bar): Unusual Selling Pressure (Resistance defense or Dump).
Size Matters: The larger the circle, the higher the standard deviation (Sigma) of that volume event.

Dynamic Multi-Timeframe SMAs (Brian Shannon Style)Overview : This indicator implements the logic of Brian Shannon's "Multi-Timeframe Analysis" on intraday charts. It automatically calculates the correct length for the 5-Day and 50-Day Simple Moving Averages (SMA), regardless of the timeframe (e.g., 5m, 15m, 1h) you are viewing.
How it works Standard SMAs only count bars. A "50 SMA" on a 5-minute chart only looks back ~4 hours. This script dynamically calculates how many bars represent full trading days.
Features:
Asset Class Selector : Choose between Crypto (24/7) and Stocks (6.5h US Session) to ensure correct minute-per-day calculations.
Info Table : Displays exactly how many bars are being used for the calculation in real-time.


SIDD EMA RSI Supertrend Signal Table🔥 SIDD EMA RSI SuperTrend Multi-Timeframe Signal Table
**SIDD EMA RSI SuperTrend Signal Table** is a **clean, powerful multi-timeframe trend confirmation dashboard** designed for traders who want **clarity, confluence, and speed** — all in one glance.
This indicator **does NOT repaint** and uses **industry-standard trend logic** combining **EMA structure, RSI momentum, and SuperTrend direction** across **6 different timeframes**.
---
## 🧠 Core Logic Behind the Indicator
This script works on **three independent trend engines**, displayed together in a compact table:
### ✅ 1️⃣ EMA Trend (Structure Based)
* Uses **EMA 50 vs EMA 200**
* **Bullish** → EMA 50 above EMA 200
* **Bearish** → EMA 50 below EMA 200
* Captures **primary market structure**
### ✅ 2️⃣ RSI Trend (Momentum Based)
* RSI Length: **14**
* **Bullish** → RSI > **55**
* **Bearish** → RSI ≤ **55**
* Helps confirm **trend strength & momentum**
### ✅ 3️⃣ SuperTrend (Price Action Based)
* ATR Length: **10**
* Factor: **3.0**
* Clearly defines **trend direction & trailing bias**
* Excellent for **entry & exit alignment**
---
## ⏱️ Multi-Timeframe Coverage
The table analyzes trends across **6 configurable timeframes**:
* Intraday → **5m, 15m, 1H**
* Swing → **4H, Daily**
* Positional → **Weekly**
Each timeframe shows:
* 📈 EMA Trend
* 📊 RSI Trend
* 🔁 SuperTrend Direction
Color-coded for instant readability:
* 🟢 Bullish
* 🔴 Bearish
* ⚪ Neutral
---
## 🎯 How to Use This Indicator
✔ **Trend Trading**
Trade only when **EMA + RSI + SuperTrend align** across higher & lower timeframes.
✔ **Intraday Confirmation**
Use higher TF (1H / 4H) bias and take entries on lower TF.
✔ **Avoid Chop & False Signals**
If signals are mixed → market is likely **sideways or risky**.
✔ **Swing & Positional Trades**
Daily + Weekly alignment gives **high-probability setups**.
---
## ⚙️ Customization Options
* Adjustable **timeframes**
* Table **position** (Top/Bottom – Left/Right)
* Table **size** (Extra Small / Small / Normal)
* Custom **colors, borders & text**
* Optimized for **minimal chart clutter**
---
## ⚠️ Disclaimer
This indicator is a **trend confirmation & decision-support tool**.
Always combine with **price action, support/resistance, and proper risk management**.
