Double&Triple Pattern[TS_Indie]📌 Description – Double & Triple Pattern Indicator
The Double & Triple Pattern Indicator is developed to help traders systematically and clearly identify Double Top, Double Bottom, Triple Top, and Triple Bottom chart patterns.
⚙️ Core Logic & Working Mechanism
The Double & Triple Pattern Indicator is built on the concept of price swing formation, based on the logic of Trend Entry_0 , which focuses on structured market analysis and price action behavior.
The indicator detects three main swing points (Swing 1, Swing 2, and Swing 3). A Fibonacci Box is then created using Swing A and Swing B as reference points to define the swing detection zone.
When all three swings remain inside the defined Fibonacci Box, the structure is considered a valid Price Action setup.
The indicator then plots key lines on the chart:
➩ Break Line – used to confirm the signal (confirmation)
➩ Cancel Line – used to invalidate the price action if price moves against the conditions
➛ When price breaks the Break Line , the structure is confirmed and a Pending Order is placed at Swing B , with the Stop Loss set at Swing 1.
➛ If price breaks the Cancel Line first, the price action structure is immediately invalidated.
⚙️ Fibonacci Entry Zone & Change SL Settings
➩ When Fibo Entry Zone is set to 0, the Pending Order is placed directly at Swing B.
➩ When the value is greater than 0, the Pending Order is calculated using Fibonacci levels drawn from Swing B to the Stop Loss level.
➩ Change SL allows switching the Stop Loss reference between Swing 1 and Swing A.
⚙️ Min & Max Control for Swing Size : xATR
When enabling Control Size Swing : xATR , the indicator filters Swing B based on the defined Min and Max range.
This allows traders to selectively test larger or smaller swing-based price actions , depending on their trading strategy.
⭐ Pending Order Cancellation Conditions
A Pending Order will be canceled under the following conditions:
1.A new Price Action signal appears on either the Buy or Sell side.
2.When Time Session is enabled, the Pending Order is canceled once price exits the selected session.
🕹 Order Management Rule
When there is an active open position, the indicator restricts the creation of new Pending Orders to prevent overlapping positions.
💡 Double Pattern Example
💡 Triple Pattern Example
⚠️ Disclaimer
This indicator is designed for technical analysis purposes only and does not constitute investment advice.
Users should apply proper risk management and make decisions at their own discretion.
🥂 Community Sharing
If you find parameter settings that work well or produce strong statistical results, feel free to share them with the community so we can improve and develop this indicator together.
Norepaint

Moving Average Channel Breakout (No Repaint) This indicator creates a channel using two simple moving averages: SMA of highs (upper line) and SMA of lows (lower line).
How it works:
- When a candle closes above the upper channel line, the following candles turn green (bullish trend)
- When a candle closes below the lower channel line, the following candles turn red (bearish trend)
- The trend color remains until a breakout in the opposite direction occurs
Anti-repaint:
This indicator does NOT repaint. The candle color is determined at the open, based on the previous candle's close. Once a candle opens with a color, that color never changes.
Breakout strategy:
- Candle opens green → Long entry signal
- Candle opens red → Short entry signal
The signal and entry moment are perfectly synchronized at the candle open, making it ideal for systematic breakout strategies.

RSI Divergence Pro | Instant & Confirmed RSI Divergence Pro 是一个专为实盘交易打造的专业级背离系统,它的设计目标很明确:更快、更准、更稳定。在长期交易美股、A 股与加密货币的过程中,我发现市面上大多数背离指标都有明显缺陷:传统背离确认太慢,动不动延迟 3~8 根 K;快速背离虽然及时,但基本都重绘,复盘好看、实盘没法用;复杂的背离工具则逻辑混乱,视觉杂乱,很难在实盘中形成稳定的执行体系。因此,我希望创建一个真正能反映市场动能变化、适用于实盘、且结构清晰的背离系统。最终形成了 RSI Divergence Pro:即时背离(预测模型)与确认背离(零重绘)双引擎架构。
这个指标由两个核心引擎构成。第一个是即时背离,它基于 RSI 的二阶动能变化来捕捉拐点,无需等待枢轴成型,因此信号非常提前。它能在 K 线创新低但 RSI 不再同步时提醒你,也能在市场动能逐渐衰竭的早期阶段发出信号。即时背离以虚线呈现,可能重绘,但这种“重绘本质上是预判”,可以让你比传统背离提前 1~5 根 K 观察到趋势反转的可能性。第二个是确认背离,它采用“左宽右窄”的不对称枢轴结构:左端保持足够的结构宽度,确保信号含金量;右端使用极窄宽度,让确认信号比传统枢轴快很多。同时确认背离完全不重绘,非常适合实盘与策略回测,所有信号都以实线表现,稳定可靠。
除了核心结构,RSI Divergence Pro 提供了清晰直观的视觉呈现:背离连线、可选文字标签、右端短尾增强设计,使得信号的方向性更明确。它支持所有周期,从 1 分钟到周线都可以使用,同时包含四种提醒触发(即时多、即时空、确认多、确认空),适合自动化或半自动化交易体系。它的逻辑充分考虑了实际交易中“反应速度”与“信号可靠性”的平衡,因此尤其适用于短线交易者、波段交易者、结构分析者以及基于 RSI 建模的量化策略用户。
它带来的价值并不仅仅是“画背离线”,而是在帮助交易者理解市场深层的动能变化。无论是避免追高杀跌、确认趋势衰竭、识别顶部底部结构,还是减少情绪化操作——背离在交易系统中扮演的是风险过滤器和反转预警器的角色。即时背离让你看到别人看不到的早期信号,而确认背离为执行提供可靠依据,从而形成一个可复制、可执行的交易框架。
需要强调的是,即时背离属于预测模型,会因为动能变化而重绘,这是正常的;确认背离则完全不重绘,可以放心用于实盘与回测。背离是信号,不是指令,需结合趋势与结构判断使用。
总结来说,RSI Divergence Pro 的核心价值在于“快、稳、清晰、专业”。它不是为了炫技,而是为了让你在市场结构变化的关键位置更早、更准地获得信息。如果你长期依赖 RSI 或动能分析,它会成为一个真正值得加入工具库的专业级指标。
RSI Divergence Pro is a professional-grade divergence system designed specifically for real trading. Its purpose is simple: to be faster, more accurate, and more stable than traditional divergence tools. After years of trading equities and crypto, I realized that most divergence indicators share the same major weaknesses: classic divergence signals come far too late, often 3–8 bars after the structure forms; fast divergence tools repaint heavily, making them unsuitable for live trading; and more complex indicators are visually cluttered and difficult to execute in real time. I wanted a tool that reveals momentum shifts clearly, works in live markets, and helps traders build a consistent execution framework. That led to the creation of RSI Divergence Pro, a dual-engine system that combines predictive divergence with fully confirmed, non-repainting divergence.
The first engine is Instant Divergence. It is built on RSI momentum inflection rather than pivot structures, allowing signals to appear far earlier. It detects moments when price makes a new low but RSI no longer follows, or when momentum begins to weaken before it becomes visually obvious. Instant signals are drawn with dashed lines and may repaint, because they are predictive by design. This enables early detection 1–5 bars ahead of traditional divergence tools, giving traders an informational edge in momentum reversal scenarios.
The second engine is Confirmed Divergence. It uses an asymmetric pivot model with a wider left side and a narrow right side. The left width preserves structural integrity, while the small right width accelerates signal confirmation, making it significantly faster than standard pivot divergence. All confirmed divergences are fully non-repainting and displayed with solid lines, making them ideal for both live trading and backtesting.
Beyond the core logic, RSI Divergence Pro includes clean and intuitive visual elements: divergence lines, optional labels, and mini stub extensions to highlight direction and momentum. It supports all timeframes—from 1-minute scalping to weekly swing analysis—and provides four types of alert conditions (instant bull, instant bear, confirmed bull, confirmed bear). It is especially suitable for scalpers, swing traders, structural traders, and quantitative traders who rely on RSI-based momentum modeling.
The true value of this tool is not simply drawing divergence lines. It helps traders understand deeper momentum shifts within market structure. It prevents chasing tops and bottoms, identifies trend exhaustion, provides context for reversals, and reduces emotional trading. Instant divergence shows what most traders cannot see, while confirmed divergence provides stable validation, forming a consistent and repeatable execution framework.
It is important to clarify that instant divergence repaints by design—this is part of its predictive nature. Confirmed divergence does not repaint at all and is safe for strategy testing. Divergence is a signal, not a command, and should be interpreted alongside market structure and trend context.
In summary, RSI Divergence Pro focuses on what matters: speed, stability, clarity, and professional-level reliability. It is not built to be flashy but to help traders receive actionable information at the exact moments when momentum and structure begin to shift. For traders who rely on RSI or momentum analysis, this indicator is a powerful addition to any serious trading toolkit.

MACD Divergence Pro | Zero-Lag • No-Repaint中文介绍
MACD 背离 · 快速实时 / 不重绘 · 基于直方图(CN)
多数“MACD 背离”指标要么重绘严重(回测很漂亮、实盘不靠谱),要么触发很滞后(等几根 K 线后才给线/给提醒)。
这个脚本是我在十几版迭代中打磨出的方案(还是跟我的印度导师):在保持收盘级别不重绘的同时,尽可能把信号“提前到条内”,并且把“提前”和“稳健”两种需求拆开、让你按场景选择。
这款脚本为什么更好?
双模式,实盘&回测都可靠
确认模式(不重绘):只在枢轴成立时(上一根确认为顶/底)画线并提醒,收盘后不会改变,适合回测与稳健交易。
预判预览(零延迟,可选):条内一旦出现“价格创更高/更低而柱值更低/更高”的背离形态,就即时画“临时预判线”并提醒;如果形态被否定,会在本根内自动撤回。该模式给你“更早的入场观察”,但可能被取消。
基于 MACD 直方图:直接比较“柱值高/低”和“价格高/低”,不靠模糊的平滑线,背离定义清晰、可见性强。
多重背离/三背离:支持向前连接多段峰/谷,不是只找最近一段,把分层背离也抓出来。
分段规则可控
同侧最小间隔(柱):避免“同一段内频繁连线”。
可选“跨色分段(红→绿→红 / 绿→红→绿)”:只在真正换势后才允许下一段,显著减少“同色内伪背离”。
即时提醒,严格对齐
预判提醒:只有当图表上真的画出了“临时预判线”时才触发,不会“响了但没线”。
确认提醒:当正式背离线落地的那一刻触发,用于“信号确认”。
视觉简洁:顶背离线=红色,底背离线=绿色;标签可开关,不挡柱不抢视线。
通用:适配任意周期、任意交易品种;参数默认即可用,也可按策略微调。
如何使用(建议)
做回测/稳健交易:仅开“确认提醒”,并把“即时模式(条内)”关闭,得到严格不重绘的标注与提醒。
做超短线/埋伏:打开即时模式 + 零延迟预览,启用预判提醒;当预判线出现就会立马提醒(未确认时可能被撤回)。
如想减少“跨段过远”的连线,可调大同侧最小间隔或打开跨色分段。
需要三背离/多背离,可把“最多向前连接几段”设为 3 或更高。
提示:预判是“更早但可能被否定”,确认是“稳健且不重绘”。两者结合,既看得早,也落得稳。
English Description
MACD Divergence • Fast Live / No-Repaint • On Histogram
Most “MACD divergence” indicators either repaint heavily (great in hindsight, unreliable in live trading) or lag badly (you get lines/alerts several bars late).
This script has gone through 10+ iterations to strike the right balance: deliver earlier signals in real-time while keeping a truly no-repaint confirmation path. You decide when you need early preview or strict confirmation.
What makes it different?
Two operating modes—choose per scenario
Confirmation mode (No-Repaint): Lines/alerts are printed only when the pivot is confirmed (previous bar), and they never change after close. Perfect for backtesting and conservative trading.
Zero-Lag Preview (optional): As soon as an in-bar divergence forms on the histogram (price makes a higher high/lower low while the bar value fails), a temporary preview line is drawn immediately and an alert is fired; if invalidated before the bar closes, it’s removed. Earlier visibility with the right caveat.
Histogram-based logic: We compare bar heights against price highs/lows—clear definition and strong visual readability.
Multi-link divergences (incl. triple): Not limited to the nearest swing—you can extend lines across multiple prior pivots to capture stacked divergences.
Controllable segmentation
Minimum bars between same-side pivots to avoid noisy over-linking.
Optional cross-color segmentation (red→green→red / green→red→green) to reduce false divergences within a same-color run.
Alerts that match what you see
Preview alert fires only when a preview line is actually drawn—no more alerts without lines.
Confirmation alert fires when the final line is committed.
Clean visuals: Bearish lines = red, Bullish lines = green; labels are optional to keep the histogram unobstructed.
Works everywhere: Any symbol, any timeframe. Defaults are sensible; parameters can be tuned to your workflow.
Suggested workflow
Backtest / conservative execution: Use Confirmation alerts only, turn Live (in-bar) evaluation off to ensure strict no-repaint behavior.
Scalping / early entries: Turn Live mode + Zero-Lag Preview on and enable Preview alerts—you’ll be notified the moment a preview line appears (it may retract before close).
Increase Min same-side spacing or enable Cross-color segmentation to limit stretched links.
Raise Max links to capture double/triple divergences.
TL;DR: Preview = earlier but retractable. Confirmation = slower but rock-solid. Combine both to see early and act with confidence.

ParabolicSAR+EMA[TS_Indie]🚀 EMA + Parabolic SAR Reversal Trading Strategy
This trading system effectively combines the use of Exponential Moving Averages (EMA) with the Parabolic SAR to identify both price trends and key reversal points. The EMA Fast is used to signal the primary short-term trend, while the EMA Slow acts as a filter for the long-term trend direction. The Parabolic SAR then helps to confirm the reversal signals.
🛠️ Tools Used
1. EMA Fast – Primary Short-Term Trend
2. EMA Slow – Long-Term Trend Filter
3. Parabolic SAR – Reversal Confirmation
🎯 Entry Rules
📈 Buy Setup
1. Trend Filter: EMA Fast > EMA Slow → Uptrend
2. Pullback: Price pulls back and closes below the EMA Fast line.
3. Reversal: Price reverses/pulls back up and closes above the EMA Fast line.
4. SAR Confirmation: The previous Parabolic SAR dot is above the high, and the dot in the current candle is below the low → Reversal signal confirmed.
5. Entry: Enter Buy immediately.
📉 Sell Setup
1. Trend Filter: EMA Fast < EMA Slow → Downtrend
2. Pullback: Price pulls back and closes above the EMA Fast line.
3. Reversal: Price reverses/pulls back down and closes below the EMA Fast line.
4. SAR Confirmation: The previous Parabolic SAR dot is below the low, and the dot in the current candle is above the high → Reversal signal confirmed.
5. Entry: Enter Sell immediately.
💰 Exit Management (Entry, Stop Loss, Take Profit)
1. Entry: Enter the order at the closing price of the signal candle.
2. Stop Loss (SL): Set the Stop Loss at the Parabolic SAR dot.
3. Take Profit (TP): Calculated from the Entry and Stop Loss points, multiplied by the Risk Reward Ratio.
⚙️ Optional Parameters
➭ Custom Risk/Reward Ratio for Take Profit.
➭ Option to add an ATR buffer to the Stop Loss.
➭ Adjustable EMA Fast period.
➭ Adjustable EMA Slow period.
➭ Adjustable Parabolic SAR parameters.
➭ Option to enable Long-only / Short-only positions.
➭ Customizable Backtest start and end date.
➭ Customizable trading session time.
🔔 Alert Function
Alerts display:
➭ Entry Price
➭ Stop Loss Price
➭ Take Profit Price
💡 This strategy allows for many parameter adjustments, such as the MA type, adding/subtracting from the Stop Loss using ATR, and selecting specific sessions for backtesting. If you find interesting or profitable results after adjusting the parameters, please share your comments with other traders!
⚠️ Disclaimer
This indicator is designed for educational and research purposes only. It does not guarantee profits and should not be considered financial advice. Trading in financial markets involves significant risk , including the potential loss of capital.

Trend Entry_0 [TS_Indie]Trend Entry_0 — Mechanism Overview
The core structure of this strategy is based on a price action reversal pattern, as detailed below:
In the case of a Bullish Trend Reversal:
The price initially moves in a bearish direction. When candle A forms a low lower than the previous low, the high of candle A becomes a key reference point.
If the next candle closes above the high of candle A , it confirms a Bullish Trend Reversal.
* Upon a Bullish signal, a Long position is opened at the opening price of the next candle (candle B).
* When a subsequent Bearish signal occurs, the Long position is closed at the opening price of the next candle (candle C).
In the case of a Bearish Trend Reversal:
The price initially moves in a bullish direction. When candle A forms a high higher than the previous high, the low of candle A becomes a key reference point.
If the next candle closes below the low of candle A , it confirms a Bearish Trend Reversal.
* Upon a Bearish signal, a Short position is opened at the opening price of the next candle (candle B).
* When a subsequent Bullish signal occurs, the Short position is closed at the opening price of the next candle (candle C).
Options
* The start and end dates of the backtest can be customized.
* The swing lines of the trend can be displayed as an optional visual aid.
* The user can choose whether to open only Long or Short positions.
Backtest Results and Observations
Based on the backtesting results of this strategy across various assets and timeframes, it has been observed that this approach works best on trending assets such as Gold, BTC, and stocks.
It also performs well on higher timeframes, starting from the Daily timeframe and above, especially when taking Long positions only.
However, when applied to currency pairs such as EUR/USD, the results tend to be less impressive.
I encourage everyone to try backtesting and further developing this strategy — adding new conditions or filters may potentially lead to improved performance.
Disclaimer
This script is intended solely for backtesting purposes, based on a particular price action pattern.
It does not constitute financial or investment advice.
Backtest results do not guarantee future performance.

Quantum Market Harmonics [QMH]# Quantum Market Harmonics - TradingView Script Description
## 📊 OVERVIEW
Quantum Market Harmonics (QMH) is a comprehensive multi-dimensional trading indicator that combines four independent analytical frameworks to generate high-probability trading signals with quantifiable confidence scores. Unlike simple indicator combinations that display multiple tools side-by-side, QMH synthesizes temporal analysis, inter-market correlations, behavioral psychology, and statistical probabilities into a unified confidence scoring system that requires agreement across all dimensions before generating a confirmed signal.
---
## 🎯 WHAT MAKES THIS SCRIPT ORIGINAL
### The Core Innovation: Weighted Confidence Scoring
Most indicators provide binary signals (buy/sell) or display multiple indicators separately, leaving traders to interpret conflicting information. QMH's originality lies in its weighted confidence scoring system that:
1. **Combines Four Independent Methods** - Each framework (described below) operates independently and contributes points to an overall confidence score
2. **Requires Multi-Dimensional Agreement** - Signals only fire when multiple frameworks align, dramatically reducing false positives
3. **Quantifies Signal Strength** - Every signal includes a numerical confidence rating (0-100%), allowing traders to filter by quality
4. **Adapts to Market Conditions** - Different market regimes activate different component combinations
### Why This Combination is Useful
Traditional approaches suffer from:
- **Single-dimension bias**: RSI shows oversold, but trend is still down
- **Conflicting signals**: MACD says buy, but volume is weak
- **No prioritization**: All signals treated equally regardless of strength
QMH solves these problems by requiring multiple independent confirmations and weighting each component's contribution to the final signal. This multi-dimensional approach mirrors how professional traders analyze markets - not relying on one indicator, but waiting for multiple pieces of evidence to align.
---
## 🔬 THE FOUR ANALYTICAL FRAMEWORKS
### 1. Temporal Fractal Resonance (TFR)
**What It Does:**
Analyzes trend alignment across four different timeframes simultaneously (15-minute, 1-hour, 4-hour, and daily) to identify periods of multi-timeframe synchronization.
**How It Works:**
- Uses `request.security()` with `lookahead=barmerge.lookahead_off` to retrieve confirmed price data from each timeframe
- Calculates "fractal strength" for each timeframe using this formula:
```
Fractal Strength = (Rate of Change / Standard Deviation) × 100
```
This creates a momentum-to-volatility ratio that measures trend strength relative to noise
- Computes a Resonance Index when all four timeframes show the same directional bias
- The index averages the absolute strength values when all timeframes align
**Why This Method:**
Fractal Market Hypothesis suggests that price patterns repeat across different time scales. When trends align from short-term (15m) to long-term (Daily), the probability of trend continuation increases substantially. The momentum/volatility ratio filters out low-conviction moves where volatility dominates direction.
**Contribution to Confidence Score:**
- TFR Bullish = +25 points
- TFR Bearish = +25 points (to bearish confidence)
- No alignment = 0 points
---
### 2. Cross-Asset Quantum Entanglement (CAQE)
**What It Does:**
Analyzes correlation patterns between the current asset and three reference markets (Bitcoin, US Dollar Index, and Volatility Index) to identify both normal correlation behavior and anomalous breakdowns that often precede significant moves.
**How It Works:**
- Retrieves price data from BTC (BINANCE:BTCUSDT), DXY (TVC:DXY), and VIX (TVC:VIX) using confirmed bars
- Calculates Pearson correlation coefficient between the main asset and each reference:
```
Correlation = Covariance(X,Y) / (StdDev(X) × StdDev(Y))
```
- Computes an Intermarket Pressure Index by weighting each reference asset's momentum by its correlation strength:
```
Pressure = (Corr₁ × ROC₁ + Corr₂ × ROC₂ + Corr₃ × ROC₃) / 3
```
- Detects "correlation breakdowns" when average correlation drops below 0.3
**Why This Method:**
Markets don't operate in isolation. Inter-market analysis (developed by John Murphy) recognizes that:
- Crypto assets often correlate with Bitcoin
- Risk assets inversely correlate with VIX (fear gauge)
- Dollar strength affects commodity and crypto prices
When these normal correlations break down, it signals potential regime changes. The term "quantum" reflects the interconnected nature of these relationships - like quantum entanglement where distant particles influence each other.
**Contribution to Confidence Score:**
- CAQE Bullish (positive pressure, stable correlations) = +25 points
- CAQE Bearish (negative pressure, stable correlations) = +25 points (to bearish)
- Correlation breakdown = Warning marker (potential reversal zone)
---
### 3. Adaptive Market Psychology Matrix (AMPM)
**What It Does:**
Classifies the current market emotional state into six distinct categories by analyzing the interaction between momentum (RSI), volume behavior, and volatility acceleration (ATR change).
**How It Works:**
The system evaluates three metrics:
1. **RSI (14-period)**: Measures overbought/oversold conditions
2. **Volume Analysis**: Compares current volume to 20-period average
3. **ATR Rate of Change**: Detects volatility acceleration
Based on these inputs, the market is classified into:
- **Euphoria**: RSI > 80, volume spike present, volatility rising (extreme bullish emotion)
- **Greed**: RSI > 70, normal volume (moderate bullish emotion)
- **Neutral**: RSI 40-60, declining volatility (balanced state)
- **Fear**: RSI 40-60, low volatility (uncertainty without panic)
- **Panic**: RSI < 30, volume spike present, volatility rising (extreme bearish emotion)
- **Despair**: RSI < 20, normal volume (capitulation phase)
**Why This Method:**
Behavioral finance principles (Kahneman, Tversky) show that markets follow predictable emotional cycles. Extreme psychological states often mark reversal points because:
- At Euphoria/Greed peaks, everyone bullish has already bought (no buyers left)
- At Panic/Despair bottoms, everyone bearish has already sold (no sellers left)
AMPM provides contrarian signals at these extremes while respecting trends during Fear and Greed intermediate states.
**Contribution to Confidence Score:**
- Psychology Bullish (Panic/Despair + RSI < 35) = +15 points
- Psychology Bearish (Euphoria/Greed + RSI > 65) = +15 points
- Neutral states = 0 points
---
### 4. Time-Decay Probability Zones (TDPZ)
**What It Does:**
Creates dynamic support and resistance zones based on statistical probability distributions that adapt to changing market volatility, similar to Bollinger Bands but with enhancements for trend environments.
**How It Works:**
- Calculates a 20-period Simple Moving Average as the basis line
- Computes standard deviation of price over the same period
- Creates four probability zones:
- **Extreme Upper**: Basis + 2.5 standard deviations (≈99% probability boundary)
- **Upper Zone**: Basis + 1.5 standard deviations
- **Lower Zone**: Basis - 1.5 standard deviations
- **Extreme Lower**: Basis - 2.5 standard deviations (≈99% probability boundary)
- Dynamically adjusts zone width based on ATR (Average True Range):
```
Adjusted Upper = Upper Zone + (ATR × adjustment_factor)
Adjusted Lower = Lower Zone - (ATR × adjustment_factor)
```
- The adjustment factor increases during high volatility, widening the zones
**Why This Method:**
Traditional support/resistance levels are static and don't account for volatility regimes. TDPZ zones are probability-based and mean-reverting:
- Price has ≈99% probability of staying within extreme zones in normal conditions
- Touches to extreme zones represent statistical outliers (high-probability reversal opportunities)
- Zone expansion/contraction reflects volatility regime changes
- ATR adjustment prevents false signals during unusual volatility
The "time-decay" concept refers to mean reversion - the further price moves from the basis, the higher the probability of eventual return.
**Contribution to Confidence Score:**
- Price in Lower Extreme Zone = +15 points (bullish reversal probability)
- Price in Upper Extreme Zone = +15 points (bearish reversal probability)
- Price near basis = 0 points
---
## 🎯 HOW THE CONFIDENCE SCORING SYSTEM WORKS
### Signal Generation Formula
QMH calculates separate Bullish and Bearish confidence scores each bar:
**Bullish Confidence (0-100%):**
```
Base Score: 20 points
+ TFR Bullish: 25 points (if all 4 timeframes aligned bullish)
+ CAQE Bullish: 25 points (if intermarket pressure positive)
+ AMPM Bullish: 15 points (if Panic/Despair contrarian signal)
+ TDPZ Bullish: 15 points (if price in lower probability zones)
─────────
Maximum Possible: 100 points
```
**Bearish Confidence (0-100%):**
```
Base Score: 20 points
+ TFR Bearish: 25 points (if all 4 timeframes aligned bearish)
+ CAQE Bearish: 25 points (if intermarket pressure negative)
+ AMPM Bearish: 15 points (if Euphoria/Greed contrarian signal)
+ TDPZ Bearish: 15 points (if price in upper probability zones)
─────────
Maximum Possible: 100 points
```
### Confirmed Signal Requirements
A **QBUY** (Quantum Buy) signal generates when:
1. Bullish Confidence ≥ User-defined threshold (default 60%)
2. Bullish Confidence > Bearish Confidence
3. No active sell signal present
A **QSELL** (Quantum Sell) signal generates when:
1. Bearish Confidence ≥ User-defined threshold (default 60%)
2. Bearish Confidence > Bullish Confidence
3. No active buy signal present
### Why This Approach Is Different
**Example Comparison:**
Traditional RSI Strategy:
- RSI < 30 → Buy signal
- Result: May buy into falling knife if trend remains bearish
QMH Approach:
- RSI < 30 → Psychology shows Panic (+15 points)
- But requires additional confirmation:
- Are all timeframes also showing bullish reversal? (+25 points)
- Is intermarket pressure turning positive? (+25 points)
- Is price at a statistical extreme? (+15 points)
- Only when total ≥ 60 points does a QBUY signal fire
This multi-layer confirmation dramatically reduces false signals while maintaining sensitivity to genuine opportunities.
---
## 🚫 NO REPAINT GUARANTEE
**QMH is designed to be 100% repaint-free**, which is critical for honest backtesting and reliable live trading.
### Technical Implementation:
1. **All Multi-Timeframe Data Uses Confirmed Bars**
```pinescript
tf1_close = request.security(syminfo.tickerid, "15", close , lookahead=barmerge.lookahead_off)
```
Using `close ` instead of `close ` ensures we only reference the previous confirmed bar, not the current forming bar.
2. **Lookahead Prevention**
```pinescript
lookahead=barmerge.lookahead_off
```
This parameter prevents the function from accessing future data that wouldn't be available in real-time.
3. **Signal Timing**
Signals appear on the bar AFTER all conditions are met, not retroactively on the bar where conditions first appeared.
### What This Means for Users:
- **Backtest Accuracy**: Historical signals match exactly what you would have seen in real-time
- **No Disappearing Signals**: Once a signal appears, it stays (though price may move against it)
- **Honest Performance**: Results reflect true predictive power, not hindsight optimization
- **Live Trading Reliability**: Alerts fire at the same time signals appear on the chart
The dashboard displays "✓ NO REPAINT" to confirm this guarantee.
---
## 📖 HOW TO USE THIS INDICATOR
### Basic Trading Strategy
**For Trend Followers:**
1. **Wait for Signal Confirmation**
- QBUY label appears below a bar = Confirmed bullish entry opportunity
- QSELL label appears above a bar = Confirmed bearish entry opportunity
2. **Check Confidence Score**
- 60-70%: Moderate confidence (consider smaller position size)
- 70-85%: High confidence (standard position size)
- 85-100%: Very high confidence (consider larger position size)
3. **Enter Trade**
- Long entry: Market or limit order near signal bar
- Short entry: Market or limit order near signal bar
4. **Set Targets Using Probability Zones**
- Long trades: Target the adjusted upper zone (lime line)
- Short trades: Target the adjusted lower zone (red line)
- Alternatively, target the basis line (yellow) for conservative exits
5. **Set Stop Loss**
- Long trades: Below recent swing low minus 1 ATR
- Short trades: Above recent swing high plus 1 ATR
**For Mean Reversion Traders:**
1. **Wait for Extreme Zones**
- Price touches extreme lower zone (dotted red line below)
- Price touches extreme upper zone (dotted lime line above)
2. **Confirm with Psychology**
- At lower extreme: Look for Panic or Despair state
- At upper extreme: Look for Euphoria or Greed state
3. **Wait for Confidence Build**
- Monitor dashboard until confidence exceeds threshold
- Requires patience - extreme touches don't always reverse immediately
4. **Enter Reversal**
- Target: Return to basis line (yellow SMA 20)
- Stop: Beyond the extreme zone
**For Position Traders (Longer Timeframes):**
1. **Use Daily Timeframe**
- Set chart to daily for longer-term signals
- Signals will be less frequent but higher quality
2. **Require High Confidence**
- Filter setting: Min Confidence Score 80%+
- Only take the strongest multi-dimensional setups
3. **Confirm with Resonance Background**
- Green tinted background = All timeframes bullish aligned
- Red tinted background = All timeframes bearish aligned
- Only enter when background tint matches signal direction
4. **Hold for Major Targets**
- Long trades: Hold until extreme upper zone or opposite signal
- Short trades: Hold until extreme lower zone or opposite signal
---
## 📊 DASHBOARD INTERPRETATION
The QMH Dashboard (top-right corner) provides real-time market analysis across all four dimensions:
### Dashboard Elements:
1. **✓ NO REPAINT**
- Green confirmation that signals don't repaint
- Always visible to remind users of signal integrity
2. **SIGNAL: BULL/BEAR XX%**
- Shows dominant direction (whichever confidence is higher)
- Displays current confidence percentage
- Background color intensity reflects confidence level
3. **Psychology: **
- Current market emotional state
- Color coded:
- Orange = Euphoria (extreme bullish emotion)
- Yellow = Greed (moderate bullish emotion)
- Gray = Neutral (balanced state)
- Purple = Fear (uncertainty)
- Red = Panic (extreme bearish emotion)
- Dark red = Despair (capitulation)
4. **Resonance: **
- Multi-timeframe alignment strength
- Positive = All timeframes bullish aligned
- Negative = All timeframes bearish aligned
- Near zero = Timeframes not synchronized
- Emoji indicator: 🔥 (bullish resonance) ❄️ (bearish resonance)
5. **Intermarket: **
- Cross-asset pressure measurement
- Positive = BTC/DXY/VIX correlations supporting upside
- Negative = Correlations supporting downside
- Warning ⚠️ if correlation breakdown detected
6. **RSI: **
- Current RSI(14) reading
- Background colors: Red (>70 overbought), Green (<30 oversold)
- Status: OB (overbought), OS (oversold), or • (neutral)
7. **Status: READY BUY / READY SELL / WAIT**
- Quick trade readiness indicator
- READY BUY: Confidence ≥ threshold, bias bullish
- READY SELL: Confidence ≥ threshold, bias bearish
- WAIT: Confidence below threshold
### How to Use Dashboard:
**Before Entering a Trade:**
- Verify Status shows READY (not WAIT)
- Check that Resonance matches signal direction
- Confirm Psychology isn't contradicting (e.g., buying during Euphoria)
- Note Intermarket value - breakdowns (⚠️) suggest caution
**During a Trade:**
- Monitor Psychology shifts (e.g., from Fear to Greed in a long)
- Watch for Resonance changes that could signal exit
- Check for Intermarket breakdown warnings
---
## ⚙️ CUSTOMIZATION SETTINGS
### TFR Settings (Temporal Fractal Resonance)
- **Enable/Disable**: Turn TFR analysis on/off
- **Fractal Sensitivity** (5-50, default 14):
- Lower values = More responsive to short-term changes
- Higher values = More stable, slower to react
- Recommendation: 14 for balanced, 7 for scalping, 21 for position trading
### CAQE Settings (Cross-Asset Quantum Entanglement)
- **Enable/Disable**: Turn CAQE analysis on/off
- **Asset 1** (default BTC): Reference asset for correlation analysis
- **Asset 2** (default DXY): Second reference asset
- **Asset 3** (default VIX): Third reference asset
- **Correlation Length** (10-100, default 20):
- Lower values = More sensitive to recent correlation changes
- Higher values = More stable correlation measurements
- Recommendation: 20 for most assets, 50 for less volatile markets
### Psychology Settings (Adaptive Market Psychology Matrix)
- **Enable/Disable**: Turn AMPM analysis on/off
- **Volume Spike Threshold** (1.0-5.0x, default 2.0):
- Lower values = Detect smaller volume increases as spikes
- Higher values = Only flag major volume surges
- Recommendation: 2.0 for stocks, 1.5 for crypto
### Probability Settings (Time-Decay Probability Zones)
- **Enable/Disable**: Turn TDPZ visualization on/off
- **Probability Lookback** (20-200, default 50):
- Lower values = Zones adapt faster to recent price action
- Higher values = Zones based on longer statistical history
- Recommendation: 50 for most uses, 100 for position trading
### Filter Settings
- **Min Confidence Score** (40-95%, default 60%):
- Lower threshold = More signals, more false positives
- Higher threshold = Fewer signals, higher quality
- Recommendation: 60% for active trading, 75% for selective trading
### Visual Settings
- **Show Entry Signals**: Toggle QBUY/QSELL labels on chart
- **Show Probability Zones**: Toggle zone visualization
- **Show Psychology State**: Toggle dashboard display
---
## 🔔 ALERT CONFIGURATION
QMH includes four alert conditions that can be configured via TradingView's alert system:
### Available Alerts:
1. **Quantum Buy Signal**
- Fires when: Confirmed QBUY signal generates
- Message includes: Confidence percentage
- Use for: Entry notifications
2. **Quantum Sell Signal**
- Fires when: Confirmed QSELL signal generates
- Message includes: Confidence percentage
- Use for: Entry notifications or exit warnings
3. **Market Panic**
- Fires when: Psychology state reaches Panic
- Use for: Contrarian opportunity alerts
4. **Market Euphoria**
- Fires when: Psychology state reaches Euphoria
- Use for: Reversal warning alerts
### How to Set Alerts:
1. Right-click on chart → "Add Alert"
2. Condition: Select "Quantum Market Harmonics"
3. Choose alert type from dropdown
4. Configure expiration, frequency, and notification method
5. Create alert
**Recommendation**: Set alerts for Quantum Buy/Sell signals with "Once Per Bar Close" frequency to avoid intra-bar false triggers.
---
## 💡 BEST PRACTICES
### For All Users:
1. **Backtest First**
- Test on your specific market and timeframe before live trading
- Different assets may perform better with different confidence thresholds
- Verify that the No Repaint guarantee works as described
2. **Paper Trade**
- Practice with signals on a demo account first
- Understand typical signal frequency for your timeframe
- Get comfortable with the dashboard interpretation
3. **Risk Management**
- Never risk more than 1-2% of capital per trade
- Use proper stop losses (not just mental stops)
- Position size based on confidence score (larger size at higher confidence)
4. **Consider Context**
- QMH signals work best in clear trends or at extremes
- During tight consolidation, false signals increase
- Major news events can invalidate technical signals
### Optimal Use Cases:
**QMH Works Best When:**
- ✅ Markets are trending (up or down)
- ✅ Volatility is normal to elevated
- ✅ Price reaches probability zone extremes
- ✅ Multiple timeframes align
- ✅ Clear inter-market relationships exist
**QMH Is Less Effective When:**
- ❌ Extremely low volatility (zones contract too much)
- ❌ Sideways choppy markets (conflicting timeframes)
- ❌ Flash crashes or news events (correlations break down)
- ❌ Very illiquid assets (irregular price action)
### Session Considerations:
- **24/7 Markets (Crypto)**: Works on all sessions, but signals may be more reliable during high-volume periods (US/European trading hours)
- **Forex**: Best during London/New York overlap when volume is highest
- **Stocks**: Most reliable during regular trading hours (not pre-market/after-hours)
---
## ⚠️ LIMITATIONS AND RISKS
### This Indicator Cannot:
- **Predict Black Swan Events**: Sudden unexpected events invalidate technical analysis
- **Guarantee Profits**: No indicator is 100% accurate; losses will occur
- **Replace Risk Management**: Always use stop losses and proper position sizing
- **Account for Fundamental Changes**: Company news, economic data, etc. can override technical signals
- **Work in All Market Conditions**: Less effective during extreme low volatility or major news events
### Known Limitations:
1. **Multi-Timeframe Lag**: Uses confirmed bars (`close `), so signals appear one bar after conditions met
2. **Correlation Dependency**: CAQE requires sufficient history; may be less reliable on newly listed assets
3. **Computational Load**: Multiple `request.security()` calls may cause slower performance on older devices
4. **Repaint of Dashboard**: Dashboard updates every bar (by design), but signals themselves don't repaint
### Risk Warnings:
- Past performance doesn't guarantee future results
- Backtesting results may not reflect actual trading results due to slippage, commissions, and execution delays
- Different markets and timeframes may produce different results
- The indicator should be used as a tool, not as a standalone trading system
- Always combine with your own analysis, risk management, and trading plan
---
## 🎓 EDUCATIONAL CONCEPTS
This indicator synthesizes several established financial theories and technical analysis concepts:
### Academic Foundations:
1. **Fractal Market Hypothesis** (Edgar Peters)
- Markets exhibit self-similar patterns across time scales
- Implemented via multi-timeframe resonance analysis
2. **Behavioral Finance** (Kahneman & Tversky)
- Investor psychology drives market inefficiencies
- Implemented via market psychology state classification
3. **Intermarket Analysis** (John Murphy)
- Asset classes correlate and influence each other predictably
- Implemented via cross-asset correlation monitoring
4. **Mean Reversion** (Statistical Arbitrage)
- Prices tend to revert to statistical norms
- Implemented via probability zones and standard deviation bands
5. **Multi-Timeframe Analysis** (Technical Analysis Standard)
- Higher timeframe trends dominate lower timeframe noise
- Implemented via fractal resonance scoring
### Learning Resources:
To better understand the concepts behind QMH:
- Read "Intermarket Analysis" by John Murphy (for CAQE concepts)
- Study "Thinking, Fast and Slow" by Daniel Kahneman (for psychology concepts)
- Review "Fractal Market Analysis" by Edgar Peters (for TFR concepts)
- Learn about Bollinger Bands (for TDPZ foundation)
---
## 🔄 VERSION HISTORY AND UPDATES
**Current Version: 1.0**
This is the initial public release. Future updates will be published using TradingView's Update feature (not as separate publications). Planned improvements may include:
- Additional reference assets for CAQE
- Optional machine learning-based weight optimization
- Customizable psychology state definitions
- Alternative probability zone calculations
- Performance metrics tracking
Check the "Updates" tab on the script page for version history.
---
## 📞 SUPPORT AND FEEDBACK
### How to Get Help:
1. **Read This Description First**: Most questions are answered in the detailed sections above
2. **Check Comments**: Other users may have asked similar questions
3. **Post Comments**: For general questions visible to the community
4. **Use TradingView Messaging**: For private inquiries (if available)
### Providing Useful Feedback:
When reporting issues or suggesting improvements:
- Specify your asset, timeframe, and settings
- Include a screenshot if relevant
- Describe expected vs. actual behavior
- Check if issue persists with default settings
### Continuous Improvement:
This indicator will evolve based on user feedback and market testing. Constructive suggestions for improvements are always welcome.
---
## ⚖️ DISCLAIMER
This indicator is provided for **educational and informational purposes only**. It does **not constitute financial advice, investment advice, trading advice, or any other type of advice**.
**Important Disclaimers:**
- You should **not** rely solely on this indicator to make trading decisions
- Always conduct your own research and due diligence
- Past performance is not indicative of future results
- Trading and investing involve substantial risk of loss
- Only trade with capital you can afford to lose
- Consider consulting with a licensed financial advisor before trading
- The author is not responsible for any trading losses incurred using this indicator
**By using this indicator, you acknowledge:**
- You understand the risks of trading
- You take full responsibility for your trading decisions
- You will use proper risk management techniques
- You will not hold the author liable for any losses
---
## 🙏 ACKNOWLEDGMENTS
This indicator builds upon the collective knowledge of the technical analysis and trading community. While the specific implementation and combination are original, the underlying concepts draw from:
- The Pine Script community on TradingView
- Academic research in behavioral finance and market microstructure
- Classical technical analysis methods developed over decades
- Open-source indicators that demonstrate best practices in Pine Script coding
Special thanks to TradingView for providing the platform and Pine Script language that make indicators like this possible.
---
## 📚 ADDITIONAL RESOURCES
**Pine Script Documentation:**
- Official Pine Script Manual: www.tradingview.com
**Related Concepts to Study:**
- Multi-timeframe analysis techniques
- Correlation analysis in financial markets
- Behavioral finance principles
- Mean reversion strategies
- Bollinger Bands methodology
**Recommended TradingView Tools:**
- Strategy Tester: To backtest signal performance
- Bar Replay: To see how signals develop in real-time
- Alert System: To receive notifications of new signals
---
**Thank you for using Quantum Market Harmonics. Trade safely and responsibly.**

Institutional Composite Moving Average (ICMA) [Volume Vigilante]Institutional Composite Moving Average (ICMA)
The Next Evolution of Moving Averages — Built for Real Traders.
ICMA blends the strength of four powerful averages (SMA, EMA, WMA, HMA) into a single ultra-responsive, ultra-smooth signal.
It reacts faster than traditional MAs while filtering out noise, giving you clean trend direction with minimal lag.
🔹 Key Features:
• Faster reaction than SMA, EMA, or WMA individually
• Smoother and more stable than raw HMA
• Naturally adapts across trend, momentum, and consolidation conditions
• Zero gimmicks. Zero repainting. Full institutional quality.
🔹 Designed For:
• Scalping
• Swing trading
• Signal engines
• Algorithmic systems
📎 How to Use:
• Overlay it on any chart
• Fine-tune the length per timeframe
• Combine with your entries/exits for maximum edge
Created by Volume Vigilante 🧬 — Delivering Real-World Trading Tools.
SuperTrend MTF Pro [Cometreon]The SuperTrend MTF Pro takes the classic SuperTrend to a whole new level of customization and accuracy. Unlike the standard version, this indicator allows you to select different moving averages, apply it to various chart types, and fine-tune every key parameter.
If you're looking for an advanced, non-repainting, and highly configurable SuperTrend, this is the right choice for you.
🔷 New Features and Improvements
🟩 Multi-MA SuperTrend
Now you can customize the SuperTrend calculation by choosing from 15 different moving averages:
SMA (Simple Moving Average)
EMA (Exponential Moving Average)
WMA (Weighted Moving Average)
RMA (Smoothed Moving Average)
HMA (Hull Moving Average)
JMA (Jurik Moving Average)
DEMA (Double Exponential Moving Average)
TEMA (Triple Exponential Moving Average)
LSMA (Least Squares Moving Average)
VWMA (Volume-Weighted Moving Average)
SMMA (Smoothed Moving Average)
KAMA (Kaufman’s Adaptive Moving Average)
ALMA (Arnaud Legoux Moving Average)
FRAMA (Fractal Adaptive Moving Average)
VIDYA (Variable Index Dynamic Average)
🟩 Multiple Chart Types
You're no longer limited to candlestick charts! Now you can use SuperTrend with different chart formats, including:
Heikin Ashi
Renko
Kagi
Line Break
Point & Figure
🟩 Customizable Timeframe
Now you can adjust the SuperTrend timeframe without repainting issues, avoiding signal distortions.
🔷 Technical Details and Customizable Inputs
SuperTrend offers multiple customization options to fit any trading strategy:
1️⃣ ATR Period – Defines the ATR length, affecting the indicator’s sensitivity.
2️⃣ Source – Selects the price value used for calculations (Close, HL2, Open, etc.).
3️⃣ ATR Mult – Multiplies the ATR to determine band distance. Higher values reduce false signals, lower values make it more reactive.
4️⃣ Change ATR Calculation Method – When enabled, uses the default ATR method; when disabled, allows selecting another Moving Average with "Use Different Type".
5️⃣ Source Break – Defines the price source for trend changes (Close for more stability, High/Low for more reactivity).
6️⃣ Use Different Type – Allows selecting an alternative Moving Average for ATR calculation if "Change ATR Calculation Method" is disabled.
7️⃣ SuperTrend Type – Advanced options for specific MAs (JMA, ALMA, FRAMA, VIDYA), with dedicated parameters like Phase, Sigma, and Offset for optimized responsiveness.
8️⃣ Ticker Settings – Customize parameters for special chart types such as Renko, Heikin Ashi, Kagi, Line Break, and Point & Figure, adjusting reversal, number of lines, and ATR length.
9️⃣ Timeframe – Enables using SuperTrend on a higher timeframe.
🔟 Wait for Timeframe Closes -
✅ Enabled – Prevents multiple signals, useful for precise alerts.
❌ Disabled – Displays SuperTrend smoothly without interruptions.
🔷 How to Use SuperTrend MTF Pro
🔍 Identifying Trends
SuperTrend follows the ongoing trend and provides clear visual signals:
When the price is above the line, the trend is bullish.
When the price is below the line, the trend is bearish.
📈 Interpreting Signals
Line color and position change → Possible trend reversal
Bounce off the line → Potential trend continuation
Strong breakout of the line → Possible reversal
🛠 Integration with Other Tools
RSI or MACD to filter false signals
Moving Averages to confirm trend direction
Support and Resistance to improve entry points
☄️ If you find this indicator useful, leave a Boost to support its development!
Every feedback helps to continuously improve the tool, offering an even more effective trading experience. Share your thoughts in the comments! 🚀🔥

Rabbit Moves - Buy Sell Signals (No Repaint)The Rabbit Moves - Buy Sell Signals (No Repaint) is a powerful TradingView indicator designed to help traders identify potential buy and sell opportunities in the market. By combining the RSI (Relative Strength Index), EMA (Exponential Moving Average), and momentum analysis, this indicator provides clear entry signals for bullish and bearish market movements.
Unlike many repainting indicators, Rabbit Moves ensures reliability by locking in signals once they appear, preventing misleading backtesting results.
How It Works
1. RSI: The Relative Strength Index (RSI) measures the magnitude of recent price changes to evaluate overbought or oversold conditions. A crossover above 50 signals potential bullish momentum, while crossing below 50 suggests bearish momentum.
2. EMA: The Exponential Moving Average (EMA) is used to smooth price data and generate dynamic support or resistance levels. A crossover above the EMA indicates a bullish condition, while a cross below suggests a bearish condition.
3. Momentum: The momentum indicator measures the rate of change of the price and confirms whether the trend is strengthening (bullish) or weakening (bearish).
4. Buy/Sell Percentage:
o The indicator calculates the Buy (Bullish) and Sell (Bearish) probabilities based on the lookback period, which analyzes recent price action to determine how often the market has closed in either direction.
o The Buy Percentage is calculated by determining the number of times the price moved upwards in the past lookback bars, expressed as a percentage of the total observations.
o The Sell Percentage is the inverse, showing the percentage of times the price moved down in the same lookback period.
o These percentages help you assess the likelihood of the next candlestick closing in the predicted direction (up or down), offering additional confirmation for your trades.
Additionally, the indicator calculates the probability of bullish or bearish moves within a defined lookback period. These probabilities are displayed on the chart as percentages, helping traders assess market sentiment.
How to Use the Indicator
1. How to Access
o Kindly check out authors instructions, how you can access this indicator
2. Interpreting the Signals
o Green upward arrow → Indicates a potential buy signal.
o Red downward arrow → Indicates a potential sell signal.
o Probability Display → Shows the likelihood of bullish vs. bearish movements based on historical data.
3. Enhancing Your Strategy
o Use this indicator in combination with support & resistance levels, volume analysis, and price action for better accuracy.
o Apply risk management techniques, such as stop-loss orders and position sizing, to minimize losses.
Why Use This Indicator?
✅ No Repainting – Ensures accurate backtesting and real-time reliability.
✅ Probability-Based Insights – Helps gauge market sentiment before making a trade.
✅ Combines Multiple Technical Factors – Increases accuracy by using RSI, EMA, and momentum together.
✅ Easy-to-Use Signals – Clear buy/sell alerts with visual representation on the chart.
This indicator is designed to work on Forex, Crypto, Stocks, and other financial markets.
Disclaimer:
This indicator is intended solely for educational and informational purposes. It does not constitute financial or investment advice. Trading in financial markets involves significant risk, and past performance is not indicative of future results. Users are responsible for their own trading decisions and should carefully evaluate their risk tolerance and objectives. Always seek professional financial advice before engaging in trading activities.

Xmaster Formula Indicator [TradingFinder] No Repaint Strategies🔵 Introduction
The Xmaster Formula Indicator is a powerful tool for forex trading, combining multiple technical indicators to provide insights into market trends, support and resistance levels, and price reversals. Developed in the early 2010s, it is widely valued for generating reliable buy and sell signals.
Key components include Exponential Moving Averages (EMA) for identifying trends and price momentum, and MACD (Moving Average Convergence Divergence) for analyzing trend strength and direction.
The Stochastic Oscillator and RSI (Relative Strength Index) enhance accuracy by signaling potential price reversals. Additionally, the Parabolic SAR assists in identifying trend reversals and managing risk.
By integrating these tools, the Xmaster Formula Indicator provides a comprehensive view of market conditions, empowering traders to make informed decisions.
🔵 How to Use
The Xmaster Formula Indicator offers two distinct methods for generating signals: Standard Mode and Advance Mode. Each method caters to different trading styles and strategies.
Standard Mode :
In Standard Mode, the indicator uses normalized moving average data to generate buy and sell signals. The difference between the short-term (10-period) and long-term (38-period) EMAs is calculated and normalized to a 0-100 scale.
Buy Signal : When the normalized value crosses above 55, accompanied by the trend line turning green, a buy signal is generated.
Sell Signal : When the normalized value crosses below 45, and the trend line turns red, a sell signal is issued.
This mode is simple, making it ideal for traders looking for straightforward signals without the need for additional confirmations.
Advance Mode :
Advance Mode combines multiple technical indicators to provide more detailed and robust signals.
This method analyzes trends by incorporating :
🟣 MACD
Buy Signal : When the MACD histogram bars are positive.
Sell Signal : When the MACD histogram bars are negative.
🟣 RSI
Buy Signal : When RSI is below 30, indicating oversold conditions.
Sell Signal : When RSI is above 70, suggesting overbought conditions.
🟣 Stochastic Oscillator
Buy Signal : When Stochastic is below 20.
Sell Signal : When Stochastic is above 80.
🟣 Parabolic SAR
Buy Signal : When SAR is below the price.
Sell Signal : When SAR is above the price.
A signal is generated in Advance Mode only when all these indicators align :
Buy Signal : All conditions point to a bullish trend.
Sell Signal : All conditions indicate a bearish trend.
This mode is more comprehensive and suitable for traders who prefer deeper analysis and stronger confirmations before executing trades.
🔵 Settings
Method :
Choose between "Standard" and "Advance" modes to determine how signals are generated. In Standard Mode, signals are based on normalized moving average data, while in Advance Mode, signals rely on the combination of MACD, RSI, Stochastic Oscillator, and Parabolic SAR.
Moving Average Settings :
Short Length : The period for the short-term EMA (default is 10).
Mid Length : The period for the medium-term EMA (default is 20).
Long Length : The period for the long-term EMA (default is 38).
MACD Settings :
Fast Length : The period for the fast EMA in the MACD calculation (default is 12).
Slow Length : The period for the slow EMA in the MACD calculation (default is 26).
Signal Line : The signal line period for MACD (default is 9).
Stochastic Settings :
Length : The period for the Stochastic Oscillator (default is 14).
RSI Settings :
Length : The period for the Relative Strength Index (default is 14).
🔵 Conclusion
The Xmaster Formula Indicator is a versatile and reliable tool for forex traders, offering both simplicity and advanced analysis through its Standard and Advance modes. In Standard Mode, traders benefit from straightforward signals based on normalized moving average data, making it ideal for quick decision-making.
Advance Mode, on the other hand, provides a more detailed analysis by combining multiple indicators like MACD, RSI, Stochastic Oscillator, and Parabolic SAR, delivering stronger confirmations for critical market decisions.
While the Xmaster Formula Indicator offers valuable insights and reliable signals, it is important to use it alongside proper risk management and other analytical methods. By leveraging its capabilities effectively, traders can enhance their trading strategies and achieve better outcomes in the dynamic forex market.

Leading T3Hello Fellas,
Here, I applied a special technique of John F. Ehlers to make lagging indicators leading. The T3 itself is usually not realling the classic lagging indicator, so it is not really needed, but I still publish this indicator to demonstrate this technique of Ehlers applied on a simple indicator.
The indicator does not repaint.
In the following picture you can see a comparison of normal T3 (purple) compared to a 2-bar "leading" T3 (gradient):
The range of the gradient is:
Bottom Value: the lowest slope of the last 100 bars -> green
Top Value: the highest slope of the last 100 bars -> purple
Ehlers Special Technique
John Ehlers did develop methods to make lagging indicators leading or predictive. One of these methods is the Predictive Moving Average, which he introduced in his book “Rocket Science for Traders”. The concept is to take a difference of a lagging line from the original function to produce a leading function.
The idea is to extend this concept to moving averages. If you take a 7-bar Weighted Moving Average (WMA) of prices, that average lags the prices by 2 bars. If you take a 7-bar WMA of the first average, this second average is delayed another 2 bars. If you take the difference between the two averages and add that difference to the first average, the result should be a smoothed line of the original price function with no lag.
T3
To compute the T3 moving average, it involves a triple smoothing process using exponential moving averages. Here's how it works:
Calculate the first exponential moving average (EMA1) of the price data over a specific period 'n.'
Calculate the second exponential moving average (EMA2) of EMA1 using the same period 'n.'
Calculate the third exponential moving average (EMA3) of EMA2 using the same period 'n.'
The formula for the T3 moving average is as follows:
T3 = 3 * (EMA1) - 3 * (EMA2) + (EMA3)
By applying this triple smoothing process, the T3 moving average is intended to offer reduced noise and improved responsiveness to price trends. It achieves this by incorporating multiple time frames of the exponential moving averages, resulting in a more accurate representation of the underlying price action.
Thanks for checking this out and give a boost, if you enjoyed the content.
Best regards,
simwai
---
Credits to @loxx

Adaptive Fisherized Z-scoreHello Fellas,
It's time for a new adaptive fisherized indicator of me, where I apply adaptive length and more on a classic indicator.
Today, I chose the Z-score, also called standard score, as indicator of interest.
Special Features
Advanced Smoothing: JMA, T3, Hann Window and Super Smoother
Adaptive Length Algorithms: In-Phase Quadrature, Homodyne Discriminator, Median and Hilbert Transform
Inverse Fisher Transform (IFT)
Signals: Enter Long, Enter Short, Exit Long and Exit Short
Bar Coloring: Presents the trade state as bar colors
Band Levels: Changes the band levels
Decision Making
When you create such a mod you need to think about which concepts are the best to conclude. I decided to take Inverse Fisher Transform instead of normalization to make a version which fits to a fixed scale to avoid the usual distortion created by normalization.
Moreover, I chose JMA, T3, Hann Window and Super Smoother, because JMA and T3 are the bleeding-edge MA's at the moment with the best balance of lag and responsiveness. Additionally, I chose Hann Window and Super Smoother because of their extraordinary smoothing capabilities and because Ehlers favours them.
Furthermore, I decided to choose the half length of the dominant cycle instead of the full dominant cycle to make the indicator more responsive which is very important for a signal emitter like Z-score. Signal emitters always need to be faster or have the same speed as the filters they are combined with.
Usage
The Z-score is a low timeframe scalper which works best during choppy/ranging phases. The direction you should trade is determined by the last trend change. E.g. when the last trend change was from bearish market to bullish market and you are now in a choppy/ranging phase confirmed by e.g. Chop Zone or KAMA slope you want to do long trades.
Interpretation
The Z-score indicator is a momentum indicator which shows the number of standard deviations by which the value of a raw score (price/source) is above or below the mean value of what is being observed or measured. Easily explained, it is almost the same as Bollinger Bands with another visual representation form.
Signals
B -> Buy -> Z-score crosses above lower band
S -> Short -> Z-score crosses below upper band
BE -> Buy Exit -> Z-score crosses above 0
SE -> Sell Exit -> Z-score crosses below 0
If you were reading till here, thank you already. Now, follows a bunch of knowledge for people who don't know the concepts I talk about.
T3
The T3 moving average, short for "Tim Tillson's Triple Exponential Moving Average," is a technical indicator used in financial markets and technical analysis to smooth out price data over a specific period. It was developed by Tim Tillson, a software project manager at Hewlett-Packard, with expertise in Mathematics and Computer Science.
The T3 moving average is an enhancement of the traditional Exponential Moving Average (EMA) and aims to overcome some of its limitations. The primary goal of the T3 moving average is to provide a smoother representation of price trends while minimizing lag compared to other moving averages like Simple Moving Average (SMA), Weighted Moving Average (WMA), or EMA.
To compute the T3 moving average, it involves a triple smoothing process using exponential moving averages. Here's how it works:
Calculate the first exponential moving average (EMA1) of the price data over a specific period 'n.'
Calculate the second exponential moving average (EMA2) of EMA1 using the same period 'n.'
Calculate the third exponential moving average (EMA3) of EMA2 using the same period 'n.'
The formula for the T3 moving average is as follows:
T3 = 3 * (EMA1) - 3 * (EMA2) + (EMA3)
By applying this triple smoothing process, the T3 moving average is intended to offer reduced noise and improved responsiveness to price trends. It achieves this by incorporating multiple time frames of the exponential moving averages, resulting in a more accurate representation of the underlying price action.
JMA
The Jurik Moving Average (JMA) is a technical indicator used in trading to predict price direction. Developed by Mark Jurik, it’s a type of weighted moving average that gives more weight to recent market data rather than past historical data.
JMA is known for its superior noise elimination. It’s a causal, nonlinear, and adaptive filter, meaning it responds to changes in price action without introducing unnecessary lag. This makes JMA a world-class moving average that tracks and smooths price charts or any market-related time series with surprising agility.
In comparison to other moving averages, such as the Exponential Moving Average (EMA), JMA is known to track fast price movement more accurately. This allows traders to apply their strategies to a more accurate picture of price action.
Inverse Fisher Transform
The Inverse Fisher Transform is a transform used in DSP to alter the Probability Distribution Function (PDF) of a signal or in our case of indicators.
The result of using the Inverse Fisher Transform is that the output has a very high probability of being either +1 or –1. This bipolar probability distribution makes the Inverse Fisher Transform ideal for generating an indicator that provides clear buy and sell signals.
Hann Window
The Hann function (aka Hann Window) is named after the Austrian meteorologist Julius von Hann. It is a window function used to perform Hann smoothing.
Super Smoother
The Super Smoother uses a special mathematical process for the smoothing of data points.
The Super Smoother is a technical analysis indicator designed to be smoother and with less lag than a traditional moving average.
Adaptive Length
Length based on the dominant cycle length measured by a "dominant cycle measurement" algorithm.
Happy Trading!
Best regards,
simwai
---
Credits to
@cheatcountry
@everget
@loxx
@DasanC
@blackcat1402

Ehlers Combo Strategy🚀 Presenting the Enhanced Ehlers Combo Strategy 🚀
Hello Traders! 👋 I'm thrilled to share the latest version of the Ehlers Combo Strategy v2.0. This powerful algorithm combines Ehlers Elegant Oscillator, Decycler, Instantaneous Trendline, Spearman Rank, and introduces the Signal to Noise Ratio for even more precise trading signals.
📊 Strategy Highlights:
Ehlers Elegant Oscillator: Captures market momentum and turning points.
Ehlers Decycler: Filters out market noise for clearer trend signals.
Instantaneous Trendline: Offers a dynamic view of the market trend.
Spearman Rank: Analyzes market rank correlations for enhanced insights.
Signal to Noise Ratio (SNR): Filters out noise for more accurate signals.
💡 Key Features & Customizations:
Adaptive Length: Enable adaptive length based on the market's current conditions.
SNR Threshold: Set your desired SNR threshold for filtering signals.
Exit Length: Define the length for exit signals.
📈 Trading Signals:
Long Entry: Elegant Oscillator and Decycler cross above 0, source crosses above Decycler, source is greater than an increasing Instantaneous Trendline, Spearman Rank is positive, and SNR exceeds the threshold.
Long Exit: Source crosses below the Instantaneous Trendline after entering a long position.
Short Entry: Elegant Oscillator and Decycler cross below 0, source crosses below Decycler, source is less than a decreasing Instantaneous Trendline, Spearman Rank is negative, and SNR exceeds the threshold.
Short Exit: Source crosses above the Instantaneous Trendline after entering a short position.
📊 Insights & Enhancements:
Dynamic Length: The strategy adapts its length dynamically based on market conditions.
Improved SNR: Signal to Noise Ratio ensures better filtering of signals.
Enhanced Visualization: The Elegant Oscillator now features improved color coding for a clearer interpretation.
🚨 Disclaimer:
Trading involves risk, and this script should be used judiciously. It's not a guaranteed profit machine, but with careful use, it can be a valuable addition to your toolkit.
Feel free to backtest, tweak, and make it your own! Let's conquer the markets together! 💪📈
🚀✨ Happy Trading! ✨🚀
---
🙌 Credits:
A big shoutout to the original contributors:
@blackcat1402
@cheatcountry
@DasanC

Market Structure [Truth Indie]Market Structure
Market structure is a crucial component of various trading methodologies. If you can accurately map the market structure, tailored to the volatility or assets you are trading, it helps you identify trends clearly and enhances the accuracy of your trading strategies.
This indicator facilitates easy and swift mapping of market structure for traders. The market structure in this indicator consists of 3 types:
1.Fractal structure
2.Internal structure
3.External structure
FRACTAL STRUCTURE MAPPING
-Wick breaks are sufficient for a Fractal break of structure.
-The precise moment when the price breaks a Fractal high or low confirms the break.
BULLISH & BEARISH FRACTAL STRUCTURE
Bullish Fractal Structure:
-A Fractal high is validated when the subsequent candle fails to surpass its high (fractal pullback).
-A Fractal higher low is validated once the price breaches the Fractal high (always identify the NEAREST Fractal low). This will be the most recent candle that was unable to exceed the high of the previous candle.
Bearish Fractal Structure:
-A Fractal low is validated when the following candle fails to break its low (fractal pullback).
-A Fractal lower high is validated once the price breaks the Fractal low (always identify the NEAREST Fractal high). This will be the most recent candle that was unable to surpass the low of the previous candle.
Settings
-Show or hide text and lines, including adjusting the color of text and lines.
-Adjust the size of text, and change the type of lines, including modifying text when there is a BoS and CHoCH.
-Mark swing when there is a valid pullback, adjust the size and color.
INTERNAL STRUCTURE MAPPING
Body breaks confirm an internal structure break.
BULLISH & BEARISH INTERNAL STRUCTURE
Bullish Internal Structure:
-An internal high is validated with 4 optional criteria.
-An internal higher low is validated when the internal high structure is broken. A higher low refers to the lowest price.
Bearish Internal Structure:
-An internal low is validated with 4 optional criteria.
-An internal lower high is validated when the internal high structure is broken. A lower high refers to the highest price.
Settings
-Show or hide text and lines, including adjusting the color of text and lines.
-Adjust the size of text, and change the type of lines, including modifying text when there is a BoS and CHoCH.
-Mark swing when there is a valid pullback, adjust the size and color.
Validation of pullback has 4 options for exploration, with the default value set to Fractal CHoCH 1 time:
1.Fractal CHoCH 1 time.
2.Fractal CHoCH and wait for Fractal BoS/Fractal CHoCH 3 times in a row.
3.PIP Rule, using PIP to determine the distance of a valid pullback.
-Show or hide lines and values. This option will only display results when you activate the PIP Rule. Change the style of lines and change the color of lines.
-In the PIP field, enter the PIP value you want to explore. In the 1 PIP Size field, enter the decimal places in the asset you are trading. For example, for the EUR/USD pair with decimals at position 4.
4.ATR Rule, utilizing ATR multiples to establish the range of a valid pullback.
-Show or hide lines and values. This option will only display results when you activate the ATR Rule. Change the style of lines and change the color of lines.
-ATR type allows you to choose from 5 ma types. ATR Period adjusts the backward-looking average value you want to explore. Multiple: Enter a multiplier value for ATR to match the volatility or asset you are trading.
If you choose only ATR Rule, the result is the validation of the pullback with ATR Rule only. If you choose more than 1 option, whichever condition is true, the validation pullback occurs immediately. If you don't choose anything, the default value is Internal CHoCH 1 time.
Swing internal structure
-Show or hide text and lines, including adjusting the color of text and lines.
-Adjust the size of text, and change the type of lines, including modifying text.
Equilibrium internal
-Show or hide text and lines, including adjusting the color of text and lines.
-Adjust the size of text, and change the type of lines, including modifying text.
-Adjust the percentage of Equilibrium.
EXTERNAL STRUCTURE MAPPING
Body breaks confirm an internal structure break.
BULLISH & BEARISH EXTERNAL STRUCTURE
Bullish external Structure:
-An external high is validated with 4 optional criteria.
-An external higher low is validated when the external high structure is broken. A higher low refers to the lowest price.
Bearish external Structure:
-An external low is validated with 4 optional criteria.
-An external lower high is validated when the external high structure is broken. A lower high refers to the highest price.
Settings
-Show or hide text and lines, including adjusting the color of text and lines.
-Adjust the size of text, and change the type of lines, including modifying text when there is a BoS and CHoCH.
-Mark swing when there is a valid pullback, adjust the size and color.
Validation of pullback has 4 options for exploration, with the default value set to Internal CHoCH 1 time:
1.Internal CHoCH 1 time.
2.Internal CHoCH and wait for Internal BoS/Internal CHoCH 3 times in a row.
3.PIP Rule, using PIP to determine the distance of a valid pullback.
-Show or hide lines and values. This option will only display results when you activate the PIP Rule. Change the style of lines and change the color of lines.
-In the PIP field, enter the PIP value you want to explore. In the 1 PIP Size field, enter the decimal places in the asset you are trading. For example, for the EUR/USD pair with decimals at position 4.
4.ATR Rule, utilizing ATR multiples to establish the range of a valid pullback.
-Show or hide lines and values. This option will only display results when you activate the ATR Rule. Change the style of lines and change the color of lines.
-ATR type allows you to choose from 5 ma types. ATR Period adjusts the backward-looking average value you want to explore. Multiple: Enter a multiplier value for ATR to match the volatility or asset you are trading.
If you choose only ATR Rule, the result is the validation of the pullback with ATR Rule only. If you choose more than 1 option, whichever condition is true, the validation pullback occurs immediately. If you don't choose anything, the default value is Internal CHoCH 1 time.
Swing external structure
-Show or hide text and lines, including adjusting the color of text and lines.
-Adjust the size of text, and change the type of lines, including modifying text.
Equilibrium external
-Show or hide text and lines, including adjusting the color of text and lines.
-Adjust the size of text, and change the type of lines, including modifying text.
-Adjust the percentage of Equilibrium.
The values of these 4 options are: 1. PIP Rule in the internal structure 2. ATR Rule in the internal structure 3. PIP Rule in the external structure 4. ATR Rule in the external structure
These 4 options will be displayed only when the rule is selected along with choosing to display the value.
DISCLAIMER
All investments involve risks. Profit or loss depends on your knowledge, understanding, and decisions.
My scripts/indicators/strategies are created for researching past price behavior only. They are not investment advice, and future results are not guaranteed.

SMC Fair Value Gap[Truth Indie]FVG (Fair Value Gap)
FVG is another component used in the SMC Concept.
This indicator will help you quickly identify FVG along with customizable market structure.
HISTORY FVG SETTING
-You can choose to show or hide the FVG (Fair Value Gap).
-You can choose to expand the History FVG to the right.
-You can change the number of History Internal FVG.
-You can change the number of History External FVG.
FVG Setting
-You can adjust the strength of the imbalance candlestick.
An example:
The imbalance candlestick in the image has a strength of 124.6 times compared to the previous candlestick.
FVG TEXT/COLOR SETUP
-You can change the name of FVG.
-Adjust the font size and color.
-Adjust the color of the FVG BOX and History BOX.
Market Structure
Comprising the process of breaking the price structure, resulting in BOS (Breakout of Structure) or CHoCH (Change of Character High), and creating new High or Low based on the price structure.
Structure Setting
1.You can choose to show or hide the swing of the structure.
2.Adjust the font size and color.
3.When the market forms a price structure with High and Low, when the price moves to disrupt the structure in either direction, it will lead to BOS or CHoCH, resulting in a new High or Low. You can adjust the method of breaking the structure using the close, high, or low.
Miner Inducement Setting
4.You can choose to show or hide the Minor Inducement.
5.You can choose to show or hide the Fibo Minor Inducement.
6.When price break the price structure, a High or Low will be formed on one side, and it will lead to an Inducement Swing. When the price moves and collides, it will create a price range of High and Low. You can adjust the method of breaking the structure using the close, high, or low.
7.There is an option for testing Fibonacci (Fibo). Its function is similar to the Inducement Swing. You can adjust the Fibonacci settings.
8.Adjust the length of the Minor Inducement swing.
- In this section, it functions similarly to Pivot Points High Low, capturing swings based on the specified length.
9.Adjust Fibo Minor Inducement.
- Fibo IDM helps filter Swing IDM.
- When the market is in an uptrend, IDM will be lower than Fibo IDM.
- When the market is in a downtrend, IDM will be higher than Fibo IDM.
-Adjust the font size.
-Adjust the color of the Fibo Minor Inducement.
-Adjust the color of the Fibo for break.
-Show or hide the Label Swing.
An example of a market in a downtrend.
1. Fibo IDM filters out Swing IDM that is above the Fibo line.
2. IDM occurs above the Fibo line in a downtrending market and below the Fibo line in an uptrending market.
3. An example of the Pivot Points High Low indicator with the length set to 3.
Premium & Discount Zone
-The Premium & Discount Zone will appear based on the current price structure. It helps you see the price zones you are interested in.
-You can adjust the %Premium & Discount as needed.
-Show or hide the premium & discount zone.
-Adjust the font size.
-Adjust the color of the premium & discount zone.
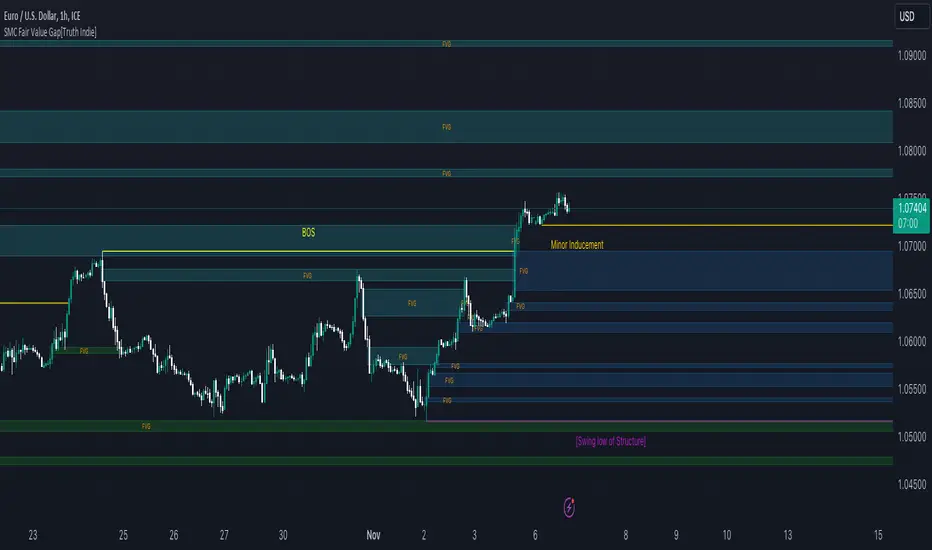
SMC Order Block [Truth Indie]Smart Money Concept (SMC)
For me, SMC is a trading philosophy that stems from those with knowledge and understanding of the structure of the Smart Money group's trading system. It is developed through the observation of price behavior.
SMC is related to the Smart Money group or those entities that can influence the market, such as financial institutions, banks, or funds. Market movements are often driven by market fundamentals or economics. The Smart Money group possesses extensive research data for analyzing the market's fundamentals and has the ability to steer the market in various directions based on market and economic fundamentals at a given time.
The SMC concept is adapted from the ICT concept, and it was developed and shared by The Inner Circle Trader.
I have been studying and trying to understand SMC for some time, and I have many questions I would like to explore. The challenge lies in the fact that different sources of knowledge on this topic often have varying teachings, and my proficiency in the English language is limited. As a result, I haven't had the opportunity to study from the primary source, The Inner Circle Trader.
This indicator was created for the purpose of researching Market Structure and Order Blocks, which are integral parts of the SMC Concept.
The fundamental principle for identifying Order Blocks is as follows:
1.Locate swings that create candlestick imbalances.
2.An imbalance refers to a candlestick that is larger than the preceding one and contains a Fair Value Gap (FVG).
This indicator categorizes Order Blocks into four types, and you are encouraged to customize them to suit your preferences.
OB Type1
1.The closing price of candle has an opposite direction to the candle .
2.Candle has a wick longer than its body, by at least 1 times or more (adjustable).
3.Candle has a wick longer than candle , by at least 2 times or more (adjustable).
4.There is a Fair Value Gap (FVG) between the wicks of candle and .
OB Type1_HTF
-This condition is the same as OB Type1, but it involves analyzing 6 candles instead. This means looking at a larger time frame, twice as big as the original one.
OB Type2
1.The closing price of candle has the opposite direction to candle .
2.Candle has a body larger than its wick by at least 1 times or more (adjustable).
3.Candle has a body larger than candle by at least 2 times or more (adjustable).
4.There is a Fair Value Gap (FVG) between the wicks of candle and .
OB Type2_HTF means observing a larger time frame, specifically twice as big as the previous one.
OB Type3
1.The closing price of candle has the same direction as candle .
2.Candle has a wick longer than its body, by at least 1 times or more (adjustable).
3.Candle has a wick longer than candle , by at least 2 times or more (adjustable).
4.There is a Fair Value Gap (FVG) between the wicks of candle and .
OB Type3_HTF means observing a larger time frame, specifically twice as big as the previous one.
OB Type4
1.The closing price of candle has the same direction as candle .
2.Candle has a body larger than its wick by at least 1 times or more (adjustable).
3.Candle has a body larger than candle by at least 2 times or more (adjustable).
4.There is a Fair Value Gap (FVG) between the wicks of candle and .
OB Type4_HTF is an indicator that involves looking at a larger time frame, specifically twice as big as the original one.
Order Block Setting
1.Click to activate the OB search in different Types.
2.Adjust the body of the candle .
3.Adjust the strength of the candle or the Imbalance candle.
4.You can change the name of OB.
5.Adjust the font size and color.
6.Adjust the color of the OB BOX and History BOX.
7.Adjust the font of OB HTF.
1.It refers to the value of W for a specific candle.
2.It refers to the value of Im for a specific candle.
3.It refers to the values of W and Im in the HTF.
4.For OB Type1 and Type3, a higher W value will search for candles with a larger wick and a smaller body. When the W value is lower, it will search for candles with a smaller wick and a larger body, moving from low to high.
5.For OB Type2 and Type4, a lower W value will search for candles with a smaller wick and a larger body. When the W value is higher, it will search for candles with a larger wick and a smaller body, moving from high to low.
Market Structure
Comprising the process of breaking the price structure, resulting in BOS (Breakout of Structure) or CHoCH (Change of Character High), and creating new High or Low based on the price structure.
1.When the market forms a price structure with High and Low, when the price moves to disrupt the structure in either direction, it will lead to BOS or CHoCH, resulting in a new High or Low. You can adjust the method of breaking the structure using the close, high, or low.
2.When you break the price structure, a High or Low will be formed on one side, and it will lead to an Inducement Swing. When the price moves and collides, it will create a price range of High and Low. You can adjust the method of breaking the structure using the close, high, or low.
3.There is an option for testing Fibonacci (Fibo). Its function is similar to the Inducement Swing. You can adjust the Fibonacci settings.
Premium & Discount Zone
1.The Premium & Discount Zone will appear based on the current price structure. It helps you see the price zones you are interested in.
2.You can adjust the %Premium & Discount as needed.
3.The OB (Order Block) will be displayed when a price structure of High and Low forms within the Premium & Discount Zone. The OB in this indicator is not a recommendation to buy or sell. You need to research and test various conditions before making trading decisions.
Everyone's trading strategies are different, and it comes down to backtesting and selecting the strategy that suits your individual needs. Hopefully, this indicator will assist the TradingView community of traders in their trading endeavors.
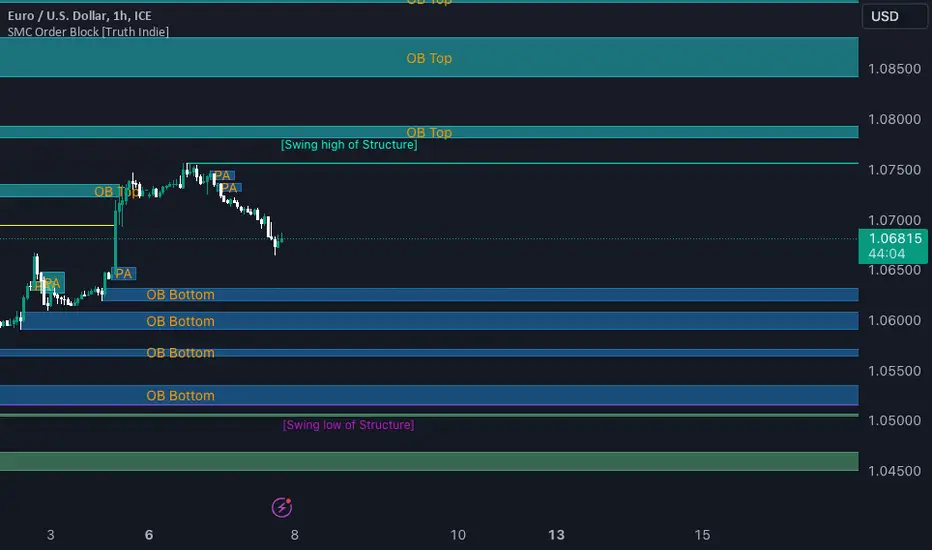
ATR_RSI_Strategy v2 with no repaint [liwei666]🎲 Overview
🎯 this is a optimized version based on ATR_RSI_Strategy with no-repaint.
Sharpe ratio: 1.4, trade times: 116 ,
trade symbol: BINANCE:BTCUSDTPERP 15M
you can get same backtesting result with the correct settings.
🎲 Strategy Logic
🎯 the core logic is quite simple, use ATR and RSI and SMA
1. when price is in high volatility ( atr_value > atr_ma);
2. wait for a break signal (rsi_value > rsi_buy or rsi_value < rsi_sell);
3. entry Long or Short,use trailing stop-loss to max security and percent TP to keep profit.
🎲 Settings
🎯 there are 7 input properties in script, but I only finetune 4 of them ( bold field below ),
you may change other parameter to get better result by yourself.
atr_length: length to get atr value
atr_ma_length : length of smoothing atr value
atr_ma_norm_min : atr_ma normalized min value, filter high volatility ranges
atr_ma_norm_max : atr_ma normalized max value, filter high volatility ranges
rsi_length : length to get rsi value
rsi_entry: 50 +/- rsi_entry to get entry threshold
trailing_percent: trailing stop-loss percent
🎲 Usage
🎯 the commission set to 0.05% , part of exchange the commission is less than 0.05% in reality,
but I will still use 0.05% in my next script.
🎯 this script use 50% of equity to size positions follow general script position,
you can adjust the value to fix size or 100% of equity to compare result with other strategy,
but I still suggest you use 5-10% of equity for each strategy in reality.
🎯any questions please comment below. if there are any words violate House Rule, please tell me below and i will revise immediately
don't want be hiddened again 😂😂
Additionally, I plan to publish 20 profitable strategies in 2023;
let‘s witness it together!
Hope this strategy will be usefull for you :)
enjoy! 🚀🚀🚀

Adaptive Fisherized ROCIntroduction
Hello community, here I applied the Inverse Fisher Transform, Ehlers dominant cycle determination and smoothing methods on a simple Rate of Change (ROC) indicator
You have a lot of options to adjust the indicator.
Usage
The rate of change is most often used to measure the change in a security's price over time.
That's why it is a momentum indicator.
When it is positive, prices are accelerating upward; when negative, downward.
It is useable on every timeframe and could be a potential filter for you your trading system.
IMO it could help you to confirm entries or find exits (e.g. you have a long open, roc goes negative, you exit).
If you use a trend-following strategy, you could maybe look out for red zones in an in uptrend or green zones in a downtrend to confirm your entry on a pullback.
Signals
ROC above 0 => confirms bullish trend
ROC below 0 => confirms bearish trend
ROC hovers near 0 => price is consolidating
Enjoy! 🚀
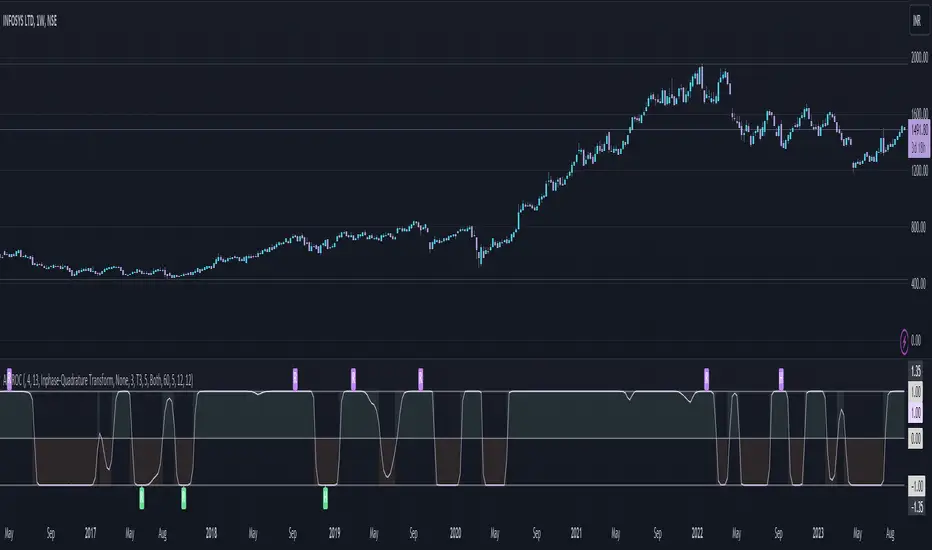
Multi Supertrend with no-repaint HTF option strategyThis is the strategy version of the multi supertrend indicator.
The RoMDD looks good :)
Checked in ETHUSDT 1hour with auto HTF ON.
Have a look :)

Multi Supertrend with no-repaint and HTF optionThis indicator has 2 Supertrends to filter the trend.
The Default one uses the same timeframe as chart.
The additional Supertrend is non-repaint type and can run on higher timeframes.
It has an auto-higher timeframe selection option, thanks to LonesomeTheBlue, the original author.
It is accurate on current timeframe also.
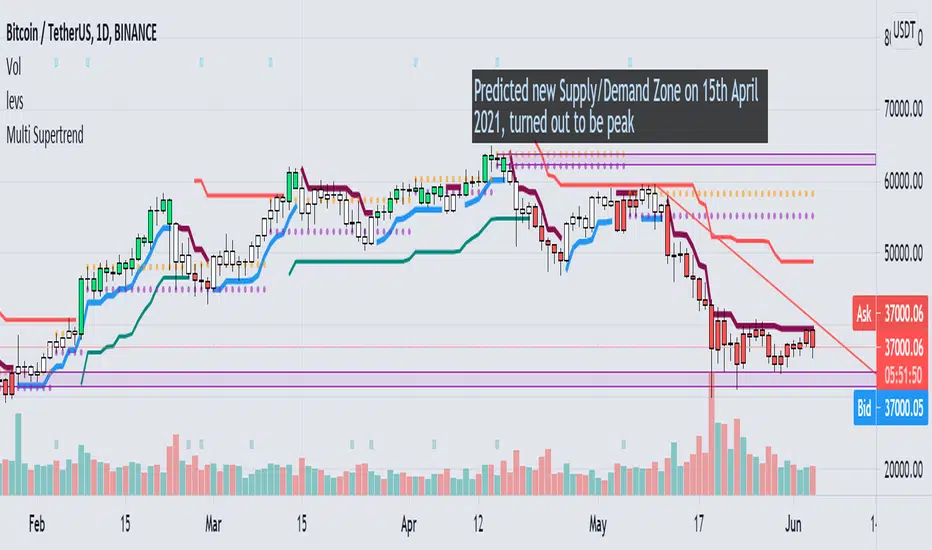
NVME Trend-MeterNVME Trend Meter is a trend confirming indicator that uses our main algorithm to help confirm trends on multi-timeframes. This can be useful for your analysis and trading style for any pair you go to. The NVME Trend Meter can be used to see if the market sentiment is looking bullish or bearish and with this you will know what direction to trade in too!
There are 5 Timeframes displayed on the indicator: The daily, the 4 hourly, the hourly, the 30 minutes and the 15 minutes timeframe.
NVME Trend Meter is to be used as a confluence with your analysis or trading style and should not in anyway shape or form be used as a indication to buy or sell just because the signal says so, it is there to give you a higher chance of having a high probability trade though past results is not indicative of future results and getting access doesn't mean you will become a millionaire in a day as it is not a get rich quick indicator so it won't guarantee 100% success.
Does it support all chart types?
Yes, all charts are supported with the trend meter.
Features:
/Basic Settings
-Trend Significance (Input value, this will change the strength of the trend to be analysed)
-Trend Period (Input Value, this will change the calculation module's intake period in order to confirm a trend)
/Miscellaneous
-Transparency (Input Value, this will change the transparency of the bars)
-Colour Scheme (Changes the colour scheme from the following options: Default, Blue and Orange, Strawberry and Lime, Apple and Mango, Orange and Passionfruit, Rhubarb and Custard, Black and White, Forest Greens, Galaxy)
/Dashboard Settings
-Enable/Disable Dashboard
-Dashboard X Position (Changes the x position of the dashboard)
-Text Colour (Changes the text colour of the dashboard)

Crypto Fox ANN Strategy No RepaintHello traders
This is (( sirolf's ANN Strategy )) i updated it to (( No Repaint Version )) and it still have very good results
The new in strategy : -
1 - The strategy is no repaint now in any time frame
2- Now Strategy have two time frames which make you control strategy in entry and exit positions and you can change it as you want .
3 - Added Back Test range to check Back test results
4 - Strategy is working in 10 % of equity and you can change it as you want .
5- I recommended so much working in 5 min time frame and 15 min time frame to get the best results
but in the same time the strategy is working in all time frames this just my advice for traders
6- I recommend so much using take profit and stop loss to avoid huge movements in markets
