DP_ORB Entry & Exit IndicatorDisclaimer:
This indicator is for educational purposes only. It does not constitute financial advice. Always do your own research and manage your risk. Also, I cannot take full credit for 'ORB' as its a well known strategy amongst many traders, but I do need to give a special shout out to @TheBigDaddyMax for putting me on to this.
DP_ORB Entry & Exit Indicator
Description:
The DP_ORB Entry & Exit Indicator is a powerful tool designed for traders who utilize the Opening Range Breakout (ORB) strategy on the NYSE session. This indicator visually identifies the initial volatility window of the trading day, by marking the 15m High, and 15m Low into a ORB Box, & then tracks breakout opportunities, and provides clear, dynamic trade management levels—all directly on your chart.
Key Features:
Automatic Opening Range (ORB) Box:
Identifies and plots the high and low of the user-defined opening range (default 9:30–9:45 NYSE) for visual reference and strategy foundation.
Breakout Entry Signals:
Automatically detects and marks long or short breakout entries when price closes above or below the ORB range, with additional momentum confirmation.
Dynamic Stop Loss:
Stop loss is intelligently set to the previous bar’s low for long trades (or high for shorts), adapting to market structure at entry.
Take Profit Targets:
Up to three fully adjustable take-profit levels are plotted, calculated as percentages from entry, supporting progressive trade management.
Visual Trade Management:
Entry, stop loss, and take profit levels are displayed as extending dashed lines from entry point to the current bar, with labels always shown just to the right of price for clarity on all timeframes.
Automatic Reset and Cleanup:
Visuals and logic reset daily and upon exit, ensuring a clean, uncluttered chart experience.
How to Use:
Set your preferred opening range time and take profit levels in the settings.
Wait for a breakout and confirmation during the NYSE session.
Use the on-chart lines and labels to manage your trade according to your risk and strategy plan.
Best For:
Day traders and scalpers seeking a disciplined, visual, and fully-automated approach to opening range breakout trading.
Openingrangebreakout

RTH Standard Deviation+RTH Standard Deviation+ Indicator
Overview
The RTH Standard Deviation+ (RTH SD+) indicator is a versatile tool designed for traders to visualize key price levels based on the Regular Trading Hours (RTH) session.
It calculates and displays the high, low, equilibrium (midpoint), and standard deviation-based levels derived from the RTH session's price range.
This indicator is ideal for day traders and swing traders looking to identify potential support, resistance, and breakout zones.
Features
Customizable Session Window: Define the RTH session based on your preferred time window and timezone.
Key Price Levels: Displays high, low, equilibrium, 25%/75% quartile levels, and standard deviation levels (±0.5, ±1.0, ±1.33, ±1.66, ±2.0, and optional extended levels up to ±4.0).
Visual Elements: Includes horizontal lines, labels, boxes, and vertical lines to highlight key levels and session boundaries.
Flexible Styling: Customize line styles, colors, thicknesses, and visibility for all elements.
Extended Levels: Optional display of additional standard deviation levels (±2.25, ±2.33, ±2.5, ±2.66, ±2.75, ±3.0, ±3.25, ±3.33, ±3.5, ±3.66, ±3.75, ±4.0).
Deviation Boxes: Visualize specific standard deviation ranges (±0.1, ±1.33/1.66, ±2.33/2.66, ±3.33/3.66) with customizable colors.
Inputs
Session Window: Set the RTH session time (default: 06:00–09:00).
Timezone: Select the appropriate timezone (default: UTC-4).
Label Offset: Adjust the horizontal offset for price level labels (default: 5 bars).
Line Offset: Set the length of horizontal lines extending from the session end (default: 20 bars).
Show SD Levels: Toggle visibility of standard deviation lines (±0.5, ±1.0, ±1.33, ±1.66, ±2.0).
Show SD Labels: Enable or disable labels for standard deviation levels.
Show SD Boxes: Display shaded boxes for specific standard deviation ranges (e.g., ±1.33/1.66).
Show ±0.1 Dev Boxes: Highlight smaller deviation ranges (±0.1) with boxes.
Vertical Line: Toggle a vertical line at the session end, with customizable color, style, and thickness.
High/Low, Equilibrium, 25%/75%, ±0.1 Dev, ±1.33/1.66: Toggle visibility and customize colors, styles, and thicknesses for these levels.
Extended Levels: Enable additional standard deviation levels (e.g., ±2.25, ±2.5, etc.) for advanced analysis.
How It Works
Session Tracking: The indicator identifies the user-defined RTH session based on the specified time window and timezone.
It tracks the high, low, and equilibrium (midpoint) of the session's price action.
Price Range Calculation: At the session's end, the indicator calculates the price range (high - low) and uses it to compute standard deviation levels relative to the high, low, or equilibrium.
Level Visualization:
High/Low Lines: Display the session's high and low prices as horizontal lines, extended beyond the session end.
Equilibrium Line: Shows the midpoint of the session range.
Quartile Lines: Plots 25% and 75% levels within the session range.
Standard Deviation Lines: Displays levels at ±0.5, ±1.0, ±1.33, ±1.66, and ±2.0 standard deviations, with optional extended levels up to ±4.0.
Deviation Boxes: Shaded boxes highlight specific ranges (e.g., ±1.33/1.66) for quick reference.
±0.1 Deviation Lines/Boxes: Optional smaller deviation levels for precise analysis.
Dynamic Updates: During the session, high and low lines update in real-time. At session end, all levels are finalized and extended forward for post-session analysis.
Clearing Mechanism: When a new session begins, previous drawings are cleared to avoid clutter.
Usage
Add to Chart: Apply the indicator to your TradingView chart via the Pine Editor or Indicator menu.
Configure Settings:
Adjust the session window and timezone to match your market (e.g., 09:30–16:00 UTC-4 for US equities RTH).
Customize visibility, colors, styles, and thicknesses to suit your chart preferences.
Enable extended levels for deeper analysis or disable them for simplicity.
Interpret Levels:
High/Low: Act as potential support/resistance or breakout levels.
Equilibrium: Represents the session's midpoint, often a pivot point.
25%/75% Quartiles: Indicate intermediate levels within the session range.
Standard Deviation Levels: Highlight statistically significant price zones for potential reversals or breakouts.
Boxes: Emphasize key zones for quick visual reference.
Trading Application: Use levels to identify entry/exit points, set stop-losses, or gauge market volatility.
For example, ±1.0 standard deviation levels often act as strong support/resistance, while ±2.0 levels may indicate overextension.
Notes
Ensure the session window aligns with the market’s trading hours for accurate calculations.
The indicator is designed for intraday and post-session analysis but can be adapted for other timeframes.
Use in conjunction with other technical analysis tools for comprehensive decision-making.
Extended levels (±2.25 and beyond) are disabled by default to reduce chart clutter but can be enabled for specific strategies.
TradingView House Rules Compliance
This indicator contains no copyrighted material and adheres to TradingView’s Pine Script guidelines.
This indicator was approved and created with @TIMELESS1_

Open Range Breakout (ORB) with Alerts
🚀 ChartsAlgo – Open Range Breakout (ORB) with Alerts
The Open Range Breakout (ORB) Indicator by ChartsAlg is designed for intraday traders looking to capitalize on price movements after the market’s opening range. This tool is especially effective for futures (MNQ, MES) and high-volatility stocks or crypto where initial volatility sets the tone for the session.
This indicator identifies a user-defined opening range window, plots the high/low lines of that range, and visually alerts users when price breaks out above or below the range — with options to customize breakout repetitions, background fill, and alerts.
💡 What is an Open Range Breakout (ORB)?
The opening range represents the high and low established during the first few minutes of the trading session — usually 15 or 30 minutes. Many intraday strategies are based on the idea that breaking out of this initial range often signals strong momentum and trend continuation.
Traders often enter:
Long when price breaks above the range high.
Short when price breaks below the range low.
⚙️ How It Works
You define a session window (e.g., 09:30–09:45 EST).
The indicator tracks the high and low during this time.
Once the session ends, the high and low become your range breakout levels.
The indicator then:
Plots lines for visual clarity
Optionally fills background between the range
Triggers breakout signals if price crosses the levels
Provides alerts when breakouts occur
🛠️ Settings Breakdown
🔹 Session Settings
Range Session: Set your preferred window (e.g., 0930–0945). Can be premarket, first 30 mins, or any custom time.
Time zone: Use "America/New York" for EST (default) or change to "GMT+0" for international traders.
🔹 Breakout Settings
Bullish Breakout Signals: Number of allowed breakout alerts above the range.
Bearish Breakout Signals: Number of allowed breakout alerts below the range.
This prevents repeated alerts once breakout has been confirmed.
🔹 Display Settings
Show Background Fill: Fills area between high/low of the range for easier visual analysis.
Show Breakout Signals: Triangle markers plotted on the chart when breakouts happen.
Only Show Today’s Range: Keeps the chart clean by showing only the most current day’s range.
🔹 Color Settings
Range High/Low Line Colors: Choose any color for clarity.
Range Fill Color: Customize the highlight area for your chart style.
📊 Chart Features
Range High/Low Lines: Automatically plotted after range session ends.
Visual Fill Box: Optional background shading between the opening range.
Triangle Breakout Markers: Appear at the breakout candle.
Alerts: Can be used with TradingView’s alert system to notify you of breakouts in real-time.
🔔 Alerts
Two alert conditions are built in:
Bullish Breakout: Triggers when price breaks above the high of the range.
Bearish Breakout: Triggers when price breaks below the low of the range.
Example Alert Message:
📈 “Bullish Breakout above Open Range on AAPL!”
To activate:
Click “🔔 Alerts” on TradingView.
Set condition to this script.
Choose “ORB Breakout Up” or “ORB Breakout Down”.
Choose alert frequency and notification method.
⚠️ DISCLAIMER
ChartsAlgo tools are for informational and educational purposes only.
They are not financial advice or signals. Past performance does not guarantee future results. Use at your own risk and always implement solid risk management.
By using this indicator, you agree that you are solely responsible for any trades or decisions made based on the information provided.

Worldwide Sessions and Open Range BreakoutThis script shows when the various normal market hours for each of the major worldwide markets (Asia, New York, and London). It also draws a line on the opening range for each of these market sessions. The opening range defaults to the first 15 minutes of the session, but this can be customized.
This script does automatically handle the session times regardless of your time zone or what time frame you are on. No need to set anything! This probably can't handle non-normal trading days, such as partial days.
This script is made for futures, but would likely work for other markets, like Forex.

15Min Opening Range & Midline (UTC+2) This TradingView script draws the 15-minute Opening Range of the day based on a user-defined start time and plots the high, low, and midline of this range. It works by capturing the high and low of the first 15 minutes of the session, and then extending them for the rest of the trading day. The midline is calculated as the average of the high and low values.
Key Features:
User-configurable start time: Define the hour and minute for when the opening range should start based on your local time zone.
Line customization: Choose the color and line style (solid, dashed, dotted) for the high, low, and midline.
Easy-to-read visual representation: The high and low lines extend across the chart from the range start, with the midline placed in the center.
Dynamic updates: The indicator resets at the start of each new trading day and updates the opening range lines accordingly.
Perfect for:
Traders looking to monitor the initial market range during the first 15 minutes of trading.
Identifying key support and resistance levels based on early price action.
Providing a midline to assess market bias and potential breakouts.
Notes:
The indicator calculates everything based on the local time zone you define and automatically adjusts to your desired start time.
It will not redraw lines; once drawn, they remain on the chart until the next session.
Opening Range Breakout Detector📈 Opening Range Breakout Detector (TF-Independent)
Tracks breakouts with precision. No matter the chart, no matter the timeframe.
This indicator monitors whether price breaks above or below the Opening Range across multiple key durations — 1m, 5m, 10m, 15m, 30m, 45m, and 60m — using 1-minute data under the hood, while you can work on higher timeframe charts (daily, etc.).
Highlights:
✅ Status table shows which ORs broke UP or DOWN
⏱ Control which timeframes to track
🖼 Customizable table position, size and colors
Crafted by @FunkyQuokka

[TTM] ICT Sessions & Ranges🌟 Overview 🌟
The ICT Sessions & Ranges Indicator helps traders identify key intraday price levels by marking custom session highs/lows and opening ranges.
It helps traders spot potential liquidity grabs, reversals, and breakout zones by tracking price behavior around these key areas
🌟 Session Highs & Lows – Liquidity Zones 🌟
Session highs and lows often attract price due to stop orders resting above or below them. These levels are frequently targeted during high-volatility moves.
🔹 Asia Session
- Usually ranges in low volatility.
- Highs/lows often get swept during early London.
- Price may raid these levels, then reverse.
🔹 London Session
- First major volatility of the day.
- Highs/lows often tested or swept in New York.
- Commonly forms the day’s true high or low.
🌟 Opening Range Concepts 🌟
The Opening Range is the first 15, 30, or 60 minutes of a session (e.g., New York).
The high (ORH) and low (ORL) define the market’s initial balance and key reaction levels.
🔹 Breakout Trade
- Price breaks ORH/ORL with momentum.
- Signals directional intent.
- Traders enter on the breakout, with stops inside the range.
🔹 Liquidity Raid
- Price briefly breaks ORH/ORL to trigger stops.
- Reverses after the sweep.
- Look for structure shift and entry near FVG or OB.
🌟 Customizable Settings 🌟
The indicator includes 3 configurable ranges , each with:
Start & End Time – Set any custom time window.
Display Type – Choose Box (highlight range) or Lines (mark high/low).
Color Settings – Set custom colors for boxes and lines.
🌟 Default Settings 🌟
Range 1 : 19:00–00:00 (Asia Session)
Range 2 : 01:45–05:15 (London Session)
Range 3 : 09:30–10:00 (NY Opening Range – 30m)

Rogue ORB PRORogue ORB Pro is a precision-engineered Opening Range Breakout (ORB) indicator built for active intraday traders who need real signals, not noise.
This tool identifies high-probability breakout entries from the opening range, enhanced with optional ATR-based stop loss levels, deviation targets, cooldown filters, and a relative volume gate to filter weak setups.
🔍 Key Features:
Opening Range High/Low: Drawn from a user-defined time window and locked for the day
Deviations: Automatically plots target zones above and below the OR range (e.g. 1, 2 deviations)
Pre-Market Levels: Automatically draws pre market high and low lines at the end of pre market session
Buy/Sell Signals: Triggered on breakout of the OR High/Low with configurable breakout logic (touch or close)
ATR Stop Loss Line: Dynamically drawn at a fixed ATR distance from breakout candle, with optional SL label
Cooldown Period: Prevents back-to-back signals by enforcing a user-defined bar delay between entries, can help with overtrading
Volume Filter: Optional relative volume filter that requires breakout candles to exceed a custom volume threshold
VWAP Overlay: Visual VWAP for directional bias and confluence

PumpC Opening Range Breakout (ORB) Stretch RangePumpC ORB Stretch
The PumpC ORB Stretch is a volatility-based indicator that helps traders identify potential breakout zones by analyzing how price typically behaves around the open. This tool is inspired by concepts introduced by Toby Crabel in his well-known book “Day Trading with Short-Term Price Patterns and Opening Range Breakout.”
Rather than predicting market direction, this indicator highlights areas where price is likely to expand based on recent volatility. It is designed for traders who prefer dynamic, data-driven breakout levels over static support and resistance zones.
What Is the "Stretch"?
In Toby Crabel’s framework, the Stretch is the average of the smaller of two price moves:
The distance from the open to the high of the bar
The distance from the open to the low of the bar
This smaller value captures the “quiet side” of the candle and reflects recent price compression. Averaged over multiple periods (commonly 10 daily bars), it creates a baseline to assess how far price may move away from the open under typical market conditions.
How the Indicator Works
The PumpC ORB Stretch follows this process:
Uses a higher timeframe (such as daily) to calculate the open, high, and low.
For each bar, measures the smaller of the two distances: open to high or open to low.
Applies a moving average to the result over a user-defined number of bars (default is 10).
Multiplies the average stretch by customizable levels (e.g., 0.382, 1.0, 2.0).
Plots breakout levels above and below the open of the selected timeframe.
The result is a set of adaptive levels that expand or contract with market volatility.
Customization Options
Stretch Timeframe: Choose the timeframe used for stretch calculation (default: Daily).
Stretch Length: Set the number of bars to include in the moving average.
Breakout Levels: Enable or disable individual levels and define multipliers.
Color Settings: Customize colors for each range level for easy visual distinction.
Plot Style: Circular markers are used to reduce chart clutter and improve readability.
How to Use It
Use plotted levels to anticipate possible breakouts from the open.
Adjust stretch length to reflect short-term or longer-term volatility trends.
Combine this tool with momentum indicators, volume, or price action for confirmation.
Use levels to help guide stop placement or profit targets in breakout strategies.
Important Notes
This script is based on an interpretation of Crabel’s concepts and is not affiliated with Crabel Capital or the original author.
The indicator does not predict direction; it is a tool for context and structure.
It is recommended that users test and validate this tool in a simulated environment before applying it to live trading.
This indicator is intended for educational purposes only.
Licensing and Attribution
This script is built entirely in Pine Script v5 and follows TradingView’s open-source standards. It does not include any third-party or proprietary code. If you modify or share it, please credit the original idea and follow all TradingView script publishing rules.

Opening Range BreakoutThis is an Opening Range Breakout script. It will plot the opening range high and low (green and red lines, respectively) as determined by the user input (default is a 15 min window from market open, 9:30 - 9:45 am). The time period for the breakout is also configured by a user input (default is from 9:45 am - 2:30 pm).
Alerts are sent for breakouts either above (bullish) or below (bearish) the opening range high and low. An EMA is also used for trend confirmation before sending alerts for breakouts (to avoid false signals).
A bullish breakout is determined by all of the following being true:
- The current price being above the opening range high (green line)
- The EMA trending up (ie the current value of the EMA > prior EMA value)
- The current price is > the EMA
- The EMA is > the opening range high
A bearish breakout is determined by all of the following being true:
- The current price being below the opening range low (red line)
- The EMA trending down (ie the current value of the EMA < prior EMA value)
- The current price is < the EMA
- the EMA is < the opening range low
Enjoy this simple indicator!

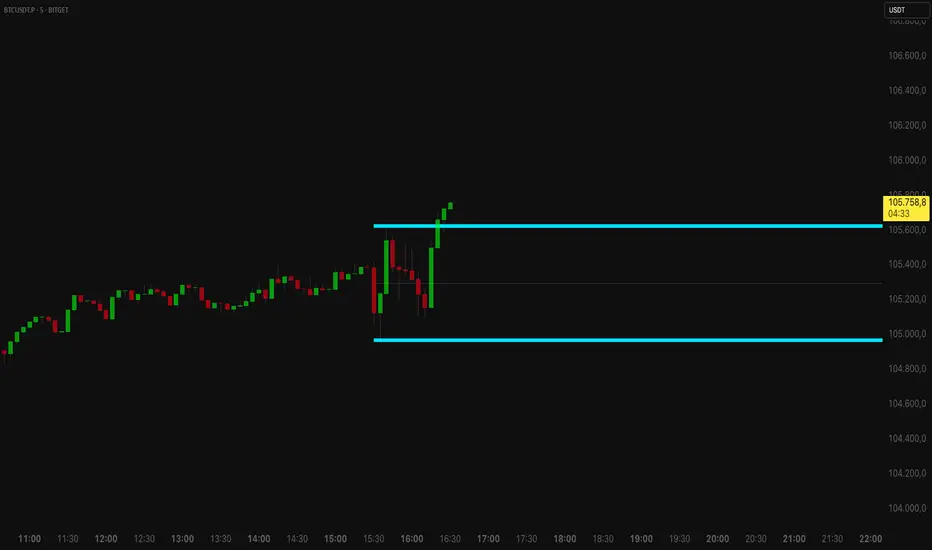
Opening RangeThe Opening Range indicator highlights the high, low, and midpoint of the first hour (1H) of each trading day and the first four hours (4H) of each trading week. These ranges are displayed as rectangles, providing key support, resistance, and breakout levels.
Features
1H Daily Range: Shows the opening range for the first hour of each trading day.
4H Weekly Range: Shows the opening range for the first four hours of each trading week.
Middle Line: Displays a dotted line at the midpoint of each range for additional reference.
Labels: Marks each range with "OR.1H" or "OR.4H" for easy identification.
Customizable: Adjust colors, toggle visibility, and set the number of ranges to display.
How to Use
Use the high and low of the range as potential support and resistance levels.
Watch for breakouts above or below the range for trading opportunities.
Use the midpoint line as a reference for mean reversion or trend analysis.
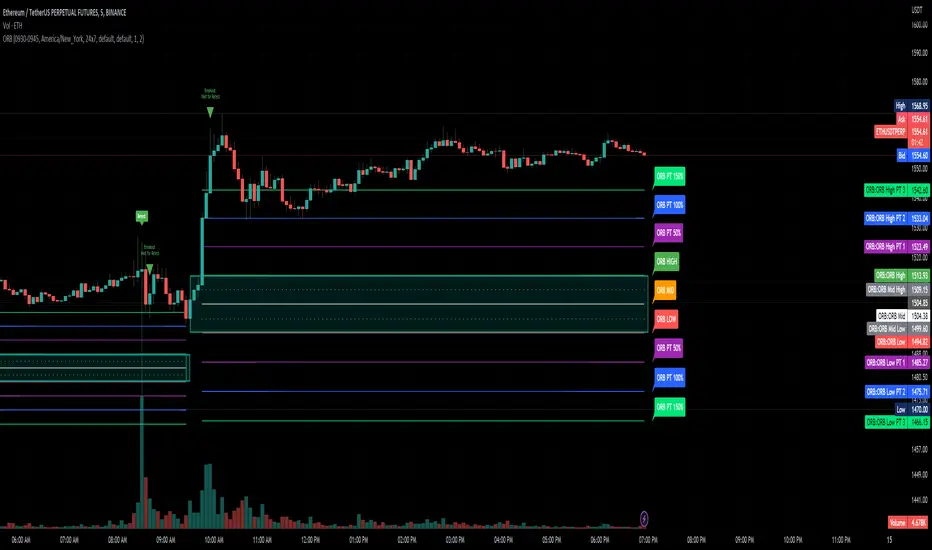
ORB opening range breakoutThis indicator plots the opening range high and low for a selected period of time in minutes after the market opens on an intraday chart to allow the user to visualize the high and low of the opening range for use in the Opening Range Breakout (ORB) strategy.
The Opening Range Breakout (ORB) strategy is a trading approach that involves identifying the price range within the first few minutes of a market session and then waiting for the price to break out of that range. This indicator facilitates this strategy through the use of shaded regions and/or price levels.
Features
Able to plot the high and low for any opening range above 1 min on any intraday timeframe
Fully customizable ORB region, price level, price axis, label
The inclusion of the Bollinger band along with it's Moving Average serves multiple purposes to assist the user in the opening range breakout strategy
Highlights to the user the deviation from the Moving Average due to an opening range breakout so that the user is better informed on whether to avoid entering a position, exit a position, or monitor the situation more closely
Highlights area of support or resistance formed by the Moving Average of Bollinger Band
Inform the user of the current trend direction to serve as confluence during an opening range breakout
What sets this indicator apart from others
In other ORB indicators, the opening range must be a multiple of the current chart's timeframe, restricting users on the intraday timeframes that can be used. E.g. if the user is using the 15 minutes opening range, they are restricted to use the 1, 3, 5, 15 minute(s) chart.
This indicator gives the user the flexibility to set any opening range above 1 min on any intraday timeframe. E.g. if the user is using the 15 minutes opening range, they are free to use any intraday timeframe on their chart, such as 1 hour or 2 hours chart.
How to use
Input the opening time range of interest in minutes
Check the "ORB region" checkbox to shade the ORB region
Check the "PRICE LEVEL" checkbox to draw a horizontal line of the high and low
Check the "PRICE AXIS" checkbox to plot the values on the price axis
Check the "LABEL" checkbox to draw a label of the high and low

Katalyst's Opening Range BreakoutKatalyst's Opening Range Breakout + No Trade Zone
📜 Overview:
This indicator allows traders to visualize the high and low of the opening range for a user-selected timeframe (e.g., 30s, 1m, 5m, 15m). It features fully customizable lines, labels, and an optional **No Trade Zone** fill to help you identify breakout levels with ease.
---
🎯 Key Features:
1. **Customizable Opening Range**:
- Select your preferred opening range duration: **30 seconds, 1 minute, 2 minutes, 5 minutes, 10 minutes, or 15 minutes**.
- The indicator calculates and plots the **high** and **low** of the selected opening range.
2. **Dynamic Line Styling**:
- Choose the **line color**, **transparency**, and **style**: **Solid, Dashed, or Dotted**.
- Lines extend to the right of the chart for clarity.
3. **No Trade Zone** *(Optional / Disabled by default)*:
- When enabled, fills the area between the high and low lines with a customizable **color and transparency**.
- Helps visually identify consolidation areas where trading might be avoided.
4. **Labels for Precision**:
- Clearly displays the **Opening Range High** and **Low** values.
- Labels are color-coded and positioned dynamically for easy interpretation.
5. **Clean and Efficient Updates**:
- The indicator deletes old lines, labels, and fills before creating new ones, ensuring a clutter-free chart.
---
⚙️ How to Use:
1. **Select Your Timeframe**:
- From the settings, choose your desired opening range duration: 30s, 1m, 2m, 5m, 10m, or 15m.
2. **Customize the Visuals**:
- Adjust line color, style, and transparency.
- Enable the **No Trade Zone** for a transparent background fill between the high and low lines.
3. **Interpret the Breakout**:
- Watch for price movements above or below the **opening range** to identify potential breakout opportunities.
---
🛠 Settings:
Opening Range Duration: Select the timeframe for the opening range (30s, 1m, 2m, 5m, 10m, 15m).
Line Color: Set the color of the range lines.
Line Transparency: Adjust the transparency of the lines (0 = solid, 100 = invisible).
Line Style: Choose line style: Solid, Dashed, or Dotted.
Label Colors: Customize the label colors for the high and low values.
Enable No Trade Zone: Fill the area between high and low lines with a transparent color.
No Trade Zone Color: Set the fill color for the no trade zone.
No Trade Zone Transparency: Adjust the transparency of the no trade zone fill.
---
📈 Ideal For
Day traders and scalpers looking to trade **breakouts**.
Traders who want to identify areas of consolidation visually.
Anyone who relies on the **opening range** for their trading strategy.
---
🔍 Example Usage:
Set the opening range to **5 minutes** and enable the **No Trade Zone** with a light red fill.
Watch for price to break above or below the high/low lines to signal potential trade opportunities.
---
✨ Why Use This Indicator?
This script simplifies your breakout strategy by providing a clear, visually appealing representation of the opening range. The flexible customization options and the optional **No Trade Zone** make it a powerful tool for identifying high-probability trades.
---
Let me know if you need any additional tweaks or clarifications for this description. It's all set to help traders understand and use your powerful script! 🚀📈

Negroni Opening Range StrategyStrategy Summary:
This tool can be used to help identify breakouts from a range during a time-zone of your choosing. It plots a pre-market range, an opening range, it also includes moving average levels that can be used as confluence, as well as plotting previous day SESSION highs and lows.
There are several options on how you wish to close out the trades, all described in more detail below.
Back-testing Inputs:
You define your timezone.
You define how many trades to open on any given day.
You decide to go: long only, short only, or long & short (CAREFUL: "Long & Short" can open trades that effectively closes-out existing ones, for better AND worse!)
You define between which times the strategy will open trades.
You define when it closes any open trades (preventing overnight trades, or leaving trades open into US data times!!).
This hopefully helps make back-testing reflect YOUR trading hours.
NOTE: Renko or Heikin-Ashi charts
For ALL strategies, don’t use Renko or Heikin-Ashi charts unless you know EXACTLY the implications.
Specific to my strategy, using a renko chart can make this 85-90% profitable (I wish it was!!) Although they can be useful, renko charts don’t always capture real wicks, so the renko chart may show your trade up-only but your broker (who is not using renko!!) will have likely stopped you out on a wick somewhere along the line.
NOTE: TradingView ‘Deep backtesting’
For ALL strategies, be cynical of all backtesting (e.g. repainting issues etc) as well as ‘Deep backtesting’ results.
Specific to this strategy, the default settings here SHOULD BE OK, but unfortunately at the time of writing, we can’t see on the chart what exactly ‘deep backtesting’ is calculating. In the past I have noted a number of trades that were not closed at the end of the day, despite my ‘end of day’ trade closing being enabled, so there were big winners and losers that would not have materialized otherwise. As I say, this seems ok at these settings but just always be cynical!!
Opening Range Inputs
You define a pre-market range (example: 08:00 - 09:00).
You define an opening range (example: 09:00 - 09:30).
The strategy will give an update at the close of the opening range to let you know if the opening range has broken out the pre-market range (OR Breakout), or if it has remained inside (OR Inside). The label appears at the end of the opening range NOT at the bar that ‘broke-out’.
This is just a visual cue for you, it has no bearing on what the strategy will do.
The strategy default will trade off the pre-market range, but you can untick this if you prefer to trade off the opening range.
Opening Trades:
Strategy goes long when the bar (CLOSE) crosses-over the ‘pre-market’ high (not the ‘opening range’ high); and the time is within your trading session, and you have not maxed out your number of trades for the day!
Strategy goes short when the bar (CLOSE) crosses-under the ‘pre-market’ low (not the ‘opening range low); and the time is within your trading session, and you have not maxed out your number of trades for the day!
Remember, you can untick this if you prefer to trade off the opening range instead.
NOTES:
Using momentum indicators can help (RSI and MACD): especially to trade range plays in failed breakouts, when momentum shifts… but the strategy won’t do this for you!
Using an anchored vwap at the session open can also provide nice confluence, as well as take-profit levels at the upper/lower of 3x standard deviation.
CLOSING TRADES:
You have 6 take-profit (TP) options:
1) Full TP: uses ATR Multiplier - Full TP at the ATR parameters as defined in inputs.
2) Take Partial profits: ATR Multiplier - Takes partial profits based on parameters as defined in inputs (i.e close 40% of original trade at TP1, close another 40% of original trade at TP2, then the remainder at Full TP as set in option 1.).
3) Full TP: Trailing Stop - Applies a Trailing Stop at the number of points, as defined in inputs.
4) Full TP: MA cross - Takes profit when price crosses ‘Trend MA’ as defined in inputs.
5) Scalp: Points - closes at a set number of points, as defined in inputs.
6) Full TP: PMKT Multiplier - places a SL at opposite pre-market Hi/Low (we go long at a break-out of the pre-market high, 50% would place a SL at the pre-market range mid-point; 100% would place a SL at the pre-market low)'. This takes profit at the input set in option 1).

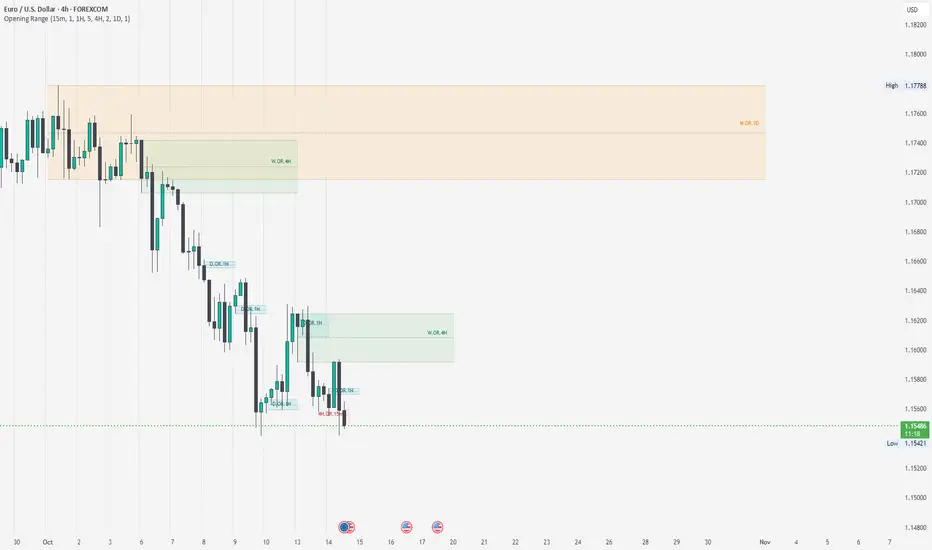
Timely Opening Range Breakout Strategy [TORB] (Zeiierman)█ Overview
The Timely Opening Range Breakout (TORB) indicator builds upon the classic Open Range Breakout (ORB) concept. The ORB strategy is a popular trading setup used to identify trades around the opening range of an asset. It's based on the idea that the first few minutes (15-60 minutes) of trading often set the tone for the rest of the day, with breakouts above or below the opening range signifying potential trends.
TORB refines the concept by stating that a trade is only valid if there is sufficient market activity. This means a breakout beyond the upper or lower range is only of interest during the most active trading hours, as defined by PMMV (Per-Minute Mean Volume)
█ How It Works
ORB
The indicator works by first defining a session's opening range based on user-specified settings, including the session's start and end times and the applicable time zone. During this session, it calculates the high and low price points, which form the basis for identifying potential breakout levels.
PMMV
PMMV (Per-Minute Mean Volume) provides a snapshot of the market's activity level at each minute of the trading day. PMMV is calculated by averaging the trading volume in a one-minute interval over a specified number of trading days. This script uses the average volume over the last N periods to determine the PMMV value. This average volume provides a smoother representation of volume activity compared to using a single volume value. It considers the volume over a broader timeframe, filtering out short-term fluctuations and potentially offering a more reliable indicator of underlying market activity.
TORB
TORB works by integrating the Opening Range Breakout (ORB) highs and lows with the Per-Minute Mean Volume (PMMV) metric to assess the validity of breakouts. The objective is to identify breakouts from the opening high and low levels during periods of heightened market activity, as indicated by PMMV.
█ How to Use
To effectively utilize the Timely Opening Range Breakout (TORB) strategy, follow these steps:
Identify Active Hours: Employ PMMV to pinpoint periods of peak activity within the trading day.
Apply Basic ORB Rules: If the price surpasses the upper range (resistance), buy; if it breaches the lower range (support), sell.
Breakouts
The TORB strategy identifies breakout signals when the price moves beyond the established range, supported by volume exceeding a set threshold. This technique aims to eliminate false signals, focusing on price movements during high market activity.
█ Settings
Session
Trading Session: Customize the trading session's start and end times.
Volume
Volume analysis is integral to the TORB strategy, as it uses volume data to confirm the strength and validity of breakout signals.
Period: Sets the number of periods (or bars) to calculate the average volume, which is then used to assess market activity level.
Sensitivity and Significance: Adjusts how responsive the volume analysis is to changes in trading volume. By adjusting the sensitivity, traders can decide how much emphasis to place on volume spikes, potentially reducing false breakouts and focusing on those supported by significant trading activity.
Breakout Threshold
This setting establishes a criterion to identify when the price movement is significant enough.
Threshold: Traders set a threshold level to identify high market activity. If the PMMV is greater than or equal to this threshold, it indicates significant market activity.
Setting the correct threshold is key to balancing sensitivity and specificity. Too low of a threshold may lead to many false positives, while too high of a threshold might filter out potentially profitable breakouts. This setting helps in pinpointing when market activity indicates a strong move, thereby aligning trade entries with moments of heightened market momentum.
-----------------
Disclaimer
The information contained in my Scripts/Indicators/Ideas/Algos/Systems does not constitute financial advice or a solicitation to buy or sell any securities of any type. I will not accept liability for any loss or damage, including without limitation any loss of profit, which may arise directly or indirectly from the use of or reliance on such information.
All investments involve risk, and the past performance of a security, industry, sector, market, financial product, trading strategy, backtest, or individual's trading does not guarantee future results or returns. Investors are fully responsible for any investment decisions they make. Such decisions should be based solely on an evaluation of their financial circumstances, investment objectives, risk tolerance, and liquidity needs.
My Scripts/Indicators/Ideas/Algos/Systems are only for educational purposes!
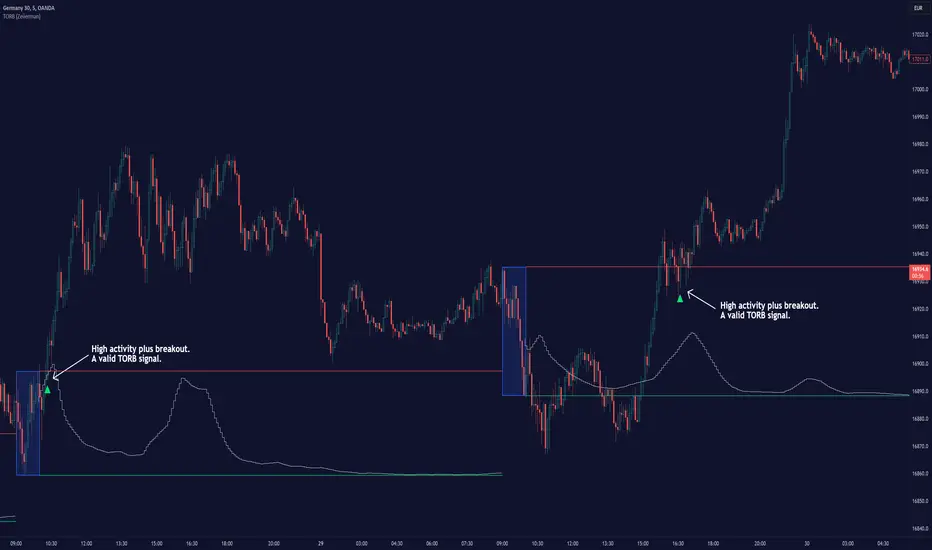
ORB Algo | Flux Charts💎 GENERAL OVERVIEW
Introducing our new ORB Algo indicator! ORB stands for "Opening Range Breakout" which is a common trading strategy. The indicator can analyze the market trend in the current session and give "Buy / Sell", "Take Profit" and "Stop Loss" signals. For more information about the analyzing process of the indicator, you can read "How Does It Work ?" section of the description.
Features of the new ORB Algo indicator :
Buy & Sell Signals
Up To 3 Take Profit Signals
Stop-Loss Signals
Alerts for Buy / Sell, Take-Profit and Stop-Loss
Customizable Algoritm
Session Dashboard
Backtesting Dashboard
📌 HOW DOES IT WORK ?
This indicator works best in 1-minute timeframe. The idea is that the trend of the current session can be forecasted by analyzing the market for a while after the session starts. However, each market has it's own dynamics and the algorithm will need fine-tuning to get the best performance possible. So, we've implemented a "Backtesting Dashboard" that shows the past performance of the algorithm in the current ticker with your current settings. Always keep in mind that past performance does not guarantee future results.
Here are the steps of the algorithm explained briefly :
1. The algorithm follows and analyzes the first 30 minutes (can be adjusted) of the session.
2. Then, algorithm checks for breakouts of the opening range's high or low.
3. If a breakout happens in a bullish or a bearish direction, the algorithm will now check for retests of the breakout. Depending on the sensitivity setting, there must be 0 / 1 / 2 / 3 failed retests for the breakout to be considered as reliable.
4. If the breakout is reliable, the algorithm will give an entry signal.
5. After the position entry, algorithm will now wait for Take-Profit or Stop-Loss zones and signal if any of them occur.
If you wonder how does the indicator find Take-Profit & Stop-Loss zones, you can check the "Settings" section of the description.
🚩UNIQUENESS
While there are indicators that show the opening range of the session, they come short with features like indicating breakouts, entries, and Take-Profit & Stop-Loss zones. We are also aware of that different stock markets have different dynamics, and tuning the algorithm for different markets is really important for better results, so we decided to make the algorithm fully customizable. Besides all that, our indicator contains a detailed backtesting dashboard, so you can see past performance of the algorithm in the current ticker. While past performance does not yield any guarantee for future results, we believe that a backtesting dashboard is necessary for tuning the algorithm. Another strength of this indicator is that there are multiple options for detection of Take-Profit and Stop-Loss zones, which the trader can select one of their liking.
⚙️SETTINGS
Keep in mind that best chart timeframe for this indicator to work is the 1-minute timeframe.
TP = Take-Profit
SL = Stop-Loss
EMA = Exponential Moving Average
OR = Opening Range
ATR = Average True Range
1. Algorithm
ORB Timeframe -> This setting determines the timeframe that the algorithm will analyze the market after a new session begins before giving any signals. It's important to experiment with this setting and find the best option that suits the current ticker for the best performance. More volatile stocks will often require this setting to be larger, while more stabilized stocks may have this setting shorter.
Sensitivity -> This setting determines how much failed retests are needed to take a position entry. Higher senstivity means that less retests are needed to consider the breakout as reliable. If you think that the current ticker makes strong movements in a bullish & bearish direction after a breakout, you should set this setting higher. If you think the opposite, meaning that the ticker does not decide the trend right after a breakout, this setting show be lower.
(High = 0 Retests, Medium = 1 Retest, Low = 2 Retests, Lowest = 3 Retests)
Breakout Condition -> The condition for the algorithm to detect breakouts.
Close = Bar needs to close higher than the OR High Line in a bullish breakout, or lower than the OR Low Line in a bearish breakout. EMA = The EMA of the bar must be higher / lower than OR Lines instead of the close price.
TP Method -> The method for the algorithm to use when determining TP zones.
Dynamic = This TP method essentially tries to find the bar that price starts declining the current trend and going to the other direction, and puts a TP zone there. To achieve this, it uses an EMA line, and when the close price of a bar crosses the EMA line, It's a TP spot.
ATR = In this TP method, instead of a dynamic approach the TP zones are pre-determined using the ATR of the entry bar. This option is generally for traders who just want to know their TP spots beforehand while trading. Selecting this option will also show TP zones at the ORB Dashboard.
"Dynamic" option generally performs better, while the "ATR" method is safer to use.
EMA Length -> This setting determines the length of the EMA line used in "Dynamic TP method" and "EMA Breakout Condition". This is completely up to the trader's choice, though the default option should generally perform well. You might want to experiment with this setting and find the optimal length for the current ticker.
Stop-Loss -> Algorithm will place the Stop-Loss zone using setting.
Safer = The SL zone will be placed closer to the OR High for a bullish entry, and closer to the OR Low for a bearish entry.
Balanced = The SL zone will be placed in the center of OR High & OR Low
Risky = The SL zone will be placed closer to the OR Low for a bullish entry, and closer to the OR High for a bearish entry.
Adaptive SL -> This option only takes effect if the first TP zone is hit.
Enabled = After the 1st TP zone is hit, the SL zone will be moved to the entry price, essentially making the position risk-free.
Disabled = The SL zone will never change.
2. ORB Dashboard
ORB Dashboard shows the information about the current session.
3. ORB Backtesting
ORB Backtesting Dashboard allows you to see past performance of the algorithm in the current ticker with current settings.
Total amount of days that can be backtested depends on your TV subscription.
Backtesting Exit Ratios -> You can select how much of percent your entry will be closed at any TP zone while backtesting. For example, %90, %5, %5 means that %90 of the position will be closed at the first TP zone, %5 of it will be closed at the 2nd TP zone, and %5 of it will be closed at the last TP zone.

Opening Range & Prior Day High/Low [Gorb]Introduction:
Opening Range & Prior Day High/Low indicator is an easy to use day traders tool. This indicator automatically plots the previous days high and low, as well as drawing a box from the opening range that the user specifies in the settings. These two together can help provide an indication of market sentiment and price trends for the day. They are often used as a trading strategy for day traders.
Overview:
The Opening Range , draws a box from the high to the low of the user defined time period and is extended until the end of the trading session. Most common are the 5/15/30min opening ranges.
Prior Day High/Low , draws lines from the previous days high and low that extend across the current session. These are used as support/resistance and also a marker to see market sentiment by crossing one of these levels.
The indicator is designed for all kinds of traders, offering a simple approach to automatically plot levels for you.
Features:
All skill-level friendly presets, easy to enable with one-click
Opening Range: Allows user to choose what time the range starts and ends to measure the high & low.
Extend Range Lines: allows the user to choose when the box stops extending according to the trading session time.
Enable Opening Range Box: allows the user to choose to plot the opening range or not.
ORB Border Color: allows the user to change the box border color.
ORB Box Shade Color: allows the user to change the background of the opening range box.
ORB Line Width: allows users to chose the width of the opening range box lines.
Enable Previous Day High: allows users to enable the previous days high to be plotted.
Enable Previous Day Low: allows users to enable the previous days high to be plotted.
Previous Day High Color: allows users to choose the color for this line.
Previous Day Low Color: allows users to choose the color for this line.
All colors are changeable for the user to customize to their liking.
Usage Demonstration
In the image below, we can see a basic example of how these 3 features function.
As explained above, the opening range is customizable to meet the users needs and can be disabled with one click. Same goes for the prior day high(green) and low(red) lines. All 3 are plotted each day automatically for the user if enabled.
In the image below, we can see an example of using the opening range break and prior day high together for a trading strategy.
This is a great example of using the prior day high with the opening range to use as a day trading strategy. It provides the trader with levels to watch for price to break out from for possible trade setups.
In this next image, we can see a failed breakdown from the opening range that results in a bullish breakout.
The first move was a fake breakdown with the failed rejection on the retest of the opening range lows. This led to a breakout above the range and a confirmation bounce on the breakout retest. Price did break above the prior day high and confirmed with a retest bounce on that level as well.
In the image below, we can see how previous days levels can act as resistance to use with the opening range.
Price didn't reject the opening range low, but it did reject the prior day high for the second time. This could be used as an entry or once price breaks down out of the opening range again.
Conclusion:
We believe in providing user-friendly tools to help speed up traders technical analysis and implement easy trading strategies. The goal is to provide a user-friendly indicator to automatically draw opening ranges and previous days levels to suit the users needs and trading style.
RISK DISCLAIMER
All content, tools, scripts & education provided by Monstanzer or Gorb Algo LLC are for informational & educational purposes only. Trading is risk and most lose their money, past performance does not guarantee future results.

Long-Only Opening Range Breakout (ORB) with Pivot PointsIntraday Trading Strategy: Long-Only Opening Range Breakout (ORB) with Pivot Points
Background:
Opening Range Breakout (ORB) is a popular long-only trading strategy that capitalizes on the early morning volatility in financial markets. It's based on the idea that the initial price movements during the first few minutes or hours of the trading day can set the tone for the rest of the session. The strategy involves identifying a price range within which the asset trades during the opening period and then taking long positions when the price breaks out to the upside of this range.
Pivot Points are a widely used technical indicator in trading. They represent potential support and resistance levels based on the previous day's price action. Pivot points are calculated using the previous day's high, low, and close prices and can help traders identify key price levels for making trading decisions.
How to Use the Script:
Initialization: This script is written in Pine Script, a domain-specific language for trading strategies on the TradingView platform. To use this script, you need to have access to TradingView.
Apply the Script: You can do this by adding it to your favorites, then selecting the script in the indicators list under favorites or by searching for it by name under community scripts.
Customize Settings: The script allows you to customize various settings through the TradingView interface. These settings include:
Opening Session: You can set the time frame for the opening session.
Max Trades per Day: Specify the maximum number of long trades allowed per trading day.
Initial Stop Loss Type: Choose between using a percentage-based stop loss or the previous candles low for stop loss calculations.
Stop Loss Percentage: If you select the percentage-based stop loss, specify the percentage of the entry price for the stop loss.
Backtesting Start and End Time: Set the time frame for backtesting the strategy.
Strategy Signals:
The script will display pivot points in blue (R1, R2, R3, R4, R5) and half-pivot points in gray (R0.5, R1.5, R2.5, R3.5, R4.5) on your chart.
The green line represents the opening range.
The script generates long (buy) signals based on specific conditions:
---The open price is below the opening range high (h).
---The current high price is above the opening range high.
---Pivot point R1 is above the opening range high.
---It's a long-only strategy designed to capture upside breakouts.
---It also respects the maximum number of long trades per day.
The script manages long positions, calculates stop losses, and adjusts long positions according to the defined rules.
Trailing Stop Mechanism
The script incorporates a dynamic trailing stop mechanism designed to protect and maximize profits for long positions. Here's how it works:
1. Initialization:
The script allows you to choose between two types of initial stop loss:
---Percentage-based: This option sets the initial stop loss as a percentage of the entry price.
---Previous day's low: This option sets the initial stop loss at the previous day's low.
2. Setting the Initial Stop Loss (`sl_long0`):
The initial stop loss (`sl_long0`) is calculated based on the chosen method:
---If "Percentage" is selected, it calculates the stop loss as a percentage of the entry price.
---If "Previous Low" is selected, it sets the stop loss at the previous day's low.
3. Dynamic Trailing Stop (`trail_long`):
The script then monitors price movements and uses a dynamic trailing stop mechanism (`trail_long`) to adjust the stop loss level for long positions.
If the current high price rises above certain pivot point levels, the trailing stop is adjusted upwards to lock in profits.
The trailing stop levels are calculated based on pivot points (`r1`, `r2`, `r3`, etc.) and half-pivot points (`r0.5`, `r1.5`, `r2.5`, etc.).
The script checks if the high price surpasses these levels and, if so, updates the trailing stop accordingly.
This dynamic trailing stop allows traders to secure profits while giving the position room to potentially capture additional gains.
4. Final Stop Loss (`sl_long`):
The script calculates the final stop loss level (`sl_long`) based on the following logic:
---If no position is open (`pos == 0`), the stop loss is set to zero, indicating there is no active stop loss.
---If a position is open (`pos == 1`), the script calculates the maximum of the initial stop loss (`sl_long0`) and the dynamic trailing stop (`trail_long`).
---This ensures that the stop loss is always set to the more conservative of the two values to protect profits.
5. Plotting the Stop Loss:
The script plots the stop loss level on the chart using the `plot` function.
It will only display the stop loss level if there is an open position (`pos == 1`) and it's not a new trading day (`not newday`).
The stop loss level is shown in red on the chart.
By combining an initial stop loss with a dynamic trailing stop based on pivot points and half-pivot points, the script aims to provide a comprehensive risk management mechanism for long positions. This allows traders to lock in profits as the price moves in their favor while maintaining a safeguard against adverse price movements.
End of Day (EOD) Exit:
The script includes an "End of Day" (EOD) exit mechanism to automatically close any open positions at the end of the trading day. This feature is designed to manage and control positions when the trading day comes to a close. Here's how it works:
1. Initialization:
At the beginning of each trading day, the script identifies a new trading day using the `is_newbar('D')` condition.
When a new trading day begins, the `newday` variable becomes `true`, indicating the start of a new trading session.
2. Plotting the "End of Day" Signal:
The script includes a plot on the chart to visually represent the "End of Day" signal. This is done using the `plot` function.
The plot is labeled "DayEnd" and is displayed as a comment on the chart. It signifies the EOD point.
3. EOD Exit Condition:
When the script detects that a new trading day has started (`newday == true`), it triggers the EOD exit condition.
At this point, the script proceeds to close all open positions that may have been active during the trading day.
4. Closing Open Positions:
The `strategy.close_all` function is used to close all open positions when the EOD exit condition is met.
This function ensures that any remaining long positions are exited, regardless of their current profit or loss.
The function also includes an `alert_message`, which can be customized to send an alert or notification when positions are closed at EOD.
Purpose of EOD Exit
The "End of Day" exit mechanism serves several essential purposes in the trading strategy:
Risk Management: It helps manage risk by ensuring that positions are not left open overnight when markets can experience increased volatility.
Capital Preservation: Closing positions at EOD can help preserve trading capital by avoiding potential adverse overnight price movements.
Rule-Based Exit: The EOD exit is rule-based and automatic, ensuring that it is consistently applied without emotions or manual intervention.
Scalability: It allows the strategy to be applied to various markets and timeframes where EOD exits may be appropriate.
By incorporating an EOD exit mechanism, the script provides a comprehensive approach to managing positions, taking profits, and minimizing risk as each trading day concludes. This can be especially important in volatile markets like cryptocurrencies, where overnight price swings can be significant.
Backtesting: The script includes a backtesting feature that allows you to test the strategy's performance over historical data. Set the start and end times for backtesting to see how the long-only strategy would have performed in the past.
Trade Execution: If you choose to use this script for live trading, make sure you understand the risks involved. It's essential to set up proper risk management, including position sizing and stop loss orders.
Monitoring: Monitor the long-only strategy's performance over time and be prepared to make adjustments as market conditions change.
Disclaimer: Trading carries a risk of capital loss. This script is provided for educational purposes and as a starting point for your own long-only strategy development. Always do your own research and consider seeking advice from a qualified financial professional before making trading decisions.

Opening Range with Infinite Price TargetsOpening Range with Infinite Price Targets is an ORB indicator that automatically generates price targets into infinity based on a user-defined % of range.
This indicator includes many nice-to-have features missing from other indicators. Such as:
Price Target Labels with Price tooltip, want to know exactly what price pt3 is at? Hover over it and see.
Custom Defined Range time, Set your Range Start and end time to whatever you need, Doesn't have to be pinned to opening range!. Note: Time is in chart time.
Historical View (Default off), Tired of your chart looking messy with a ton of lines from historical data? No problem! You can choose to view or not view historical data.
Alerts for Range Breaks, First Range Breaks, and Discovery Price Target hits. As well as Exported Values for Range High, Low, and Mean to set your own alerts from custom sources.
Custom Price Targets, set your price targets to a % of the range based on your own strategy.
Last but not Least, Infinitely Generating Price Targets. They just keep building. New Targets will be generated when the price closes above/below the current farthest target.
Enjoy!

Trend SuggestionsThis brings together a number of variables to produce trend predictions that could be utilized as decision-making tools.
Uses the aforementioned price and volume derivatives
- A moving average and three weighted moving averages (WMA1, WMA2, WMA3)
- Super Trend Line (ST)
- Opening Range Breakout on Five Minutes, Resistance Bands Pocket pivots, support, and price volume
he Direction is determined by the High and Low Bands of WMAs and the Supertrend Line, which are used to determine the Upper and Lower Lines around the Price. When the price passes below the lower boundary of the band, a downtrend is said to have begun.
Similarly, for an uptrend, this continues until the price passes over the upper edge of the band. Teal for an uptrend and fuchsia for a downturn area shared by the band to identify the trend.
The first five minutes of the breakout lines have a tiny buffer augmentation of 11% applied to them.
Based on what has been observed, support and resistance zones have been somewhat changed from the figures that are often utilized (might work other markets as well)
The markings that may be seen are as follows:
- Blue Triangle indicates a pocket pivot with an upward bias;
- Maroon Triangle indicates a pocket pivot with a downward bias;
- Teal colored Diamonds indicate price upthrusts and potential trend confirmation locations, depending on success or failure.
- Similar backdrop color changes that look as vertical shading are also used to identify them.
- Fuchsia-colored diamonds indicate price declines and a potential trend, depending on whether it persists or fails.
- Dark green and maroon square boxes indicate potential price reversals in the support and resistance bands, respectively.
It goes without saying that this work is derived from numerous other open-source community initiatives.
Feel free to adjust anything you'd like, and we appreciate any feedback.

Opening Range Breakout with Price TargetsJust publishing a version of the script amitgandhinz already created, which is amazing.
Added fib levels that amitgandhinz already started but commented out
Added mid point that is often found effective as a starting point, SL, etc
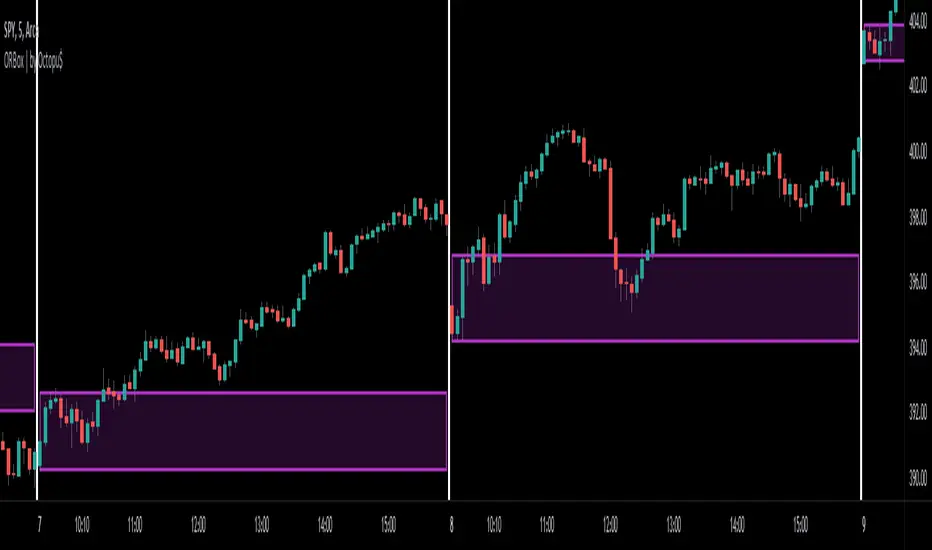
ORBox | by Octopu$📈 ORBox | by Octopu$
ORBox is a Box for the Opening Range Breakout
The Box is added automatically according to the User preferences through GUI
This Indicator includes a Dropdown selection for which Range for the Breakout you want to use
ORBox has built-in Alerts for when the Breakout happens according to your preferences
Works in any Timeframe with any Ticker
(Using SPY 5m just as an example:)
www.tradingview.com
SPY
Features:
• Opening Breakout Range (ORB)
• Dropdown menu selection to choose which TF to watch
• Built-in Alerts for Momentum Awareness
Options:
• Customization for Box Colors and Sizes
• Display ORB for Current Day or Previous
Notes:
v1.0
ORBox Indicator release
Changes and updates can come in the future for additional functionalities or per requests.
Did you like it? Shoot me a message! I'd appreciate if you dropped by to say thanks.
- Octopu$
🐙
Three Legged Goose FuturesThree-Legged Goose is an all-in-one intraday trading system.
Three-Legged Goose Futures is the same system as our "Three-Legged Goose" indicator, simply optimized for futures trading by working across all futures market sessions.
Three-Legged Goose Futures ONLY works on futures charts, please use our original Three-Legged Goose for equities.
It features a sleek and customizable Opening range overlay with infinitely generating price targets, Average Daily Range Zones, Curated Anchored VWAPs, Total Volume and ATR analysis, as well as our state of the art Market Momentum Trend detection.
Three-Legged Goose also has important Daily levels, including the Previous Day's High and Low and the Current Days Open, three fully customizable Exponential Moving Averages, a customizable ema cloud, and a toggleable standard vwap .
Three-Legged Goose Futures also includes overnight highs and lows as well as previous New York Session highs and lows.
Using this indicator allows you to get rid of any unnecessary indicators that are taking up those valuable slots in TradingView.
AVWAP + ORBS:
The Opening Range Breakout system builds off of our recommended 15min opening range and does all of your price target calculations based on the width of the opening range. These targets are fully customizable within the settings,
to allow fine-tuning from ticker to ticker. We have programmed three Anchored vwaps at different time intervals to act as a dynamic trend-finding instrument. These, along with the opening range breakout system, can help you quickly spot the day's trend and dynamic support and resistance long before your standard moving averages have caught up with price intraday.
Average Daily Range Zones:
We believe these zones to be essential to trading, especially with our system. These zones tend to act as areas of major support and resistance as well as give an idea of the projected volatility of the underlying.
Market Momentum Trend Detection:
We paint our momentum analysis directly on your candles. By taking the overall Market Internals + the underlying's Price movement, we can determine areas where we feel comfortable adding risk on or taking risk off.
This will help those that struggle at identifying trends and valid reversals.
All of the default settings are our recommended settings.
Please check the Author Instructions Below for how to gain access to our indicators.
