Call Bear Spread indicatorCall bear spread indicator developed by Chobotaru Brothers.
You need to have basic knowledge in option trading to use this indicator!
This spread is a CREDIT SPREAD.
The indicator shows P&L lines of the options strategy. Use only for stocks since the mathematical model of options for Future instruments is different from stocks. Plus, the days' representation in futures is also different from stocks (stocks have fewer days than futures ).
***Each strategy in options is based on different mathematical equations, use this indicator only for the strategy in the headline.***
What does the indicator do?
The indicator is based on the Black-Scholes model, which uses partial differential equations to determine the option pricing. Due to options non-linear behavior, it is hard to visualize the option price. The indicator calculates the solutions of the Black-Scholes equation and plots them on the chart so traders can view how the option pricing will behave.
How the indicator does it?
The indicator uses five values (four dominants and one less dominant) to solve the Black-Scholes equation. The values are stock price, the strike price of the option, time to expiration, risk-free interest rate, and implied volatility .
How the indicator help the users?
-View the risks and rewards so you can know the profit targets in advance which means you can compare different options in different strikes.
-View the volatility change impact so you can know the risk and the P&L changes in case of a change in the volatility over the life of the option before you enter the trade.
-View the passage of time impact so you can know where and when you could realize a profit.
-Multi-timeframes so you can stay on the same chart (Daily and below).
All these features are to help the user improve his analysis while trading options.
How to use it?
The user needs to obtain from the “option chain” the following inputs:
- Call spread price (Credit): The credit received for one unit of options strategy.
-Instrument price when entered spread: the stock price when you enter the options strategy.
-Upper strike price: the upper strike price of the options strategy.
-Lower strike price: the lower strike price of the options strategy.
-Interest rate: find the risk-free interest rate from the U.S. DEPARTMENT OF THE TREASURY. Example: for 2% interest rate, input: 0.02.
-Days to expire: how many days until the option expires.
-Volatility: the implied volatility of the option bought/sold. Example: for 45% implied volatility , input: 0.45.
-Day of entry: A calendar day of the month that the option bought/sold.
-Month of entry: Calendar month the option bought/sold.
-Year of entry: Calendar year the option bought/sold.
-% of Max Profit/Loss: Profit/loss line defined by the user. Minimum input (-0.95) ; maximum input (0.95).
Example: In this spread, -0.95 means, 95% of the options strategy maximum loss is reached and, 0.95 means, 95% of the options strategy maximum profit is reached.
After entering all the inputs, press Ok and you should see “Calculation Complete” on the chart.
The user should not change the entry date and days to expire inputs as time passes after he entered the trade.
How to access the indicator?
Use the link below to obtain access to the indicator
Options-strategy

Call bull spread indicatorCall bull spread indicator developed by Chobotaru Brothers.
You need to have basic knowledge in option trading to use this indicator!
This spread is a DEBIT SPREAD.
The indicator shows P&L lines of the options strategy. Use only for stocks since the mathematical model of options for Future instruments is different from stocks. Plus, the days' representation in futures is also different from stocks (stocks have fewer days than futures ).
***Each strategy in options is based on different mathematical equations, use this indicator only for the strategy in the headline.***
What does the indicator do?
The indicator is based on the Black-Scholes model, which uses partial differential equations to determine the option pricing. Due to options non-linear behavior, it is hard to visualize the option price. The indicator calculates the solutions of the Black-Scholes equation and plots them on the chart so traders can view how the option pricing will behave.
How the indicator does it?
The indicator uses five values (four dominants and one less dominant) to solve the Black-Scholes equation. The values are stock price, the strike price of the option, time to expiration, risk-free interest rate, and implied volatility .
How the indicator help the users?
-View the risks and rewards so you can know the profit targets in advance which means you can compare different options in different strikes.
-View the volatility change impact so you can know the risk and the P&L changes in case of a change in the volatility over the life of the option before you enter the trade.
-View the passage of time impact so you can know where and when you could realize a profit.
-Multi-timeframes so you can stay on the same chart (Daily and below).
All these features are to help the user improve his analysis while trading options.
How to use it?
The user needs to obtain from the “option chain” the following inputs:
- Call spread price (Debit): The debit paid for one unit of options strategy.
-Instrument price when entered spread: the stock price when you enter the options strategy.
-Upper strike price: the upper strike price of the options strategy.
-Lower strike price: the lower strike price of the options strategy.
-Interest rate: find the risk-free interest rate from the U.S. DEPARTMENT OF THE TREASURY. Example: for 2% interest rate, input: 0.02.
-Days to expire: how many days until the option expires.
-Volatility: the implied volatility of the option bought/sold. Example: for 45% implied volatility , input: 0.45.
-Day of entry: A calendar day of the month that the option bought/sold.
-Month of entry: Calendar month the option bought/sold.
-Year of entry: Calendar year the option bought/sold.
-% of Max Profit/Loss: Profit/loss line defined by the user. Minimum input (-0.95) ; maximum input (0.95).
Example: In this spread, -0.95 means, 95% of the options strategy maximum loss is reached and, 0.95 means, 95% of the options strategy maximum profit is reached.
After entering all the inputs, press Ok and you should see “Calculation Complete” on the chart.
The user should not change the entry date and days to expire inputs as time passes after he entered the trade.
How to access the indicator?
Use the link below to obtain access to the indicator

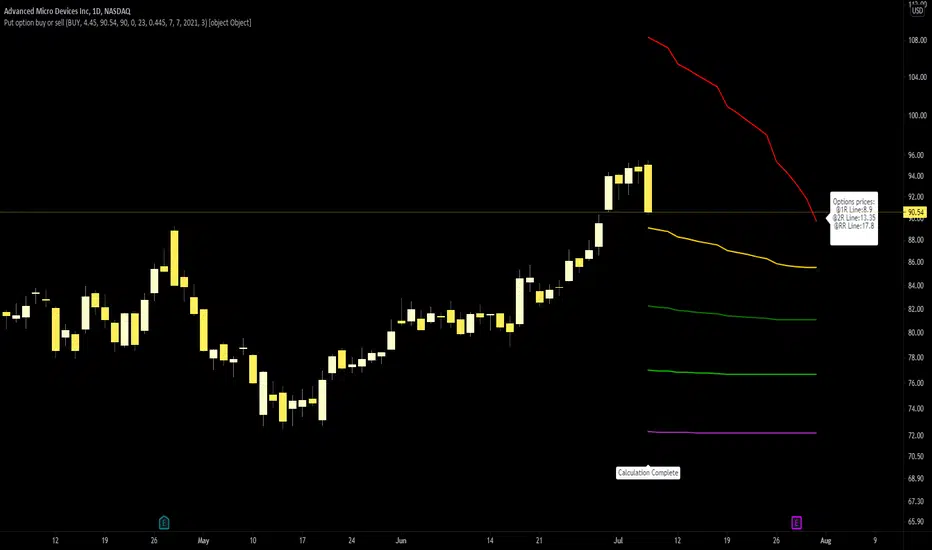
Put option buy or sell indicatorPut option indicator developed by Chobotaru Brothers.
You need to have basic knowledge in option trading to use this indicator!
The indicator shows P&L lines of the options strategy. Use only for stocks since the mathematical model of options for Future instruments is different from stocks. Plus, the days' representation in futures is also different from stocks (stocks have fewer days than futures ).
***Each strategy in options is based on different mathematical equations, use this indicator only for the strategy in the headline.***
What does the indicator do?
The indicator is based on the Black-Scholes model, which uses partial differential equations to determine the option pricing. Due to options non-linear behavior, it is hard to visualize the option price. The indicator calculates the solutions of the Black-Scholes equation and plots them on the chart so traders can view how the option pricing will behave.
How the indicator does it?
The indicator uses five values (four dominants and one less dominant) to solve the Black-Scholes equation. The values are stock price, the strike price of the option, time to expiration, risk-free interest rate, and implied volatility .
How the indicator help the users?
-View the risks and rewards so you can know the profit targets in advance which means you can compare different options in different strikes.
-View the volatility change impact so you can know the risk and the P&L changes in case of a change in the volatility over the life of the option before you enter the trade.
-View the passage of time impact so you can know where and when you could realize a profit.
-Multi-timeframes so you can stay on the same chart (Daily and below).
All these features are to help the user improve his analysis while trading options.
How to use it?
The user needs to obtain from the “option chain” the following inputs:
-Buy or sell (the strategy)
-The option price bought: at what price did you bought/sold one option.
-Instrument price when bought: the stock price when you bought/sold the option.
-Strike price: the strike price of the option.
-Interest rate: find the risk-free interest rate from the U.S. DEPARTMENT OF THE TREASURY. Example: for 2% interest rate, input: 0.02.
-Days to expire: how many days until the option expires.
-Volatility: the implied volatility of the option bought/sold. Example: for 45% implied volatility , input: 0.45.
-Day of entry: A calendar day of the month that the option bought/sold.
-Month of entry: Calendar month the option bought/sold.
-Year of entry: Calendar year the option bought/sold.
-Risk to reward: Profit/loss line defined by the user. Minimum input (-0.95) ; maximum input (3).
Example: If an option was bought, -0.95 means, 95% of the option value is lost (unrealized). If an option was bought, 3 means, the risk to reward is 3.
After entering all the inputs, press Ok and you should see “Calculation Complete” on the chart.
The user should not change the entry date and days to expire inputs as time passes after he entered the trade.
How to access the indicator?
Use the link below to obtain access to the indicator
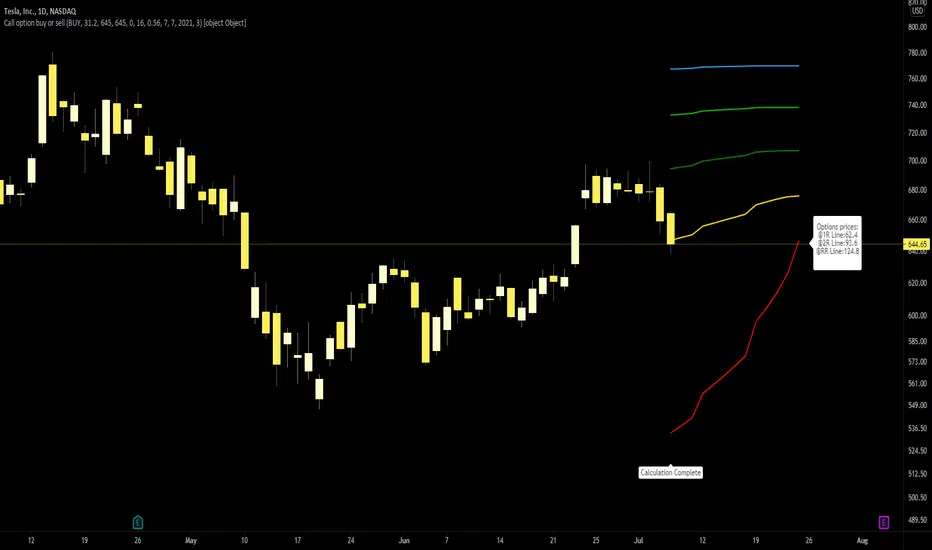
Call option buy or sell indicatorCall option indicator developed by Chobotaru Brothers.
You need to have basic knowledge in option trading to use this indicator!
The indicator shows P&L lines of the options strategy. Use only for stocks since the mathematical model of options for Future instruments is different from stocks. Plus, the days' representation in futures is also different from stocks (stocks have fewer days than futures ).
***Each strategy in options is based on different mathematical equations, use this indicator only for the strategy in the headline.***
What does the indicator do?
The indicator is based on the Black-Scholes model, which uses partial differential equations to determine the option pricing. Due to options non-linear behavior, it is hard to visualize the option price. The indicator calculates the solutions of the Black-Scholes equation and plots them on the chart so traders can view how the option pricing will behave.
How the indicator does it?
The indicator uses five values (four dominants and one less dominant) to solve the Black-Scholes equation. The values are stock price, the strike price of the option, time to expiration, risk-free interest rate, and implied volatility .
How the indicator help the users?
-View the risks and rewards so you can know the profit targets in advance which means you can compare different options in different strikes.
-View the volatility change impact so you can know the risk and the P&L changes in case of a change in the volatility over the life of the option before you enter the trade.
-View the passage of time impact so you can know where and when you could realize a profit.
-Multi-timeframes so you can stay on the same chart (Daily and below).
All these features are to help the user improve his analysis while trading options.
How to use it?
The user needs to obtain from the “option chain” the following inputs:
-Buy or sell (the strategy)
-The option price bought: at what price did you bought/sold one option.
-Instrument price when bought: the stock price when you bought/sold the option.
-Strike price: the strike price of the option.
-Interest rate: find the risk-free interest rate from the U.S. DEPARTMENT OF THE TREASURY. Example: for 2% interest rate, input: 0.02.
-Days to expire: how many days until the option expires.
-Volatility: the implied volatility of the option bought/sold. Example: for 45% implied volatility , input: 0.45.
-Day of entry: A calendar day of the month that the option bought/sold.
-Month of entry: Calendar month the option bought/sold.
-Year of entry: Calendar year the option bought/sold.
-Risk to reward: Profit/loss line defined by the user. Minimum input (-0.95) ; maximum input (3).
Example: If an option was bought, -0.95 means, 95% of the option value is lost (unrealized). If an option was bought, 3 means, the risk to reward is 3.
After entering all the inputs, press Ok and you should see “Calculation Complete” on the chart.
The user should not change the entry date and days to expire inputs as time passes after he entered the trade.
How to access the indicator?
Use the link below to obtain access to the indicator
Geometric Brownian Motion BandIf you are an option trader, who are constantly searching opportunities to set up inverse iron condor position or other strategies, you must be familiar in estimating the range induced by Geometric Brownian Motion (GBM), or Lognormal distribution someone may call.
The theory behind is adopted in the Black Scholes Option Pricing model, this assumes the asset price follows the GBM, shown below, and estimates the range where the price will fall into on the specific date and probability.
dS = a dt + v dW
Assuming the drift term is zero, this GBM Band applies the same model and helps you to quickly assess the suitable range to set up your option strategies with simple setting:
Length – number of bars covered
Vol Multiple - the z-score of the probability
Default values of the Length and Vol Multiple are set to 20 bars and 2.0 z-score respectively.
You can find an example how the GMB Band work.
You can also applies this GMB Band like how Bollinger's Band does for swing trade or breakaway trade.
If you find this indicator is useful to you, Star it, Follow, Donate, Like and Share.
Your support is a highly motivation for me.

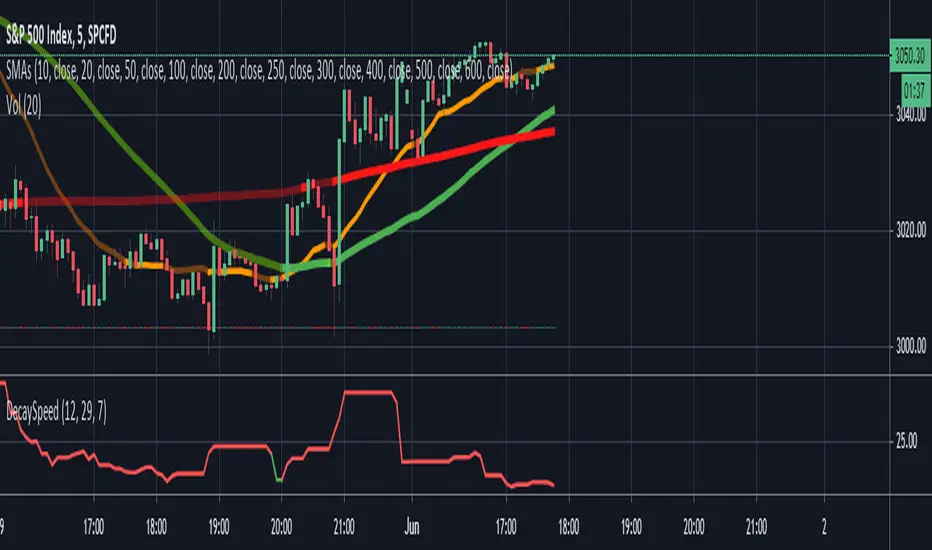
Options Decay Speed for 0DTEUse only for:
SPX, 5 minutes time frame
This indicator is complementing options 0DTE strategy - selling options for SPX index in the same day as they are expiring. Output of the indicator (red or green color of the curve) indicates whether is profitable to sell options at given moment at delta and VIX specified in the parameters. Changing parameter "Candles" is not recommended.
Main thought is that options expire with certain speed (theta decay) when stock doesnt move. When stock moves in unfavorable direction slowly enough, decay speed can compensate for disadvantage coming from option delta. Intuitively there must be certain speed of stock value change (expressed in stock value per 5 minutes) that is exactly compensating theta decay. This indicator calculates those two values (details below) and shows, where theta decay is faster than stock movement in the last hour and thus favorable to sell options.
Indicator gets its result from comparing two values:
1) volatility in the form of highest high and lowest low for past 12 candles (one hour in total) divided by 12 - meaning average movement of stock expressed in
2) speed of options value decay in form of combination of theta decay and option delta. Formulas are approximation of Black-Scholes model as Pine script doesnt allow for advanced functions. Approximations are accurate to 2 decimal points from market open to one hour before market close and will not indicate green when accuracy is not sufficient. Its value is also expressed in so its mutualy comparable.
My focus was not on code elegance but on practical usability.
Written by Ondřej Škop.
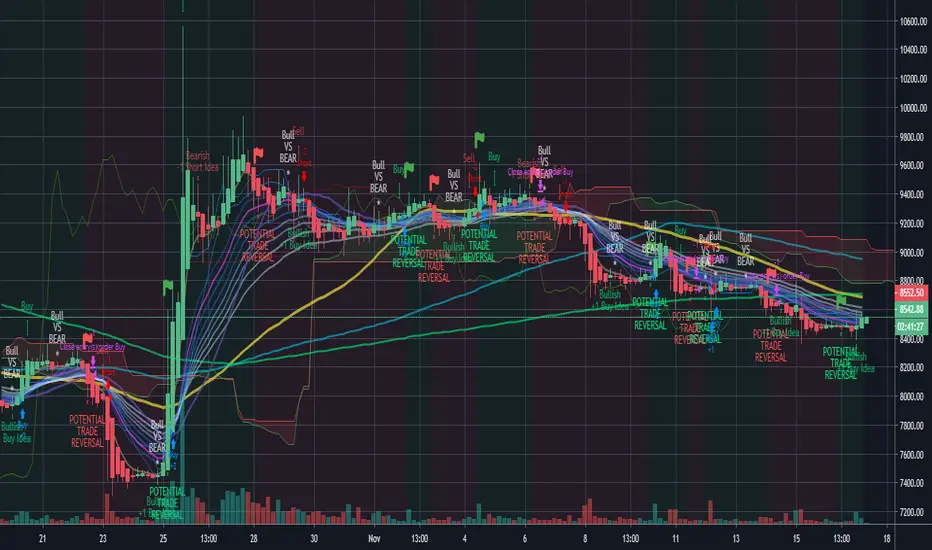
NINJA SCALPERNinja Scalper is the next evolution of the Trade Trend Indicator.
I have been trading for over 23 years now and these indicators are based on my trading style risk verse reward. The change in this is to make it more responsive and to integrate with Sword.
The background of this indicator is:
The original Trade Trend Indicator (indicator) has been the brain child of 23 years of trading experience rolled into a simple to understand all market setup alert system based solely on 5 high probability trade set ups with a 6th high risk. The hope is to provide something that is can assist traders in building confidence in their trades with a little assistance from the indicator.
This like any and all indicators is not a be all and end to trading, yes while back tested the indicator has produced fantastic profitable results; past performance is not a guarantee of future but which with human intervention can increase the return result exponentially.
You need to be able to chart simple candle sticks and you need to have an understanding of support and resistance areas to make sense of what you are doing in trading otherwise even this indicator won't help you.
While this may alert buy or sell / long or short entrance these are to be taken as educational points of reference and if you wish to trade you are understanding that you enter and exit at your own risk. Not many indicators will alert you to the possibility of a rogue wave spike / dump or both, this will but everything is perspective of the time frame you are on.
The indicator is designed for the 4hour time frame with trade entry on the 15min and managed on the 30min time frame. Alot can happen within these time frame but as we know not every trader can sit in front of a screen for hours at a time and this let's one trade for swings. Once you have your entry you place your exits and you set your stops. If you wait for the alert to exit you are in a draw down this should never reach that point pay yourself for being right.
The some set ups are simple:
1. Trend change from bearish to bullish buys are dip interim support entries.
2. Trend change from bullish to bearish sells are top interim resistance exits.
3. Blue buy is an entry position for a trade.
4. Blue long is an add position for a trade.
5. Red short is just that a short trade idea. (this is advanced and requires a manual cover target),
6. Green buy is a break out over the next candle to print above (highest risk)
All trades are based on a 5% to 10% of capital entry with no more than 40% ever in 1 trade goal is many consistent trade wins while limiting the losses and size.
Certain set ups such as longs over the Moving Averages but below the cloud can lead to strong rally returns as well as short in a bearish trend just above the Moving Averages can give prolonged selling pressure.
Pay attention to the golden dump line as it rises the closer to the candle it gets the higher the risk of the trade lacking continuation.
None of this is to be taken as investment advice but rather Edutainment and infotainment
#TradeSocially

Arrows Perfect BinaryThis is a binary options script for detecting the best flaws in the market and taking advantage.
Initially, the script was coded with Martingale in mind and no losses occur in 3-5 cycles but a revision was made and this is the current version 1.0 of the script. Use this script wisely, It's a powerful one and might be the Holy Grail or Account Blower.
If you think of something please lemme know so that I can improve the value of this script to the community.
I am open to wise contributions.
Enjoy, lucemanb

(JS) S&P 500 Volatility Oscillator For OptionsThe idea for this started here: www.tradingview.com with the user @dime
This should only be used on SPX or SPY (though you could use it on other things for correlation I suppose) given that the instrument used to create this calculation is derived from the S&P 500 (thank you VIX). There's a lot of moving parts here though, so allow me to explain...
First: The main signal is when Implied Volatility (from VIX) drops beneath Historical Volatility - which is what you want to see so you aren't purchasing a ton of premium on long options. Green and above 0 means that IV% has dropped lower than Historical Volatility. (this signal, for example, would suggest using a Long Call or Put depending on your sentiment)
Second: The green line running underneath zero is the bottom portion of the "Average True Range" derived from the values used to create the oscillator. the closer the bottom histogram is to the green line, the more "normal" IV% is. Obviously, if this gets far away from the line then it could be setting up nicely to short options and sell the IV premium to someone else. (this signal, for example, would suggest using something like a Bull Put Spread)
Third: The red background along with the white line that drops down below zero signals when (and how far) the IV% from 3 months out (from VIX3M) is less than the current IV%. This would signal the current environment has IV way too high, a signal to short options once again (and don't take any long option positions!).
Tried to make this simple, yet effective. If you trade options on SPX, SPY, even ES1! futures - this is a tool tailored specifically for you! As I said before, if you want you can use it for correlation on other securities. Any other ideas or suggestions surrounding this, please let me know! Enjoy!

MACD TBBThis indicator works similar to the Tightened Bollinger Band (TBB) Strategy. Normally, when bollinger bands tighten, you look for the point where they widen and the direction of the price is often a breakout.
This indicator does the something similar, but using MACD, so you get other opportunities to get into plays. When the bollinger bands on the indicator tighten, wait for them to widen. The MACD line will turn red. The exit to the play is when the macd pulls away from the band and turns black again.
This indicator was built to help with some instructional material presented at www.optionsplayers.com
Let me know if you like the indicator or have any suggestions!

Binary option trading by two previous barsThis simple script uses the idea of inertia of the market. if 2 previous candles have the same color, current meant to have that too. Following this signal is equal to buying a binary option on the start of the bar (week here). Signals are shown as arrows on the series. The color of the bar shows the outcome of the current option: yellow is success, black is failure. The same outcomes are at the bottom of the chart. The blue line is the total revenue of all options so far. Can be used as template for strategy simulation.
