Momentum Echo Oscillator [Community Edition]Concept: The Momentum Echo Oscillator (MEO) is a modern take on classical momentum oscillators. Most indicators only look at the "now". MEO introduces the concept of Momentum Echoes—historical momentum harmonics that are weighted and blended back into the current price velocity.
Why use MEO? Standard momentum tools (like ROC or RSI) can be very "jittery" or noisy. By integrating historical echoes, MEO provides a smoother, more rhythmic representation of price flow, making it easier to spot genuine trend reversals.
Key Elements:
Primary Momentum: The immediate speed of price.
Echo Harmonics: Two adjustable lookback points that act as a "memory" for the indicator, filtering out false breakouts.
Dynamic Histogram: Visualizes the gap between the Echo Engine and the Trigger Line, highlighting acceleration and deceleration.
Settings:
Echo Weight: Adjust how much "memory" you want the indicator to have.
Smoothing: Clean up the signals for higher timeframes.
This is an open-source tool for the TradingView community. Enjoy!
震盪指標

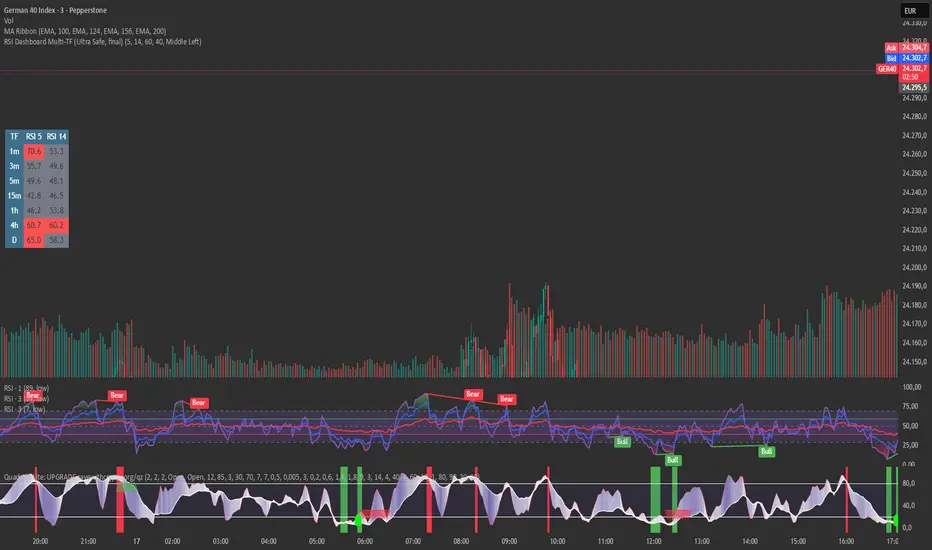
RSI Dashboard Multi-TF This script displays RSI values from multiple timeframes in a compact dashboard directly on the chart.
It is designed for traders who want to quickly identify whether the market is overbought, oversold, or neutral across different timeframes, without constantly switching chart intervals.
The dashboard shows the RSI simultaneously for the following timeframes:
- 1 minute
- 3 minutes
- 5 minutes
- 15 minutes
- 1 hour
- 4 hours
- Daily
Typical use cases:
- Scalping & intraday trading
- Multi-timeframe analysis at a glance
- Entry confirmation (e.g. pullbacks, breakouts)
- Avoiding trades against overbought or oversold market conditions
- Complementing EMA, VWAP, or price action strategies
⚙️ Notes
This dashboard is an analysis tool, not an automated trading system.
No repainting (uses request.security).
Suitable for indices, forex, crypto, and commodities.
This RSI dashboard provides a fast, clear, and visually clean market overview across multiple timeframes, making it an ideal tool for active traders who want to make efficient and well-structured trading decisions.
RSI Divergence + MTF Table FinalThis is a professional, high-impact English description for your RSI Divergence + MTF Table Final script, designed to attract users on TradingView by highlighting its institutional-grade features.
Institutional RSI Divergence & MTF Confluence Heatmap
Overview
The Institutional RSI Divergence & MTF Confluence Heatmap is a professional-grade analytical tool designed for high-precision traders. It combines Automated RSI Divergence Detection with a Multi-Timeframe (MTF) Heatmap Table, allowing you to monitor market momentum across 8 different timeframes (from 1-minute to 1-day) without ever switching charts.
Key Features
🔍 Automated Divergence Detection: Instantly identifies Regular Bullish and Bearish divergences on the RSI oscillator, marking them with clear "Bull" and "Bear" labels.
📊 MTF Heatmap Grid: A real-time monitoring table that tracks RSI values across: 1m, 5m, 15m, 30m, 1h, 4h, 12h, and 1D.
🎨 Dynamic "Institutional" Color Logic: The table uses a sophisticated color-coded system to highlight extreme exhaustion and momentum:
Ultra Overbought (RSI > 90): Bright Red (Extreme Reversal Zone).
Overbought (RSI > 80): Orange (High Momentum/Caution).
Oversold (RSI < 26): Lime Green (Potential Accumulation).
Neutral: Gray (Consolidation).
🛠️ Flexible Layout Engine: Toggle between Vertical or Horizontal layouts to fit your chart workspace perfectly.
🚀 Pine Script v6 Optimized: Built with the latest TradingView engine for ultra-fast performance and minimal lag.
Trading Strategy: The Power of Confluence
Cross-Timeframe Confirmation: The strongest reversals occur when multiple timeframes (e.g., 15m, 1h, and 4h) all turn Orange/Red or Lime simultaneously. This represents a massive momentum exhaustion.
Divergence Validation: Use the table to see if a detected "Bull" divergence on your current timeframe is backed by "Oversold" conditions on higher timeframes.
Institutional Sniping: Combined with Demand/Supply zones, this script helps you "snipe" entries at the exact moment market momentum peaks or bottoms out.
Settings & Customization
Toggle Compact Mode: Display a minimal version of the table for a cleaner interface.
Custom Thresholds: Modify RSI levels to suit your specific trading style (Scalping vs. Swing Trading).
Table Position: Move the heatmap to any corner of your screen (Top Right, Bottom Left, etc.).

MACD-v Bullish/Bearish DivergenceMACD-v Bullish/Bearish Divergence
Overview This indicator is a specialized divergence detector based on the MACD-v (Volatility Normalized Momentum) concept. Unlike standard MACD which uses absolute price differences, MACD-v normalizes values against volatility (ATR), allowing for fixed, universal Overbought/Oversold thresholds across all assets and timeframes.
Recommendation: This script is highly effective when paired with the original MACD-v by Alex Spiroglou. While this indicator focuses on identifying and visualizing divergence entries, using the original oscillator alongside it provides the best visual context for the overall momentum structure.
How It Works
This tool uses a dual-signal mechanism (Raw Line + Signal Smooth) to identify specific divergence setups:
Setup (Yellow/Blue Dots): Identifies when price momentum has extended significantly into extreme zones (Overbought/Oversold).
Trigger (Red/Green Dots): Fires when price fails to make a new momentum extreme despite price action (classic divergence/failure swing).
Active State (Background Color): Once a trigger fires, the background highlights (Red for Bearish, Green for Bullish) to indicate an active divergence play.
Reset (Exit): The signal state clears when momentum returns to the neutral "safe zone."
Important Note: Momentum Washout
The colored background persists as long as the divergence trade remains valid. Traders should note the concept of "Momentum Washout":
Signal End: The background color turns off when the MACD returns to the neutral range, indicating the primary high-velocity impulse is over.
Performance Continuation: Significant positive or negative price performance can often continue even after the background signal ends. This period allows the remaining momentum to "wash out" or drift before the next major impulse.
Strategy Tip: The indicator is designed to capture the high-volatility portion of the reversal. Do not assume the end of the signal is the absolute top or bottom of the trend; it simply marks the normalization of momentum.
Strategy Recommendation: Multi-Timeframe Analysis
Divergence signals are most powerful when confirmed across timeframes. It is highly recommended to look for alignment before taking a trade:
Trend Confirmation: If you see a signal on a lower timeframe (e.g., 5m or 15m), check a higher timeframe (e.g., 1H or 4H). A bullish divergence on the 5m is significantly more reliable if the 1H momentum is already bullish or oversold.
Signal Stacking: Valid signals often appear sequentially—first on the 1m, then the 5m, and finally the 15m. Waiting for this "cascade" can filter out false reversals.
Visual Guide
🔵 Blue Dot: Bullish Divergence Setup (Watch for entry).
🟢 Green Dot: Bullish Divergence Trigger (Long Entry).
🟡 Yellow Dot: Bearish Divergence Setup (Watch for entry).
🔴 Red Dot: Bearish Divergence Trigger (Short Entry).
Background Color: Indicates an active trade (Red = Bearish / Green = Bullish).
Settings
Auto-Detect: Automatically switches between Scalping settings (tighter thresholds) for low timeframes and Swing settings for high timeframes.
Strict Invalidation: If enabled, cancels a setup if momentum pushes too far in the opposite direction before triggering.
Active Signal Multiplier: Dynamically smooths the signal line only when a trade is active to prevent premature exits during choppy corrections.
Disclaimer: This tool is for educational purposes and trend analysis only. Always manage your risk appropriately.

Crypto Flow Index (CFI) - RS vs BTC/ETH ---
Crypto Flow Index, CFI
Crypto Flow Index, CFI, measures relative strength between an asset and Bitcoin or Ethereum.
You use CFI to judge whether capital favors your asset or the benchmark.
CFI does not give entry or exit signals.
You use CFI as a bias and context tool.
---
What CFI measures
Relative strength money flow on the BASE/BTC or BASE/ETH pair.
Volume weighted pressure, not price alone.
Momentum blended into flow to smooth rotations.
Optional USD trend filter using fast and slow EMAs.
---
How to read CFI
Above 50 means relative strength favors the asset.
Below 50 means relative strength favors BTC or ETH.
Rising CFI shows strengthening relative demand.
Falling CFI shows weakening relative demand.
---
Histogram
Green bars show positive relative flow.
Red bars show negative relative flow.
Larger bars signal stronger pressure.
---
Bias ribbon
Green ribbon shows bullish relative bias.
Red ribbon shows bearish relative bias.
Gray ribbon shows transition or balance.
---
How to use CFI
Favor long trades when CFI stays above 50.
Avoid longs when price rises but CFI falls.
Spot rotations before price reacts.
Combine with structure, entries, and risk rules.
---
Important limits
CFI compares assets only to BTC or ETH.
CFI does not represent the entire crypto market.
USD price and relative strength often diverge.
---
Core question CFI answers
Is your asset gaining or losing strength versus Bitcoin or Ethereum.
---

HaP D-RSIHaP D-RSI (HaP Dual RSI) This code shares the dual RSI structure and divergences of hakan çift rsi-most indicator as open source. It is designed for simple, understandable, and effective use.
()
HaP D-RSI is a comprehensive oscillator that powerfully enhances the classic Relative Strength Index (RSI) indicator. By adding a 9-period EMA on top of the standard RSI(14), it smooths the momentum for clearer readability, while dynamic area filling between the short RSI(10) and long RSI(14) visually emphasizes trend strength. Its strongest feature is the automatic detection of regular (normal) and hidden positive/negative divergences, marked with clear labels. This provides opportunities to catch both trend reversals and continuations early.The indicator operates in a separate panel and includes overbought/oversold levels (70/30/50). With multi-timeframe support, you can display RSI values from a higher timeframe on your current chart.Main FeaturesDual RSI Calculation: Short-period RSI(10) and long-period RSI(14) are calculated separately.
EMA Smoothing: A 9-period EMA is applied to RSI(14) to reduce noise and clarify signals.
Dynamic Area Filling: Dynamic colored filling between RSI(10) and RSI(14)-EMA (blue tones for bullish, red tones for bearish momentum).
Fixed-intensity area between RSI(10) and RSI(14) (emphasizes trend strength).
Overbought/Oversold Lines: Dashed lines at 70 (overbought), 30 (oversold), and 50 (midline).
Full Divergence Detection:Positive Divergence (pu): Price makes a lower low while RSI makes a higher low → Potential bullish reversal.
Hidden Positive Divergence (gpu): Trend continuation signal (buying opportunity after pullback).
Negative Divergence (nu): Price makes a higher high while RSI makes a lower high → Potential bearish reversal.
Hidden Negative Divergence (gnu): Bearish trend continuation signal.
Customizable Pivot Settings: Adjust divergence sensitivity with lookback left/right and distance range.
Multi-Timeframe Support: Ability to pull RSI data from a different timeframe.
Usage InstructionsAdd to Chart: When added, it opens a separate RSI panel.
Settings: Change the short RSI (default 10) and long RSI (default 14) periods as needed.
Adjust the EMA period (default 9) to suit your needs.
If the timeframe is left blank, it uses the current chart timeframe; otherwise, select a higher timeframe.
You can toggle divergence types (positive/negative, hidden/regular) on/off.
Increase pivot lookback values for stronger (fewer signals) divergences.
Signal InterpretationBuy Opportunity: When "pu" or "gpu" labels appear (especially around the 30 level).
Sell Opportunity: When "nu" or "gnu" labels appear (especially around the 70 level).
Area filling colors support momentum direction: Blue tones indicate bullish pressure, red tones indicate bearish pressure.
For best results, use in combination with support/resistance levels, volume, or trend filters (e.g., EMA).
Why Use This Indicator?Powerful Divergence Detection: Automatically and accurately captures both regular (reversal) and hidden (continuation) divergences – a feature missing in many standard RSI indicators.
Visual Clarity: Dynamic colored areas and labels ensure you don't miss signals.
Flexibility: Suitable for all markets (stocks, forex, crypto) and timeframes.
Early Warning System: Divergences often signal before price reversals, providing high-probability entries.
Add this indicator to your strategies to elevate your momentum-based trading.
This indicator is free. Feel free to leave comments with your feedback and improvement suggestions. If you like it, don't forget to add it to favorites and share! Happy trading!

CM RSI Description
This indicator plots ladder-style buy signals based on RSI oversold “cycles.”
BUY1 triggers after RSI closes ≤ Oversold for at least two consecutive candles.
Additional buys (BUY2, BUY3, …) can only occur after RSI re-arms by closing back above the oversold level, then returning oversold for two+ closes, and price is at least X% below the last entry price.
The “last entry” reference updates after every buy, allowing unlimited rebuys with a dynamic step-down.
Notes
Signals are generated on closed bars only (non-repainting behavior).
You can optionally set a Start Time to ignore earlier history and avoid off-screen state.
Choose whether the % drop check uses Close or Low depending on how strict you want confirmation.
Inputs
RSI length/source, oversold level, rebuy drop %, price check source, entry storage source, start time/baseline options, and display controls.


Market Participation Gradient [Interakktive]Market Participation Gradient (MPG) is a diagnostic oscillator that measures the quality and intensity of market participation by combining price efficiency with activity (volume or a FX-safe proxy) into a single 0–100 score.
Most tools tell you "how much activity exists." MPG focuses on "how effective that activity is," helping you differentiate clean directional participation from absorbed / inefficient participation where effort produces limited directional progress.
█ WHAT IT DOES
- Produces a 0–100 participation score (higher = stronger participation environment)
- Uses color as state context (not buy/sell)
- Classifies participation into four tiers for quick readability
- Includes an optional status-line HUD for at-a-glance context without chart clutter
█ WHAT IT DOES NOT DO
- NO buy/sell signals
- NO entries/exits
- NO alerts by default
- NO repainting / no lookahead (diagnostic context only)
█ HOW TO READ MPG
Level (0–100)
- Higher values = stronger participation environment
- Lower values = thin, drifting participation environment
Color (state language, not direction)
- Teal = Clean participation (efficient movement)
- Magenta = Absorbed participation (high activity, low efficiency)
- Amber = Building / transition state
- Grey = Thin / neutral state
█ TIER SYSTEM
MPG uses four tiers:
- THIN (0–20): low participation environment
- BUILDING (20–40): participation emerging / transitional
- STRONG (40–65): solid participation environment (quality becomes more meaningful)
- EXTREME (65+): very high participation environment (contextually important during events or late-cycle pushes)
█ QUALITY ASSESSMENT (STRONG / EXTREME)
Within STRONG and EXTREME tiers, MPG evaluates participation quality:
- Clean (Teal): Efficiency > 55%
- Absorbed (Magenta): Efficiency < 30% AND Activity > 1.5×
- Neutral (Grey): otherwise (mixed quality)
█ STATUS LINE HUD
MPG can display key values in TradingView's status line:
- Minimal: MPG (0–100) + Tier (0–3)
- Full: adds Direction (-1/0/1) and Quality (-1/0/1)
This provides quick context without tables or on-chart panels.
█ HOW IT WORKS (METHODOLOGY)
MPG combines two independent measurements:
1. Efficiency (0–1)
Efficiency = |Net Displacement| / Total Path Length
- High efficiency = price moved more directly
- Low efficiency = price moved less directly (more back-and-forth)
2. Activity (centered at 1.0)
Activity = Current Volume / Average Volume
- Activity > 1 = above-average activity
- Activity < 1 = below-average activity
FX / indices fallback: If volume is unreliable/unavailable, MPG uses a range-based proxy: (High–Low) / ATR (capped) to prevent distortion.
3. Participation Score (0–100)
Participation = Efficiency × √Activity × 100
The square root applies diminishing returns so activity alone cannot dominate without efficiency support.
█ SETTINGS
Core
- ATR Length — normalization baseline
- Efficiency Lookback — bars used for efficiency
- Volume Average Length — baseline for activity
- Smoothing Length — EMA smoothing (1 = minimal smoothing)
Visuals
- Histogram / Line / Tier Bands toggles
- Optional pane background tint (default OFF)
- Theme: Cinematic (subtle) or Vivid (brighter)
HUD
- Status Line HUD toggle
- HUD Detail: Minimal or Full
█ SUITABLE MARKETS
Works on any market with price data. For symbols with unreliable volume (common in FX), MPG automatically uses the range/ATR activity proxy.
█ RELATED (INTERAKKTIVE)
- MER — Market Efficiency Ratio (pure efficiency)
- ERD — Effort–Result Divergence (effort vs outcome)
- VSI — Volatility State Index (expansion/contraction context)
█ DISCLAIMER
This indicator is for educational and informational purposes only and does not constitute financial advice. Always do your own research and use appropriate risk management.

QQE MT4 [JOY]I have taken Glaz's code from and converted to V6 to ensure we have the latest version.
Smoothed RSI (yellow) via EMA with configurable period; serves as the main signal line.
ATR of the smoothed RSI is double‑smoothed with a Wilder lookback (RSI2−1) and scaled by the QQE multiplier to form dynamic bands.
Slow trailing stop (red) tracks the smoothed RSI; trend flips when smoothed RSI crosses the opposite band.
How to use it?
* Trend bias: red line below yellow = bullish bias; red above yellow = bearish bias.
* Crossovers: bullish when smoothed RSI crosses above the red trailing stop; bearish on the opposite cross.
* Works best on volatile pairs as in the original description; test and tune the multiplier and smoothing for your market/timeframe.
* Because it’s derived from an oscillator, signals are on RSI scale, not price; overlays will not show price-level stops.

EMA RSI Adaptive (v6) [Joy]I have taken Glaz's code and converted to V6. The main logic is not mine but taken from Glaz's code
The EMA RSI Adaptive indicator smooths price with an EMA whose speed adjusts to RSI’s distance from its midpoint (50). When RSI strays far from 50 (higher momentum/volatility), the effective EMA period shrinks so the line hugs price. When RSI stays near 50 (quieter conditions), the period lengthens to filter noise. The target of the EMA update is an SMA of price (matching the original design), so you get a smoothed, adaptive trend line rather than a raw EMA of closes.
Key mechanics (what’s happening under the hood):
RSI distance: |RSI - 50| + 1 measures how “charged” momentum is. Bigger distance → faster adaptation.
Dynamic period: a nonlinear mapping turns that RSI distance into an adjusted smoothing length.
Adaptive EMA: ema = emaPrev + alpha * (SMA - emaPrev), where alpha = 2 / (1 + dynamicPeriod).
Visuals: optional color shift—blue when the line is rising, magenta when falling.
Practical use:
Trend filter: rising line = bullish bias; falling line = bearish bias.
Pullback tool: in trends, price tags or minor pierces of the adaptive line can mark pullback zones.
Volatility-aware: it tightens in fast moves (tracks closer) and relaxes in chop (filters more).
On very low timeframes or illiquid symbols, expect more whipsaw; lengthen the base EMA or RSI period to calm it.
The color toggle is cosmetic; the adaptive line itself carries the signal.

RSI Divergence + MTF Table + Price Wicks Lines - V2This script combines a classic RSI divergence indicator with a multi–timeframe RSI dashboard.
Main features:
Detects and plots:
Regular bullish & bearish RSI divergence
Hidden bullish & hidden bearish RSI divergence
Dynamic RSI line color:
Green in strong bullish zone
Red in strong bearish zone
Yellow in neutral zone
Standard RSI levels:
70 / 30 overbought–oversold
50 midline with highlighted band
MTF RSI table:
Compact RSI dashboard on the right side of the chart
Timeframes: 1m, 5m, 15m, 30m, 1h, 4h, 8h, 12h, 1D (each can be turned on/off)
Background color highlights extreme RSI:
Red / orange for overbought
Lime for oversold
This tool is designed to help traders quickly see divergence signals on the current chart while also monitoring RSI conditions across multiple timeframes in one place.

RSI Divergence Indicator (Fixed RSI Color + MTF Table)This script combines a classic RSI divergence indicator with a multi–timeframe RSI dashboard.
Main features:
Detects and plots:
Regular bullish & bearish RSI divergence
Hidden bullish & hidden bearish RSI divergence
Dynamic RSI line color:
Green in strong bullish zone
Red in strong bearish zone
Yellow in neutral zone
Standard RSI levels:
70 / 30 overbought–oversold
50 midline with highlighted band
MTF RSI table:
Compact RSI dashboard on the right side of the chart
Timeframes: 1m, 5m, 15m, 30m, 1h, 4h, 8h, 12h, 1D (each can be turned on/off)
Background color highlights extreme RSI:
Red / orange for overbought
Lime for oversold
This tool is designed to help traders quickly see divergence signals on the current chart while also monitoring RSI conditions across multiple timeframes in one place.

Multiple Time Frame Stoch-RSIThis indicator is designed to show users the values for default stochastic RSI and default RSI settings across multiple time frames.
I have made many bad trades focusing too closely on one particular time frame and indicators that suggest the price will move one way, to be superseded by a higher timeframe pushing price in another direction.
The timeframes are customisable so you can select your own timeframes, but the default timeframes chosen here are part of the BareNaked Crypto or Naked Nation strategy, looking at timeframes in multiples of 3 for lower timeframes.
The idea in its simplest form is that when timeframes like the 3/6/9m are all over sold or over bought (coloured red or green) then it could be a suitable time to place an order. Or at least be more favourable for your trade.
This indicator as with all indicators is designed as a tool to add to whatever arsenal of strategy or tools you are already using and does not constitute financial advice, just be cause 3/6/9m is in red or green does not guarantee that the trade will go your way.
The orange on the timeframes are generally designed to show users where price can reverse so for example if the stochastic 3m is at 10 and in green, but the 9m is at 65 in orange, it could be that a push up is not finished and the 9m drop from oversold to 65 could be reversed due to a low 3m stochastic number and then 9m goes from 65 back up to 100, and vice versa.
The arrows for direction also allow you to quickly deduce the direction of the stochastic RSI, ^ up, V down, and stable -. this should allow you to see if the stochastic has been rising and is beginning to turn around or not.

Quant VWAP System 3.8 This is the lower-indicator companion to the "Quant VWAP System." While the main chart tells you where the price is, this oscillator tells you how statistically significant the move is.
It uses a Z-Score algorithm to normalize price action. This means it ignores dollar amounts and instead measures how many Standard Deviations (SD) the price is away from its mean (VWAP). This allows you to instantly spot "Overbought" or "Oversold" conditions on any asset (Bitcoin, Forex, or Stocks) without needing to guess.
Key Features:
1. Normalized Extremes (The "Kill Zones")
±2.0 SD: These dotted lines represent statistical extremes. When the signal line crosses above +2.0, the asset is mathematically expensive (Overbought). When it crosses below -2.0, it is mathematically cheap (Oversold).
The Logic: Price rarely sustains movement beyond 2 Standard Deviations without a reversion or a pause.
2. The Squeeze Radar (Yellow Dots)
Volatility Detection: A row of Yellow Dots appearing on the center line indicates a "Squeeze."
What it means: The Standard Deviation bands are compressing. Energy is building.
Warning: DO NOT trade Mean Reversion when you see Yellow Dots. A squeeze often leads to a violent breakout. Wait for the dots to disappear to confirm the direction of the explosion.
3. Momentum Coloring
Green Line: Z-Score is rising (Bullish Momentum).
Red Line: Z-Score is falling (Bearish Momentum).
This helps you spot divergences (e.g., Price makes a Higher High, but the Oscillator makes a Lower High = Exhaustion).
How to Trade with It
Strategy A: The "Zero Bounce" (Trend Continuation)
Scenario: You are in a Bull Trend.
Signal: The Oscillator line pulls back to the Zero Line (White), turns Green, and curls upward.
Meaning: Price has tested the average (VWAP) and buyers have stepped in. This is a high-probability entry for trend continuation.
Strategy B: The "Extreme Fade" (Reversion)
Scenario: The Oscillator pushes deep into the Red Zone (+2.0 SD).
Signal: The line turns Red and crosses back down below the +2.0 dotted line. A small Red Triangle will appear.
Meaning: The statistical extension has failed, and price is likely snapping back to the mean.
Strategy C: Squeeze Breakout
Scenario: Yellow Dots appear on the center line.
Action: Stop trading. Wait.
Signal: The dots disappear, and the line shoots aggressively through +1.0 SD (Long) or -1.0 SD (Short). Ride the momentum.

Gold Sniper V21 + ATR (SMART FILTER)This is the Indicator to combine my Gold Sniper V21 + ATR Filter
How to use the Indicator :
- Recommend to use in M30 Chart.
- Very simple just follow the BUY/SELL Signal once appear. This indicator I try to filter as much as I can for the fake signal.
- Feel free to comment if you found any need to improve

HaP MACDHaP MACD - Advanced DEMA Assisted Signal Indicator
Overview
The HaP MACD is an evolution of the classic MACD, designed for traders who demand faster response times and clearer trend visualisations. By integrating DEMA (Double Exponential Moving Average) logic into the standard MACD framework, this indicator filters out noise and highlights momentum shifts with a unique color-coded dot system.
How It Works
The indicator calculates two types of MACD: a standard one for the main lines and a DEMA-based one for signal generation. This dual approach ensures you stay in the trend while being alerted the moment the momentum starts to fade.
Visual Guide & Color Logic
The signal dots are placed directly on the MACD line to guide your decisions:
🔵 Blue Dot: The Entry Signal. Appears when DEMA conditions first align for a bullish move.
🟢 Green Dot: Strong Momentum. The trend is active and the MACD value is increasing.
🟠 Orange Dot: Warning Signal. The bullish trend is still active, but the momentum is slowing down (MACD is lower than the previous bar).
🔴 Red Dot: Exit Signal. The bullish condition has ended. It’s time to consider closing the position or tightening stops.
Key Features
Reduced Lag: DEMA integration provides earlier signals than standard EMA-based MACDs.
Trend Monitoring: Easily distinguish between a healthy trend (Green) and a tiring trend (Orange).
Customizable: Choose between EMA and SMA for both the oscillator and signal calculations.
Crossover Markers: Optional triangle markers for classic MACD crossovers (can be enabled in settings).

Investment Analysis Bar v2What It Does
A comprehensive analysis bar combining fundamental metrics with technical signals, designed for long-term investors who prioritize quality over momentum.
Core Philosophy: Quality companies trading below their 200 EMA in accumulation zones = opportunities, not warnings.
Tier 1 Bar Metrics
Margins: GM, OM, NIM, FCF Margin
Returns: ROCE, ROE
Growth: Revenue YoY, EPS YoY
Valuation: PE TTM, Forward PE, PEG
Zone: Accumulate / Hold / Trim / Exit
Signal: PRIME / BUY / TRIM / SELL / NEUTRAL
Performance: 1W to 1Y returns
Two Strategy Modes
Value Accumulator (Default) - For long-term position building. Treats below-200-EMA as an opportunity when fundamentals are intact. PRIME signals require: RSI bounce + Volume + Accumulate Zone + All Quality Gates Pass + Below 200 EMA.
Trend Follower - Traditional momentum approach. Prefers entries above 200 EMA.
Quality Gates System
Four fundamental checkpoints:
Gross Margin ≥ 40%
ROCE ≥ 15%
Debt/Equity ≤ 50%
SBC/Revenue ≤ 15%
Strong signals require quality confirmation. PRIME signals require ALL gates to pass.
Zone System
Three calculation methods:
52W Range: Accumulate in bottom 25%, Trim in top 25%
Manual Levels: Set your own price targets
ATR-Based: Dynamic zones from EMA ± ATR
Signal Hierarchy (Value Mode)
SignalMeaning
PRIME 💎Optimal entry - all conditions aligned
BUY 🔼Strong accumulation signal
BUY? ↗Decent entry, not ideal zone
ACCUM 🎯In accumulation zone, quality OK
WAIT ⏳Setup forming, no bounce yet
TRIM 📤Consider taking profits
Alerts Included
Zone transitions (Accumulate, Trim, Exit)
PRIME Entry Signal
Strong Buy / Sell signals
Quality Gate failures
Quality Accumulation Setup
Best Used On
US stocks with fundamental data available. Technical features work on all symbols.
Settings
Fully customizable:
Toggle each metric category
Adjust quality gate thresholds
Choose zone calculation method
Configure RSI/volume parameters
Position bar and panel anywhere

Mass Sentiment & Contrarian (Only Signals)
________________________________________
📘 Contrarian Mass Sentiment Indicator Manual
This indicator is designed to identify moments of psychological exhaustion in the market. Its philosophy is "buy panic and sell euphoria."
1. Where and how is the data taken from?
The indicator analyzes three real-time data sources to filter the signals:
• Psychology (RSI): We use the Relative Strength Index (RSI) to measure the speed and change in price movements.
• If the RSI is very high (>70-75), the "mass" is overbuying (greed).
• If the RSI is very low (<25-30), the "mass" is overselling (panic).
• Price Action (Candlesticks): It is not enough for the RSI to be at an extreme. The indicator looks for reversal patterns (Hammer, Shooting Star, or Engulfing candlesticks). This confirms that the price has indeed found a top or bottom.
• Price Action (Candlesticks): It is not enough for the RSI to be at an extreme. The indicator looks for reversal patterns (Hammer, Shooting Star, or Engulfing candlesticks). This confirms that the price has actually found a top or bottom.
• Price Action (Candlesticks): • Market Effort (Volume): At "Strong" levels, the indicator requires volume to exceed its 20-period moving average. This identifies a volume climax, which typically marks the end of a move.
________________________________________
2. User Manual: Signal Interpretation
The indicator classifies opportunities according to their probability of success:
A. Intensity Levels
Label Strength Meaning Suggested Action
F-VTA / F-CPA Strong Maximum euphoria/panic + Volume + Reversal candle. High probability signal. Look for immediate entry.
M-VTA / M-CPA Medium Standard overload level + Reversal candle. Solid technical confirmation. Trade in favor of the structure.
D-VTA / D-CPA Weak The RSI is just beginning to reverse from moderate levels. Early warning. Do not enter without confirmation using other tools.
B. Trade Execution (Contrarian)
1. Location: Wait for a label to appear. The best are the Strong (F) or Medium (M) lines.
2. Stop Loss: Always place it a few pips/points above the high of the signal candle (for selling) or below the low (for buying).
3. Take Profit: * Target 1: The mid-RSI level (50).
or Target 2: The opposite RSI band (if you sold at 70, aim to close at 30).
________________________________________
3. Golden Tips
• Avoid sideways markets: In very narrow ranges, the RSI can give false signals ("wobbling"). Look for signals that occur after a clear and extended trend.
• Timeframes: The indicator is most reliable on 15-minute, 1-hour, and 4-hour timeframes. On the 1-minute timeframe, market "noise" can generate constant weak signals.
• Confluence: If you see an F-VTA (Strong Sell) signal right at a historical price resistance, the probability of success increases dramatically.

B + A + D v0.4This script combines a momentum histogram (B-Xtrender) with trend strength and direction filters (ADX + DI).
The histogram is built from EMA differentials processed through RSI, showing short- and long-term momentum shifts around the zero line. ADX with DI+ / DI− is used to confirm whether the market is trending and in which direction.
Bullish signals appear when the histogram turns positive and DI+ dominates DI− with sufficient trend strength.
Bearish signals appear when the histogram turns negative and DI− dominates DI+ with sufficient trend strength.
Important note for users:
The strongest and most reliable signals are those that appear immediately after the histogram crosses the zero line (from negative to positive or from positive to negative). Signals that appear later, while the histogram is already extended in the trend, tend to be weaker and should be treated as continuation signals rather than high-probability reversals.
Credits:
Special thanks to the authors of the original concepts and scripts:

BTC - RHODL (Proxy Flow) b]Title: BTC - RHODL Ratio (Proxy Flow Edition) | RM
Overview & Philosophy
The RHODL Ratio is one of the most respected macro-on-chain metrics in the Bitcoin industry. Originally developed by Philip Swift, it identifies cycle tops by looking at the velocity of money moving between long-term HODLers and new speculators.
Why a "Proxy" instead of the "Original"? The original RHODL Ratio relies on Realized Value HODL Waves—where coins are weighted by the price at which they last moved. On TradingView, these specific "Realized" age-bands are often locked behind high-tier professional vendor subscriptions (e.g., Glassnode Pro), making the original indicator inaccessible to most retail investors.
To solve this, I present this Proxy Flow Edition. Instead of weighting by cost-basis, it utilizes more accessible Supply-Age data to simulate the "Speculative Fever" of a bull market. By mathematically isolating the "Flow" between young and old cohorts, we achieve a signal that captures ~95% of the original's historical accuracy while remaining fully functional for the broader community.
Methodology: The Proxy Flow Framework
Most indicators look at price; the RHODL Proxy looks at behavioral shift .
1. The Young vs. Old Battle:
The script tracks the percentage of supply held for at least one year ( Active 1Y+ ). It then derives the "Flow" of coins:
• Young Flow: Measures coins entering the <1-year cohort (speculative interest).
• Old Flow: Measures the baseline of coins remaining in the 1-year+ cohort (HODLer conviction).
2. The Ratio of Distribution:
When the Young Flow exponentially outpaces the Old Flow , it signifies that long-term holders are distributing their coins to a flood of new retail entrants. Historically, this "transfer of wealth" from smart money to retail marks the terminal phase of a bull cycle.
3. Age Normalization:
Bitcoin’s network naturally matures over time. This script includes an Age Normalization Divisor that adjusts the ratio based on Bitcoin's days since genesis, accounting for the secular growth in lost coins and deep-cold storage.
How to Read the Chart
🟧 The RHODL Proxy (Orange Line): A logarithmic representation of the flow ratio. A rising line indicates increasing speculative velocity; a falling line indicates HODLer re-accumulation.
🔴 The Overheated Zone (> 0.5): The danger zone. This area captures the "Speculative Fever" typical of cycle peaks. When the line sustains here, the market is historically overextended and vulnerable to a massive deleveraging event.
🟢 The Accumulation Zone (< -0.5): The maximum opportunity zone. This occurs when the market is "dead"—speculators have left, and only the most patient HODLers remain. Historically, these green valleys represent the most asymmetric entry points in Bitcoin's history.
Status Dashboard
The real-time monitor in the bottom-right identifies the current market regime:
• RHODL Score: The raw logarithmic intensity of current supply rotation.
• Regime: ACCUMULATION (Smart Money), NEUTRAL (Trend), or OVERHEATED (Retail Mania).
Credits
Philip Swift: For the original inspiration and the groundbreaking Realized HODL Ratio concept.
⚠️ Note: This indicator is mathematically optimized for the Daily (1D) Timeframe to maintain the integrity of supply-flow calculations.
Disclaimer
This script is for research and educational purposes only. On-chain metrics are probabilistic, not deterministic. Always manage your risk according to your investment horizon.
Tags
bitcoin, btc, rhodl, on-chain, hodl, cycles, speculation, rotation, macro, Rob Maths

MacroTide Elasticity SystemThe MacroTide Elasticity System is a professional-grade technical analysis tool designed to identify potential trend exhaustions and reversals by modeling price action as an elastic band stretched from a volume-weighted baseline. Unlike standard oscillators (like RSI) that only look at price changes, MacroTide integrates Volume, Price Range, and Volatility to gauge the "energy" behind a move.
1. Concepts and Methodology
The core concept is Mean Reversion based on Volume-Weighted Elasticity. Markets tend to snap back to a value consensus (mean) after over-extension.
Volume-Weighted Baseline: We use a Volume Weighted Moving Average (VWMA) rather than a simple SMA. This ensures that heavy-volume trading days pull the baseline closer to price, while low-volume drift allows the baseline to lag, accurately representing the "true" average cost.
Elasticity Physics: The oscillator calculates how far price has deviated from this VWMA baseline, measured in standard deviations. This creates a normalized "Elasticity Score" (0-100).
High Score (>80): Price is over-extended to the upside (Overbought) relative to volume support.
Low Score (<20): Price is over-extended to the downside (Oversold).
Institutional Absorption (Churn): The script detects specific bar anomalies where Volume is High but Price Range is Low. This pattern often indicates "Churn"—where institutions are absorbing supply or unloading positions without moving the price significantly.
2. Key Features
MacroTrend Detection: Visualizes the market's stretch limits.
Divergence Scanner: Automatically detects and labels Regular Bullish and Bearish divergences. This occurs when price makes a new extreme, but the Elasticity Oscillator fails to confirm it, signaling waning momentum.
Absorption Events: Highlights yellow "sun" markers on the oscillator when high-volume churn is detected, often preceding a breakout or reversal.
Dynamic Coloring: Candles and oscillator lines change color based on the slope of the elasticity (Green for rising momentum, Red for falling).
3. How to Use
Trend Reversals: Look for the oscillator to enter the Overbought (80) or Oversold (20) zones. A reversal signal (triangle marker) is generated when the oscillator crosses back out of these zones, indicating the "snap back" effect has begun.
Divergence Confirmation: Use the "DIV" labels as early warning signs. A Bullish Divergence in an oversold zone is a high-probability setup for a long entry.
Filtering Trends: The center line (50) acts as a trend filter. Above 50 indicates bullish bias; below 50 indicates bearish bias.
4. Settings & Customisation
Lookback Period: Default is 21 (Swing). Increase to 50 or 100 for Macro/Long-term analysis.
StdDev Multiplier: Adjusts the sensitivity of the bands. Higher values (e.g., 2.5 or 3.0) are better for volatile assets like Crypto.
Absorption Volume Factor: Threshold for detecting churn. Default is 1.5x average volume.
Disclaimer: This tool is for informational purposes only. Past performance (divergences/signals) does not guarantee future results. Always manage risk effectively.

RSI Structure Engine (Aggressive Soft) | It measures the direction (trend) and turning points of the market via RSI(7).
But unlike the classic RSI:
It doesn't say "sell at 70 - buy at 30" ❌
Instead:
It reveals the STRUCTURE of the RSI (HH–HL / LH–LL).
That is:
Is there a trend?
Is the trend continuing?
Has the trend ended?
It divides the RSI into 3 zones:
Zone Meaning
RSI ≥ 70 Strong upward momentum (peak regime)
RSI ≤ 30 Strong downward momentum (bottom regime)
30–70 Transition / breathing space
But the key point is this 👇
The bottom/top RSI is FOLLOWED within these regimes, it doesn't lock in immediately.
What and How
🔺 🔻 Locked RSI peak/trough
HH/HL RSI upward trend
LH/LL RSI downward trend
Small points being followed (not yet locked)
If RSI HL breaks, the trend ends
WHAT YOU SHOULDN'T DO?
❌ Don't assume it's a buy-sell indicator alone
❌ Don't short just because you see RSI 70
❌ Don't long just because you see RSI 30
This indicator:
Answers the question "Which side should I be on?"
It doesn't say "Enter right here"
TREND FILTER (MAIN USE)
LONG LOOK:
Last structure: HH + HL
RSI doesn't fall below 30
🔻 HL is protected
SHORT LOOK:
Last structure: LH + LL
RSI cannot rise above 70
🔺 LH is protected
❌ Don't take a trade in the opposite direction.
