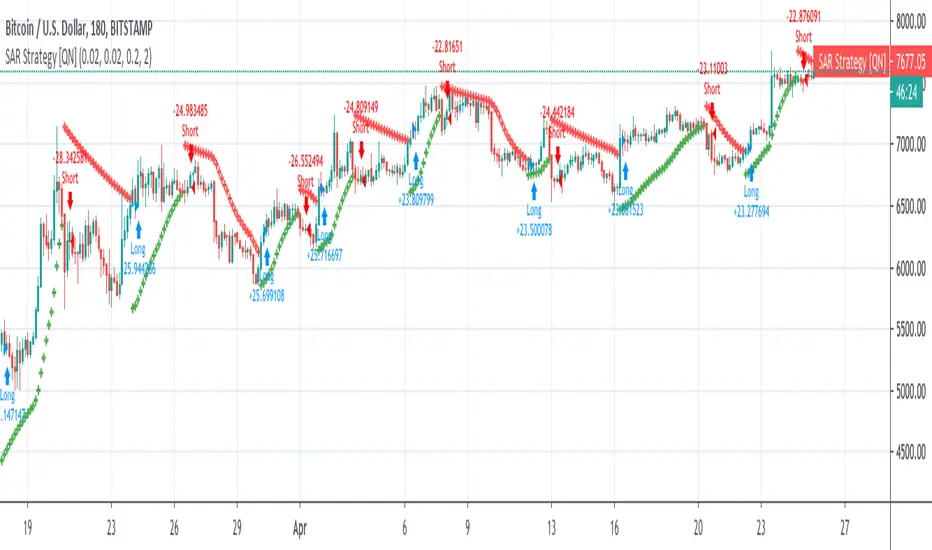
Parabolic SAR Strategy (on close) [QuantNomad]Created a Parabolic SAR strategy where price has to close under/above the level before for it to reverse. This way it should be a bit more stable and protect you from false breakouts.
It was impossible to adjust the built-in "sar" function so I implemented PSAR from scratch. So if you're interested in how it's work inside you can check the code and probably adjust to your need if you have a custom modification of PSAR in your mind.
Parabolic
Price-Curve ChannelIntroduction
Although many will use lines in order to make support and resistances, others might use curves, this is logical since trends are not always linear. Therefore it was also important to take this into consideration, and when i published the price-line channel indicator, i already started a curved version of it. Therefore i propose this new indicator based on the recursive bands framework that allow to return curved support and resistances. The benefits of this indicator are : a totally stable approach, user friendly, and extremities able to converge faster toward the price.
The Indicator
The indicator is way faster than the price-line channel one, this is due to the fast convergence toward the price of the extremities. Length control the reactivity of the indicator, while mult is more related to the rate of convergence, values of mult lower than 1 will make the curve converge slower,
mult = .5
Higher values of mult will make the extremities converge faster toward the price.
mult = 2
Unlike the price-line channel indicator this one is directly "readjusted", this is due to the fact that the extremities are no longer linear, of course a "perfectly" curved version could come in an update, but for the moment it wasn't really a necessity.
Comparison With Price-Line
The fact that the extremities converge faster toward the price allow to possibly capture more tops/bottoms/retracements. However the extremities of both indicator have the same behavior regarding their accuracy, for example the upper extremity have a higher chance to detect a retracement when on a downtrend, while the lower extremity have higher chance to detect a retracement while on a up-trend.
On The Indicator Construction
The recursive bands framework is the core of the indicator, it is important to use it. The curved effect is given by multiplying the correction factor by the barssince function, therefore the correction factor is no longer constant which in return allow for a non linear output.
The size is divided by the square of length in order to keep a certain logic between the output and the length period.
Conclusion
The recursive bands framework prove again to be quite interesting, lot of indicators can be made using it, i only posted a fraction of what can be done with it, which make the recursive bands indicator one of the best indicators i ever made in my opinion.
The proposed indicator is stable, and don't require nightmarish manipulations (unlike the linear channels indicator), its ability to detect possible support and resistances points, although subjective, remain a feature of the indicator. The use of recursion make the indicator efficient. I hope the indicator find some use in the community.
Thanks for reading !
Linear version.
Note
Respect the house rules, always request permission before publishing open source code. This is an original work, requesting permission is the least you can do.
I apologize for any grammatical/orthographic error in this post.

Parabolic SARThis is a redesign of the built-in Parabolic SAR indicator. I added a proper input system, an option to highlight initial points for both lines and an option to choose points width. So, customize it as you want.
Parabolic SAR was originally developed by J. Welles Wilder and described in his book "New Concepts in Technical Trading Systems" (1978). It is a trend-following indicator that can be used as a trailing stop loss.
To know which settings for PSAR are the most profitable on your instrument and timeframe you can use this tool
Profitable Parabolic SAR

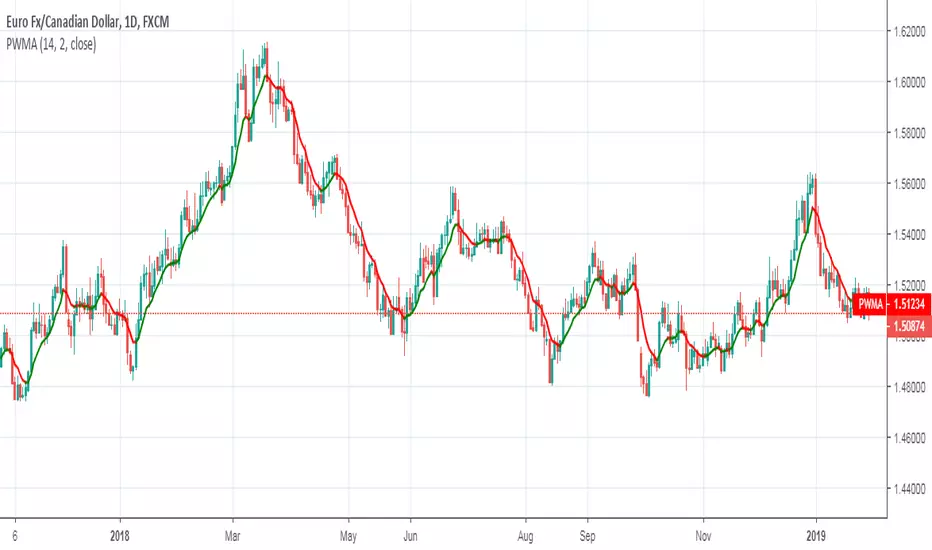
Parabolic Weighted Moving AverageThe weights of this moving average are powers of the weights of the standard weighted moving average WMA .
Remember:
When parameter Power = 0, you will get SMA .
When parameter Power = 1, you will get WMA .
Good luck!
Parabolic SAR Strategy with Bactesting RangeStandard Parabolic SAR Strategy with SAR level plotted and backtesting range option.

Kozlod - Parabolic SAR Strategy AlertsAlerts for standard Parabolic SAR Strategy.
It works best with "Once per bar" option.

DepthHouse - Moving Average ChannelsThe indicator Moving Average Channels was created for experimental purposes due to the parabolic moves BTC has made in the recent past.
How it works:
The basis, or center line, is a standard moving average that is set by the user.
The bands are then a customizable percentage of the basis.
Which based on the settings, could serve as possible support and resistance.
DepthHouse – Moving Average Channels has been published for you all to see and try for yourselves.
Maybe this indicator has uses elsewhere? If you find something feel free to post it in the comments below!
If you like this indicator, please drop a like or comment!
They are very much appreciated!
Be sure to go to my profile and check out my other indicators!

Power Law Correlation Indicator 2.0 The Power Law Correlation Indicator is an attempt to chart when a stock/currency/futures contract goes parabolic forming a upward or downward curve that accelerates according to power laws.
I've read about power laws from Sornette Diedler ( www.marketcalls.in ). And I think the theory is a good one.
The idea behind this indicator is that it will rise to 1.0 as the curve resembles a parabolic up or down swing. When it is below zero, the stock will flatten out.
There are many ways to use this indicator. One way I am testing it out is in trading Strangles or Straddle option trades. When this indicator goes below zero and starts to turn around, it means that it has flattened out. This is like a squeeze indicator. (see the TTM squeeze indicator).
Since this indicator goes below zero and the squeeze plays tend to be mean-reverting; then its a great time to put on a straddle/strangle.
Another way to use it is to think of it in terms of trend strength. Think of it as a kind of ADX, that measures the trend strength. When it is rising, the trend is strong; when it is dropping, the trend is weak.
Lastly I think this indicator needs some work. I tried to put the power (x^n) function into it but my coding skill is limited. I am hoping that Lazy Bear or Ricardo Santos can do it some justice.
Also I think that if we can figure out how to do other power law graphs, perhaps we can plot them together on one indicator.
So far I really like this one for finding Strangle spots. So check it out.
Peace
SpreadEagle71
