Lucid SARI wrote this script after having listened to Hyperwave with Sawcruhteez and Tyler Jenks of Lucid Investments Strategies LLC on July 3, 2019. They felt that the existing built-in Parabolic SAR indicator was not doing its calculations properly, and they hoped that someone might help them correct this. So I tried my hand at it, learning Pine Script as I went. I worked on it through the early morning hours and finished it by 4 am on July 4, 2019. I've added a few bits of code since, adding the rule regarding the SAR not advancing beyond the high (low) of the prior two candles during an uptrend (downtrend), but the core script is as it was.
This code is open source under the MIT license. If you have any improvements or corrections to suggest, please send me a pull request via the github repository github.com
For more details on the initial script, see
Sawcruhteez from Lucid Investment Strategies wrote the following description of the Parabolic SAR, where the quotes are from Section II of J. Welles Wilder, Jr.'s book New Concepts in Technical Trading Systems (1978)
--------------------------------------------------------------------------------------------------------------------------
Parabolic SAR
"The Parabolic Time / Price System derives its name from the fact that when charted, the
pattern formed by the stops resembles a parabola, or if you will, a French Curve. The system
allows room for the market to react for the first few days after a trade is initiated and then the
stop begins to move up more rapidly. The stop is not only a function of price but also a function
of time .
"The stop never backs up. It moves an incremental amount each day, only in the direction which
the trade has been initiated."
"The stop is also a function of price because the distance the stop moves up is relative to the
favorable distance the price has moved... specifically, the most favorable price reached since the
trade was initiated."
A. The calculation for a bullish Parabolic SAR is:
Tomorrow’s SAR = Today’s SAR + AF(EP - Today’s SAR)
"Acceleration Factor (AF) is one of a progression of numbers beginning at 0.02 and ending at
0.20. The AF is increased by 0.02 each period that a new high is made" (if long) or new low is
made (if short).
EP is the "Extreme Price Point for the trade made so far. If Long , EP is the extreme high price for
the trade; if Short , EP is the extreme low price for the trade.”
Most websites will provide the above calculation for the Parabolic SAR but almost all of them
leave out this crucial detail:
B. "Never move the SAR into the previous day’s range or today’s range
"1. If Long , never move the SAR for tomorrow above the previous day’s low or
today’s low . If the SAR is calculated to be above the previous day’s low or
today’s low, then use the lower low between today and the previous day as
the new SAR. Make the next days calculations based upon this SAR.
"2. If Short , never move the SAR for tomorrow below the previous day’s high or
today’s high . If the SAR is calculated to be below the previous days’ high or
today’s high, then use the higher high between today and the previous day
as the new SAR. Make the next days calculations based upon this SAR."
When a Bullish SAR is broken then it gets placed at the SIP (significant point) of the prior trend.
In otherwords it is placed above the current candle and at the price that was the SIP.
The inverse is true for the first Bullish SAR.
"This system is a true reversal system; that is, every stop point is also a reverse point." If breaking
through a bearish SAR (one above price) that simultaneously signals to close a short and go
long.
拋物線轉向指標(PSAR)

Parabolic SAR [Jwammo12]This is a different (dare I say, corrected?) version of the Parabolic SAR that doesn't use the current active close in its calculation. This changes the current SAR to only change when the extrema (high or low) changes.
the chart shows the difference between the built in SAR and the one I have modified.

Bollinger + sarProblem with change in bollingerbands when adding psar short condition - and i dont know why.
Anyone - any ideas?
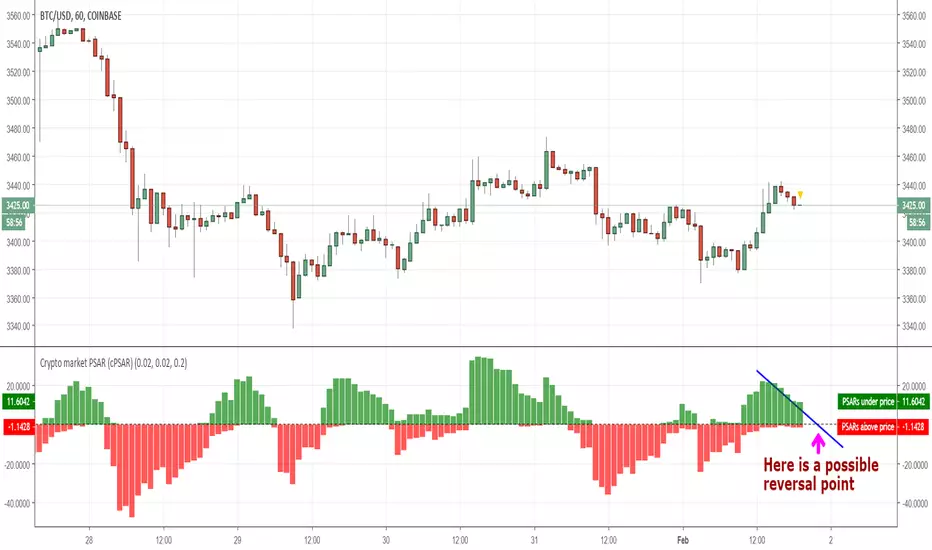
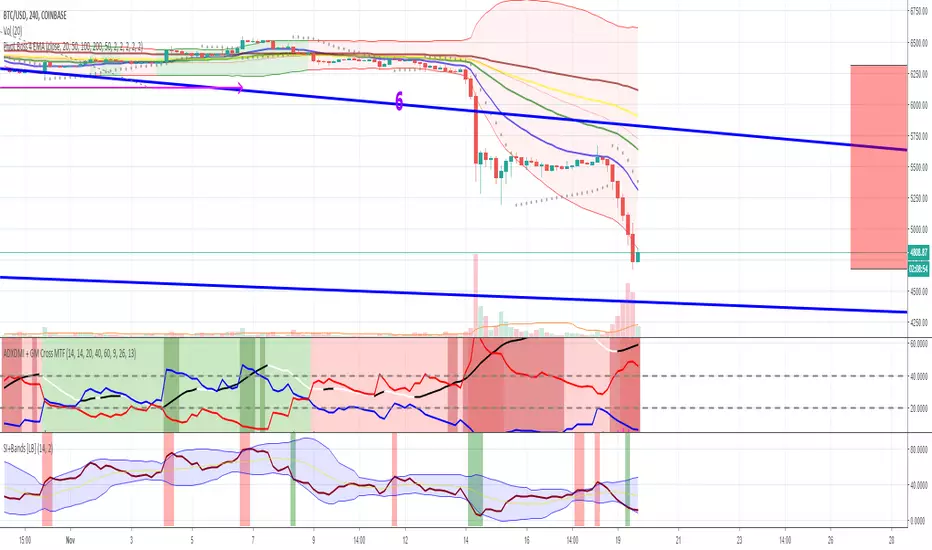
Crypto market PSAR (cPSAR)This indicator calculates the PSARs of the most liquid cryptocurrencies (as percent differences from the prices) and sums them together.
The PSARs under the closes, which act as support, are summed separately and shown in green. The PSARs over the closes (acting as resistance) are summed separately and shown in red.
The result is an indicator which can be interpreted somewhat like the RSI (but keep in mind that PSAR is a lagging indicator unlike the RSI which is a leading indicator). By interpreting this correctly you can - SOMETIMES - predict the short-term turns of the entire crypto market.
Many traders use the prices shown by PSAR (Parabolic Stop And Reverse) to set stop loss prices and/or to take profit and reverse their positions. This is why, on reversal of the PSARs (= when one of the red or green values becomes visibly larger than the other), a strong turning of the market can, sometimes, occur.
SARSI Reversal StrategySimple reversal strategy based on 'Parabolic Stop and Reverse' and 'Relative Stength Index' indicators.

Parabolic SAR Strategy with Bactesting RangeStandard Parabolic SAR Strategy with SAR level plotted and backtesting range option.

Trend Lines and MoreMulti-Indicator consisting of several useful indicators in a single package.
TREND LINES
-By default the 20 SMA and 50 SMA are shown.
-Use "MOVING AVERAGE TYPE" to select SMA, EMA, Double-EMA, Triple-EMA, or Hull.
-Use "50 MA TREND COLOR" to have the 50 turn green/red for uptrend/downtrend.
-Use "DAILY SOURCE ONLY" to always show daily averages regardless of timeframe.
-Use "SHOW LONG MA" to also include 100, 150, and 200 moving averages.
-Use "SHOW MARKERS" to show a small colored marker identifying which line is which.
OTHER INDICATORS
-You can show Bollinger Bands and Parabolic SAR.
-You can highlight key reversal times (9:50-10:10 and 14:40-15:00).
-You can show price offset markers, where was the price "n" periods ago.
That last one is useful to show the level of prices which are about to "fall off" the moving average
and be replaced with current price. So for example, if current price is significantly below the
200-days-ago price, you can gauge the difficulty for the 200 MA to start climbing again.

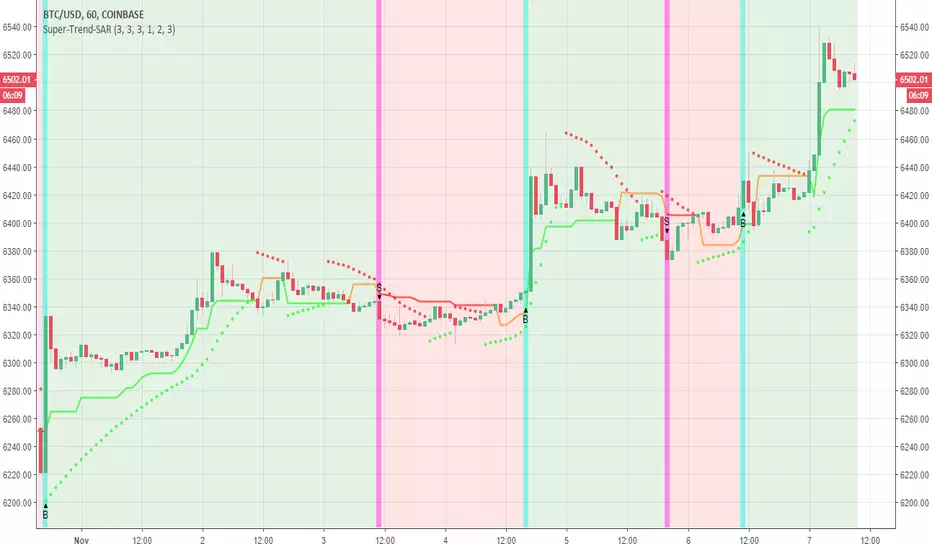
Kozlod - Parabolic SAR Strategy AlertsAlerts for standard Parabolic SAR Strategy.
It works best with "Once per bar" option.

Parabolic SAR & Arnoud Legoux Moving Avarage StrategyIn the first short signal example, after price closes below the ALMA and the parabolic SAR plots above the price high, sell signal is opened with the stops trailed to the PSAR values until the trade is stopped out.
Similarly, you can see a long position where price cuts above the ALMA and the Parabolic SAR plots below the price low. Using these values as the trailing stop levels, we can stay long into the trade until the trade is stopped out.
Find out optimal values by trying. May not produce accurate results in horizontal markets. Thank you.

makemoneyThis system design for you in order to make you money :) I hope...
1. the donochian channel is based on color of high and low price (easy to see where the bars exist)
2. resitance and support are drawn by bolinger system (black and red dots)
3. buy and sell are based on volume model (B and S ) with alerts
4. when PSAR and the buy or sell are in agrreement this are called strong buy or sell points shown in green and red trinangle
5. you can use stop loss or take profit based on system in volume model
using the system very easy and I hope you make noney on it either shorting or longing
I normaly use 1 hour and 30 min charts . you can try another time frames if it work to you
the code is open so you can modify , chane or do what ever you want with it

poki buy and sell Take profit and stop lossThis indicator is based on modelius model of lazy bear weis model with ATR for the buy=B sell =S
in addition there is Take profit and stop loss in % both for short and for long
next stage is to know the resistance level and support based on bollinger marked in blue and red dots
Also included Parabolic Sar (blue and red dots rising up or down)
The color of bulish or bearish zone is based on the cross of Hull avreage and linear regression ( for each time set may need different setting for accuracy )
So how to use this scrupt to better profit
1. if you have B signal and its on lower support level then its good starting place for buy. look at the Parabolic Sar if its in agreement. The exit can be either by S =sell, Take profit that you decide on % or by end of Parabolic SAR upward
2. exact the oposite for short
Play with setting for the desired results or change modify this script for your purpose


Pivot Boss 4 EMA + Bollinger Bands + Parabolic SARA combination of some of my favorite indicators.
All credit to original authors.
Combo Basic IndicatorsThe indicator consists of multiple time frame SMA and PSAR, the very basic indicator but could be profitable.
SMA can be used as dynamic Support-Resistant levels, and value of higher time frame are considered more significant (major level).
For example, Bitcoin currently has weekly support at 6568$, and regarding to SMA of lower time frame (Day, 4H,..) that are near then concluded as sideways condition.
However, trading opportunities still can be found for short term and tight range (scalping).

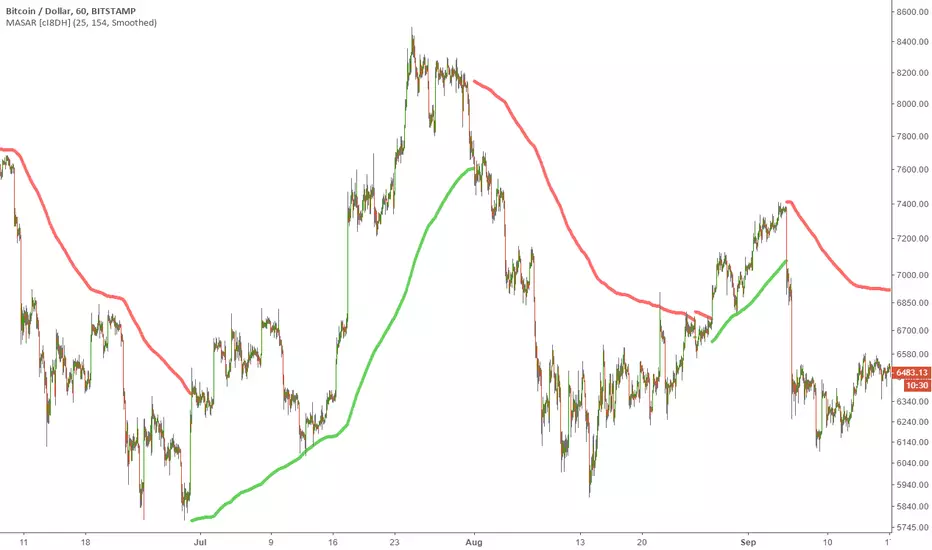
Moving Average Stop and Reverse (MASAR) [cI8DH]This indicator is an alternative to Parabolic Stop and Reverse indicator. It is primarily used to identify points of potential stops and reverses.
Instead of using a static parabolic curve, this indicator adjusts dynamically based on the changes in moving average of the price. Read here to learn more about the usage of this indicator .
I tested the strategy version of this indicator on Bitstamp:BTCUSD and compared the results to the Parabolic SAR. I changed the settings on both indicators to achieve the best results on each indicator. This indicator outperformed the Parabolic SAR by a large margin.
You need to calibrate the indicator depending on the asset and time frame. It works best in trending markets.


LinearSARThis is colur coding of linear model and Sar . it good for a template to make upon it better models
also it a great model for long or short on bitmex
so have fun


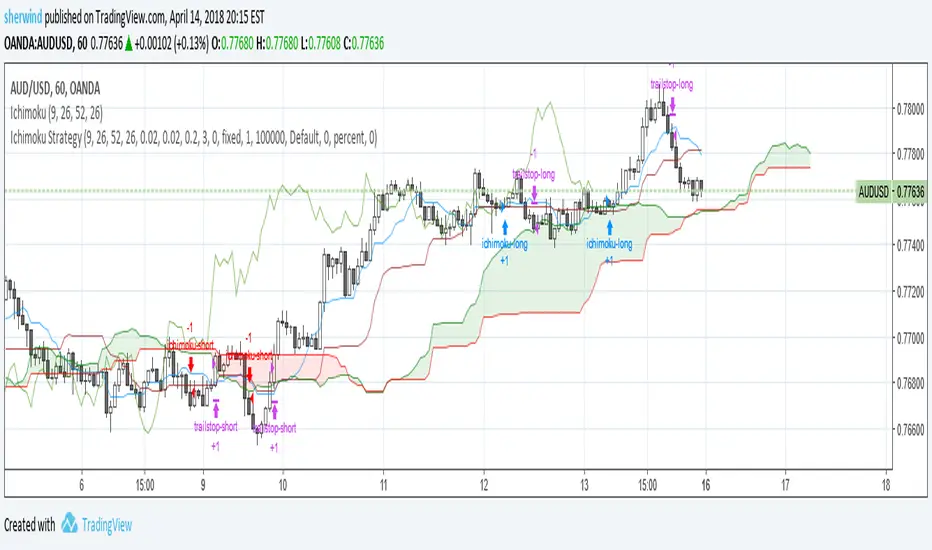
Ichimoku Cloud StrategyBased on the trading strategy described at
stockcharts.com
See Also:
- Backtesting and forwardtesting (of TradingView Strategies)
- 9 Mistakes Quants Make that Cause Backtests to Lie
- When Backtests Meet Reality
- Why MT4 backtesting does not work