Percent changeThis indicator shows WMA ribbons of the percentage of price movements.
Strong peaks show unusual price movement and might indicate a good time to close your position.
A narrow band shows stable price movement and could indicate a good time to get into a position. (Squeeze)
Percent

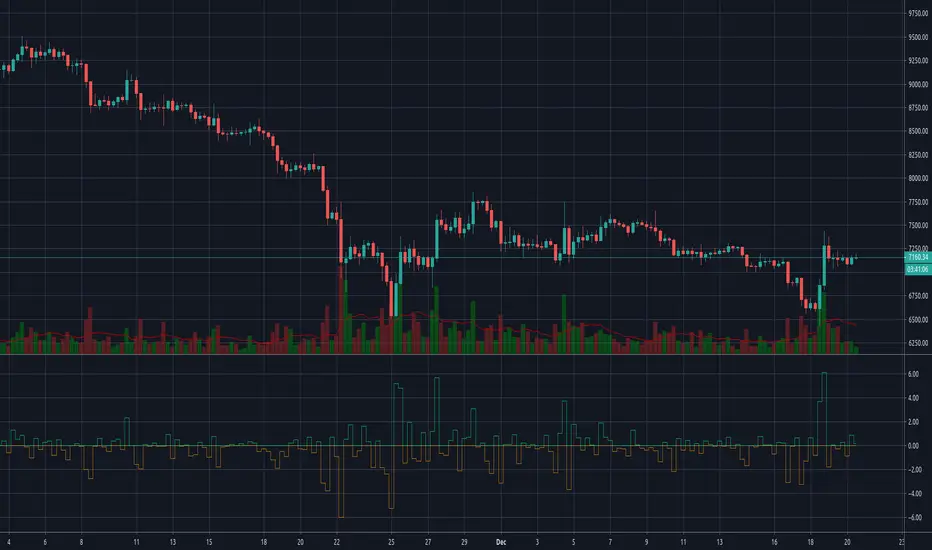
Percentage Relative StrengthA relative strength indicator that compares your main symbol (one on your chart) strength to another symbol by percentage.
The result is plotted as a histogram showing which symbol is rising or falling more in percentage.
In case your chart symbol is TSLA (Tesla) and the indicator 'Symbol to compare' is SPX:
GREEN area (above zero) means TSLA is rising more than the SPX.
RED area (below zero) means TSLA is falling more than the SPX.
To these who wants to understand calculation, it's pretty straightforward.
For each asset we calculate everyday percentage change based on previous close and current close.
We take main asset (chart symbol) percentage and subtract it from percent of change of the symbol we want to compare to.
Result are smoothed by SMA (Simple Moving Average)
You can select different indexes or cfds such as S&P500 (SPX), NASDAQ 100 (NSX), RUSSELL 2000 (RUT) and NASDAQ (IXIC).
Default is S&P 500 (SPX).
Enjoy and Like if you like.

ATR_percentATR_percent is an indicator that i have created to find and be ready for volatility in stock or index. Works best in the 15 min time frame. Use case can be for Nifty and Banknifty.
Basically, whenever the ATR _percent line leaves the yellow line for upwards, market is falling. While if it is heading downwards, the market is rising.

RoC% HistThis script shows the change in percentage of each bar. A glance at the sub-chart will easily show which bars were big movers.
This indicator was mentioned on the August 9 2020 webinar for Dynamic Traders.
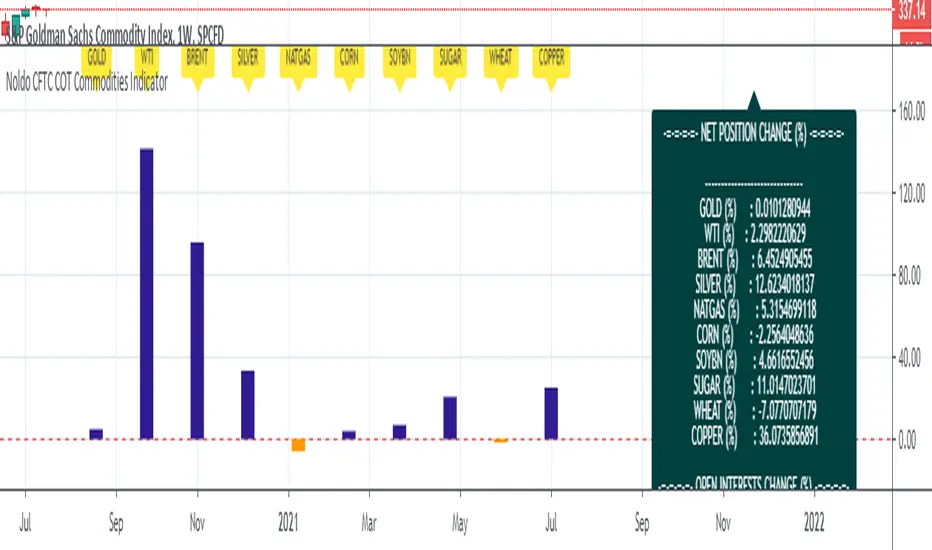
Noldo CFTC COT Commodities IndicatorHi.
Hello, this script has the same logic as Noldo CFTC COT Forex indicator :
It is the version for the future markets.
Major future assets are the subject.
Usage
This script works only on SPGSCI (S&P Goldman Sachs Commodity Index).
You must open SPGSCI :
www.tradingview.com
It only works on 1W graphics.
Because COT data is announced on Tuesday, it will cause repaint every Tuesday.
However, since it is a terminal, this factor is not strong enough to affect your decisions.
For use, you should open the bottom panel, go a little to the right in the history section and enlarge the panel you have opened.
The terminal will take its form in the presentation and provide analysis on the big screen.
COT data are pulled via Quandl.
Regards.
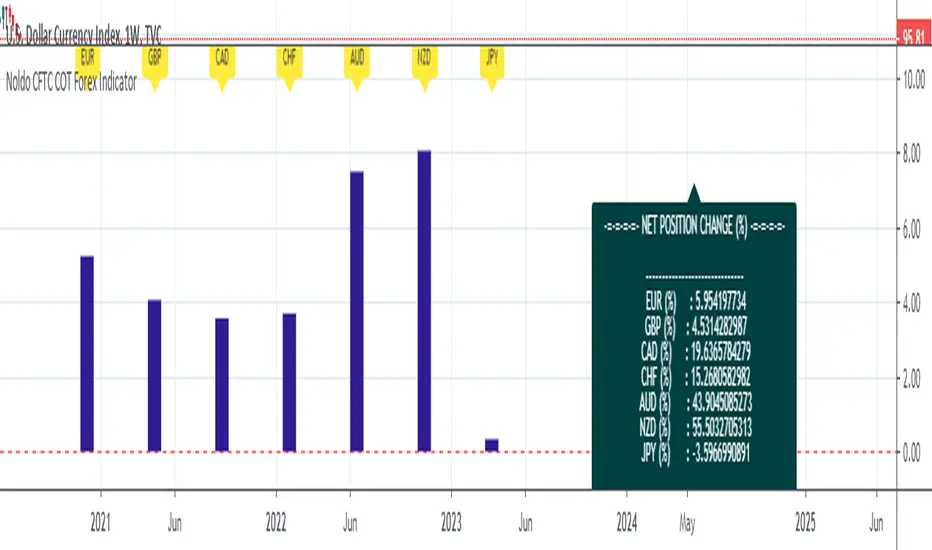
Noldo CFTC COT Forex IndicatorHello.
I decided to publish the COT Forex Indicator, which I created for convenience, as an open source.
The period DXY is determined by the differences between the two signals on the Pivot Reversal Strategy on the weekly chart.(1W)
Thus, relative period point search is automated.
When the new signal comes, after the closing, the number of bars between the previous bar before the new signal comes both directions.
This elapsed time is our period in which we will look back on relative changes.
If there is no signal, the period remains constant, thereby allowing us to notice excessive changes.
And in this period, COT data exchange and price changes are reflected in the terminal.
The automatic time-keeping of the period and the automatic generation of the relative differences of the terminals according to the period prevents a great loss of time.
Thus, we create one of the strong columns that enable us to make decisions.
The other column is the signals we obtained as a result of technical analysis.
The last column is the economic agenda and data tracking.
That's why I made my decision to share this:
Real life should not be distracted,
should not be drowned in the sea of technical analysis.
COT data is one of the most important and valuable tools that bring us signs of real life,
It should not be forgotten !
A lot of time is lost while doing these analyzes, and I wanted this to be much more practical and tidy!
And we can see if there are factors that will back up our incoming signals.
Usage
This script works only on DXY .
You must open DXY.
It only works on 1W graphics.
Because COT data is announced on Tuesday, it will cause repaint every Tuesday.
However, since it is a terminal, this factor is not strong enough to affect your decisions.
For use, you should open the bottom panel, go a little to the right in the history section and enlarge the panel you have opened.
The terminal will take its form in the presentation and provide analysis on the big screen.
COT data are pulled via Quandl.
General kind request:
Authors who know the technical broad expression of the security function or have an idea about its creation, please reach me.
Best regards.
positive percent(Lirshah)positive percent strategy is written based on percentage of positive candles.
so the buy signals trigger when the percentage reach an extreme and the similar scenario for sell signals.
the strategy has best results on 5 sec and 30 sec time frame and specially on indices SPX500, US30, DE30 and ...
the parameters are as below:
numbers of candles
take profit pips
stop loss pips.
the below overview is results of 1 contract on US30 index with 2$ commissions per order.
in order to access scripts contact me directly.

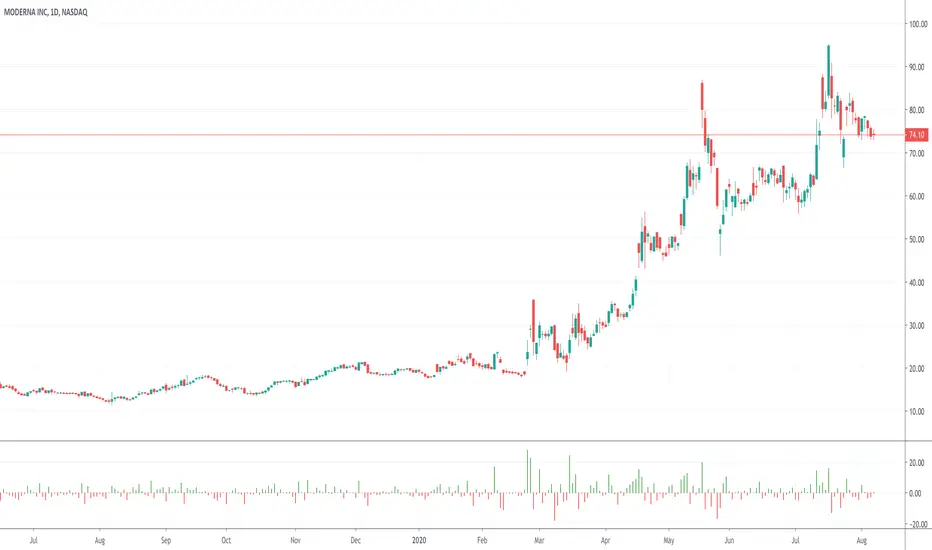
Multi MA on candlestick volume indicatorUses 5 volume moving averages to change the candlestick color depending on how high above average volume is.
The volumes plotted at the bottom of the chart are set to the same settings as the indicator, you can see the volume bars that stick higher above the orange moving average are a different color on the chart to the smaller ones.
Any volume bar that is below the moving average is colored purple.

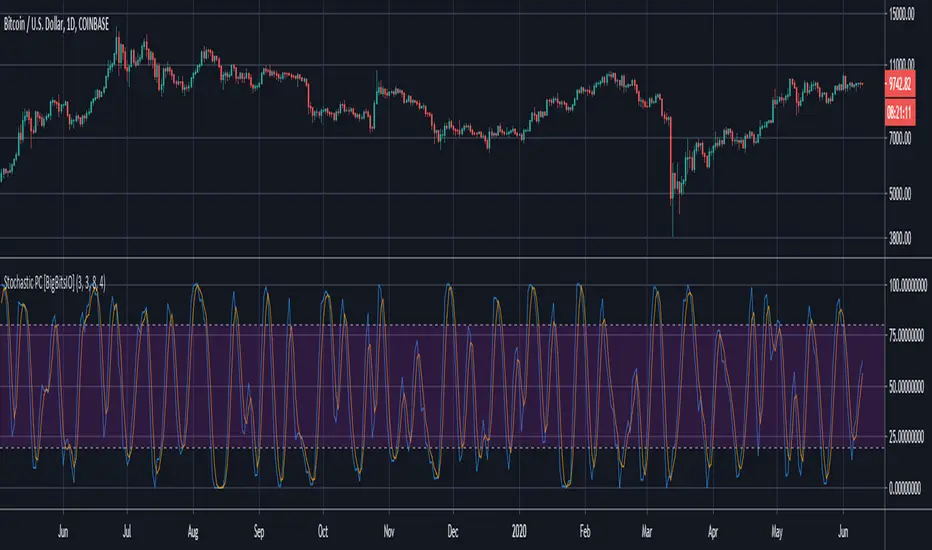
Stochastic PC [BigBitsIO]This script is a very simple stochastic calculation similar to Stochastic RSI that calculates a stochastic value of a moving average of the percentage price change. The purpose of the indicator is to find positive and negative volatility momentum peaks which might be able to help identify changes in trends. Like other stochastic indicators, it may be best used in combination with other indicators.
Explained:
- First gets the % change for the candle from open to close. Green candles produce positive values, red candles produce negative values.
- Then it creates a moving average of that number to try and reduce impacts of very large moves, although this can be changed with the super-fast smoothed length setting. Set it to 1 to remove all smoothing.
- After that, it creates a K value using a stochastic calculation based on the range of the price change moving average we created in the previous step. Set the smoothK to one to use a fast stochastic calculation, it is a slow stochastic calculation by default (3-period SMA of stochastic)
- Finally, to create the D value it calculates a 3-period SMA of the K value.
FAQ:
- Why is this script useful?
- This script can help identify the peaks and valleys of volatility momentum
DISCLAIMER: For educational and entertainment purposes only. Nothing in this content should be interpreted as financial advice or a recommendation to buy or sell any sort of security or investment including all types of crypto. DYOR, TYOB.
ATR %Displays ATR percentage with 2SD. When value is greater than 12% I consider the stock as highly volatile
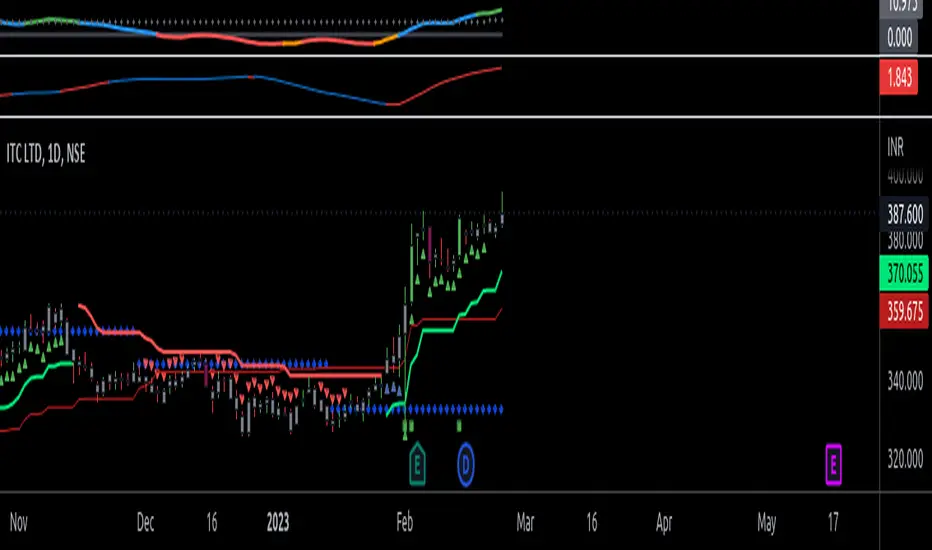
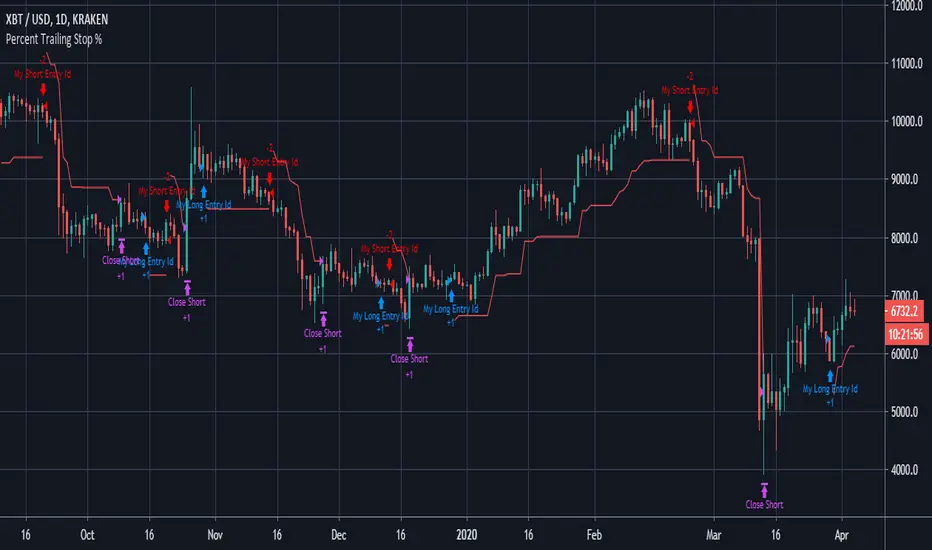
Percent Trailing Stop %===========
Percent Trailing Stop %
===========
Another Stop Loss Indicator today - our last Fixed SL/TP script went down quite well, this one is for adding a Percent Trailing Stop from Entry Price to your own strategy.
You can ignore the actual entry/exit orders - they're based on a simple MA cross and are therefore NOT relevant, NOT profitable and NOT recommended!
You should be using this code as a way of adding a % Trailing Stop to your own scripts - hope it helps!
You should also notice that a generally considered losing strategy (a simple MA cross) could actually become profitable with careful money management - try combining this Trailing Stop script with our Fixed Stop/Take Profit script for really accurate management of your capital.
-----------
Good Luck and Happy Trading!
Percent MrEmamThis is my Gain/Loss indicators that is utilizing with version 4 of pine script, it simply writes the percentage on the last candle as label. If loss passes 100% in reality you lost all your money, so the indicators will show "LIQUIDATED" instead of the percentage.
Any Security vs. Any Security Change Comparison [BigBitsIO]This script allows you to compare the percentage-based change in the price of any two securities on any given (and supported) timeframe on the chart. This can give you a very simple way to compare any two securities against one another.
Ex: If your base security gained 5%, and the other security gained 3% in a single day, the change comparison would show a green bar of 2% because your base security outgained your other security by 2%.
Features:
- 2 securities to compare. A base and other.
- Shortlist of default securities to choose from.
- Ability to override the default securities list and use any security supported by TradingView. You must use the correct security string to do so.
- Resolution is tied to whatever the current chart is using. This way the view of the indicator always reflects the correct resolution of the chart.
- If either market has a 0% change, it is considered likely closed during that period and will result in a change of 0%, as they shouldn't be compared at that time.

Growing or Waning Patterns [Alerts]Example how to color patterns of 3 bodies growing or waning by percentage with or without trend. Also included option for alert triggers. The yellow triangles on the chart denote where the alert triggers will fire.
• Choose Pattern Of Filter: shows bodies growing or waning or both.
• Sample Lengths Of AvgBar: number of recent bars to use for average size.
• BigBar Is Min% Of AvgBar: the minimum percent of average the big bar must be.
• MedBar Is Max% Of BigBar: the maximum percent of big bar the medium bar can be.
• SmlBar Is Max% Of MedBar: the maximum percent of medium bar the small bar can be.
• Repeat Pattern If n Bars: the number of bars to ignore repeat patterns, 1 allows all.
• Trending: on requires the growing or waning patterns to also be trending.
• GrayBars: colors non pattern bodies gray.
NOTICE: This is an example script and not meant to be used as an actual strategy. By using this script or any portion thereof, you acknowledge that you have read and understood that this is for research purposes only and I am not responsible for any financial losses you may incur by using this script!

The 100% - Bitcoin BeatsHello, Hello, Hello,
And welcome back, to Bitcoin Beats.
This is a strategy & Indicator that's essentially supertrend. However, we have used machine learning and AI to determine the best parameters in order to never lose money.
Yes you read that correctly, this Algo has NEVER lost a trade. All trades have come through successfully based on % moves.
A 'Supertrend' indicator is one, which can give you precise buy or sell signal in a trending market. ... The buy and sell signals are generated when the indicator starts plotting either on top of the closing price or below the closing price.
This strategy finds the best exit point without ever having to take a loss. This means you can use Cross leverage if the risk management is good enough and not worry about your account getting REKT as the trade always comes through in the end.
Trade at your own risk.
Thanks you and Goodbye, From Bitcoin Beats.

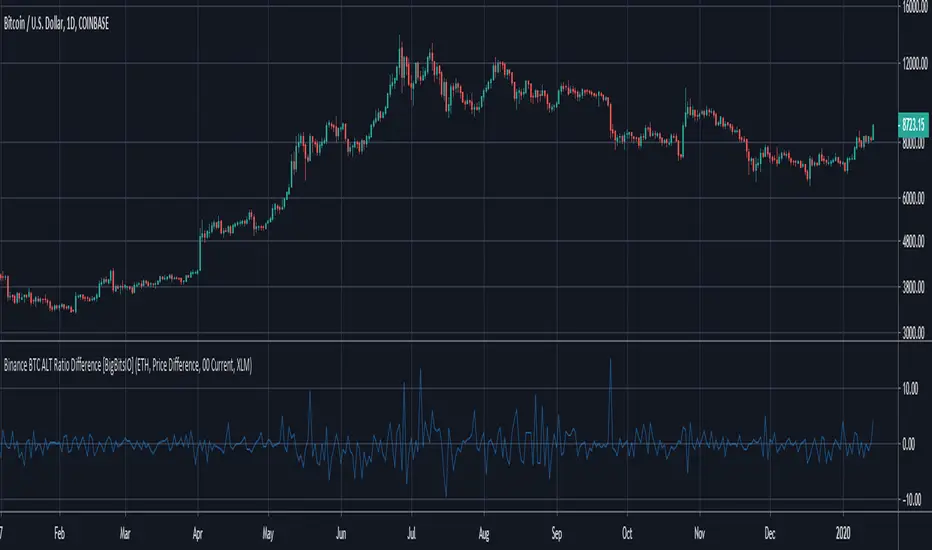
Binance BTC ALT Ratio Difference [BigBitsIO]This was a follower suggested script. This script compares the USDT and BTC relative prices of a particular altcoin traded on Binance by calculating it's USDT price comparative to BTC. This is a very simple calculation (ALT/USDT price divided by ALT/BTC price). From there, we simply subtract the BTC/USDT price from the ALT ration price and we can see if a coin is trading comparatively high or low compared to it's BTC relative price.
This indicator may or may not be useful for you. However, for the purposes of my development series for indicators, I have published it to highlight the ability to concatenate strings to manipulate securities.
Features:
- Dropdown to choose from several built-in altcoin selections.
- Dropdown to choose to show a USDT base difference in the ratio, or a percentage based difference (might be useful for considering fees).
- Dropdown to choose the resolution of the indicator.
- Checkbox to toggle the option to use a custom altcoin.
- Text input to allow entry of a custom altcoin from Binance. Please only use the prefix on its trading pair vs. BTC. I cannot guarantee this will work with all altcoins. They must be traded vs. USDT and BTC on Binance.
- Concatenated strings to manipulate selected securities.
*** DISCLAIMER: For educational and entertainment purposes only. Nothing in this content should be interpreted as financial advice or a recommendation to buy or sell any sort of security or investment including all types of crypto. DYOR, TYOB. ***
Rate of change[UO]Shows the rate of change of prices. The rate of change is the percent "change" of the related bar.
When tje rate of change is too different, there is a trade opportunity.
Seeing the rate of change you can guess if you can judge if you are making a good trade
Yes the information is already on the bar chart but without knowing you might easily miss the importance of that %10 change over there.
Spread PercentThis indicator shows the percent change between the highs and the lows (or optionally the open and close) of each candle. You may also set a low and a high percent threshold to better highlight the candles that exceed your desired spread percent. Red signifies low spread, green is high spread - these are unrelated to the color of the candle body. There is also the option to display a moving average of the spread percent at your desired length which is a representation of volatility over time.
This is not only helpful for historical analysis over time, but this can also be a time saver if you are trying to calculate the measured distance of a move. Save clicks - no more needing to use the measuring tool.
The settings of the indicator on the chart above are:
- Measure Candle Body Only? - No
- Highlight Thresholds? - Yes
- Thresholds Based on Moving Averages? - Yes
- Low Percent Threshold - 3.0
- High Percent Threshold - 7.0
- Show Moving Average? - Yes
- Moving Average Length - 5

InfoPanel - SeasonalityThis panel will show which is the best month to buy a stock, index or ETF or even a cryptocurrency in the past 5 years.
Script to use only with MONTHLY timeframe.
Thanks to: RicardoSantos for his hard work.
Please use comment section for any feedback.

Volatilità massimi e minimiCon questo script ho velocemente la volatilità dei massimi e minimi in base al corpo della candela. Molto utile per capire quando il mercato è incerto. Utile anche per capire la volatilità massima della candela. Aggiunte le medie mobili esponenziali per avere una media di 10 giorni e avere le idee più chiare.

Global Market Signals: Percent BandsWelcome!
Thanks for checking out my indicator. This is a simple indicator that plots "x" percent above and below the price.
You can select Open, High, Low, Close as the price.
Hope this helps,
Andre
Global Market Signals

GMS: Percent Change With LengthBasic Percentage Change Over Time. Works on any timeframe.
- Global Market Signals

