Checklist (D1 / H4 / M15/30 BoS / VP / Fibo / S/R) This is a simple, visual checklist indicator that allows you to quickly assess how many of your strategy conditions are met, without affecting the chart itself. It is ideal for multi-timeframe strategies and point-by-point setup monitoring.
Pine實用程式

TTS Calculator Forex calculator - Input account size, risk size and stop loss size, to get your lot size.

VPG – MTF PrevClose Dashboard (Horizontal 6TF, Bottom Right, VPG – MTF PrevClose Dashboard is a lightweight, real-time visual indicator that displays the current price position across six key timeframes — Weekly (W), Daily (D), 4H, 1H, 30m, and 15m.
It compares the current market price to the previous candle close and shows whether the price is:
🟢 RALLY → higher than the previous close
🔵 BASE → roughly equal (sideways / consolidation)
🔴 DROP → lower than the previous close
Designed as a clean, horizontal dashboard fixed at the bottom-right corner of your chart, it provides instant multi-timeframe insight without cluttering your workspace.
⚙️ Key Features
🔹 Real-time monitoring of six key timeframes (W, D, 4H, 1H, 30m, 15m)
🔹 Clear and intuitive color scheme: Green = RALLY, Blue = BASE, Red = DROP
🔹 Fixed bottom-right placement for consistent visibility
🔹 Horizontal layout for compact, at-a-glance analysis
🔹 Adjustable tolerance to define how “equal” prices are classified as BASE
🔹 No alerts or labels — clean, fast, and resource-light
📊 Best For
Multi-timeframe traders who need quick directional context
Scalpers, intraday, and swing traders doing top-down analysis
Dashboard lovers who want a minimalist, data-driven overview
Confirming short-term price moves against higher-timeframe trends
💡 How to Use
Add VPG – MTF PrevClose Dashboard to any chart (Forex, Crypto, Stocks, Gold, Indices, etc.).
Adjust the tolerance parameter if you want a wider or stricter “BASE” range.
Watch the table in the bottom-right corner — it updates live with every price move.
🧠 About the Author
Nizar M — Developer of VPG indicators focused on clarity, momentum visualization, and fast market interpretation for real-time decision-making.

Luminous Glide Momentum Indicator [wjdtks255]This indicator, named "Customized SuperSmoother MA Oscillator," applies a smoothing filter to price data using a SuperSmoother technique to reduce noise and enhance signal clarity. It calculates two moving averages on the smoothed data—a fast and a slow—whose difference forms the oscillator line. A signal line is derived by smoothing the oscillator with another moving average. The histogram visualizes the divergence between the oscillator and signal lines, indicating momentum strength and direction.
How it works
SuperSmoother Filter: Reduces price noise to provide smoother and more reliable signals than raw data.
Fast and Slow Moving Averages: The fast MA reacts quicker to price changes, while the slow MA indicates longer trends.
Oscillator: The difference between the fast and slow MAs signals shifts in momentum.
Signal Line: A smoothed version of the oscillator used to generate crossovers.
Histogram: Displays the distance between the oscillator and signal line, with color changes indicating bullish or bearish momentum.
Trading Strategy
Buy Signal: When the oscillator crosses above the signal line, it suggests increasing upward momentum, signaling a potential buy opportunity.
Sell Signal: When the oscillator crosses below the signal line, it suggests increasing downward momentum, signaling a potential sell opportunity.
Histogram Size and Color: Larger green bars indicate stronger bullish momentum; larger red bars indicate stronger bearish momentum.
Usage Tips
Combine this oscillator with other indicators or price action analysis to confirm trading signals.
Adjust smoothing and moving average lengths according to your trading timeframe and the asset volatility.
Use proper risk management to filter out potential false signals common in oscillators.

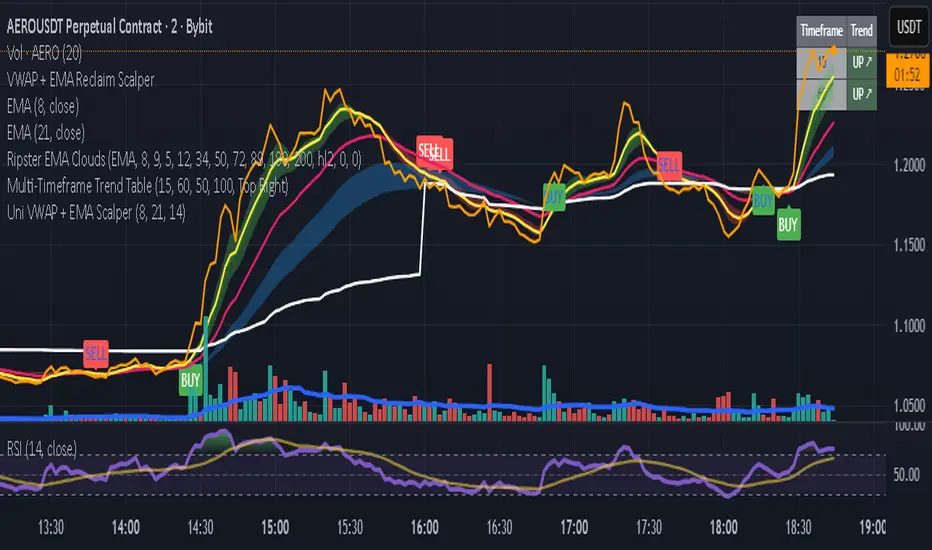
Uni VWAP + EMA ScalperWe learn more through the mistakes we make than the victories we enjoy. This is a work in progress to align visual and audible guidance for scalping and swing trades.
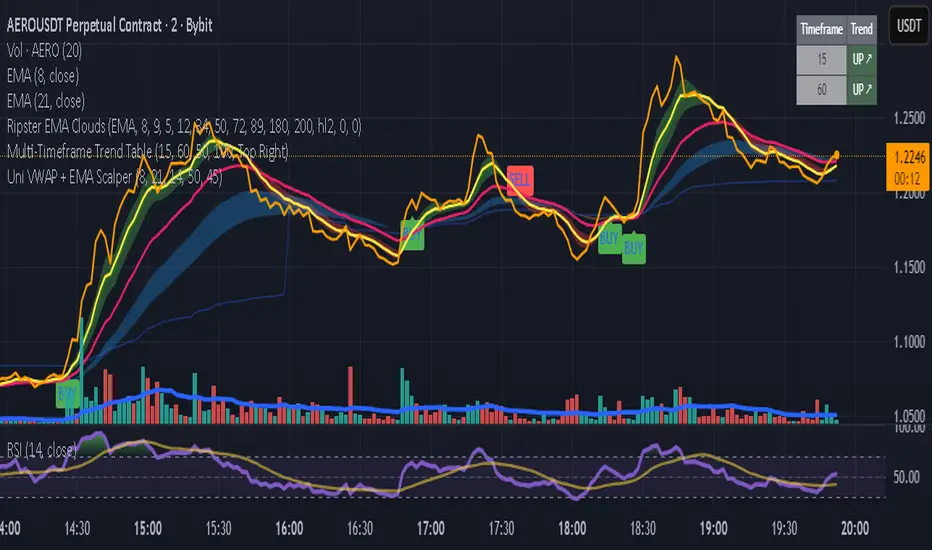
Uni VWAP + EMA ScalperFor backtesting by small group. It's intended to synch and provide visual and audible alerts.
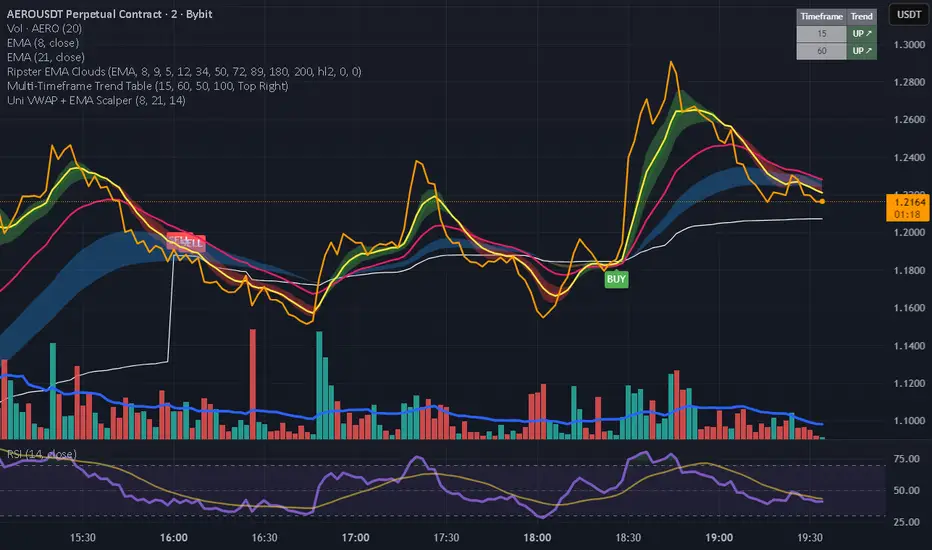
Uni VWAP + EMA ScalperSimple VWAP + EMA crossover test script for personal use and signal experiments.
Prototype tool combining VWAP and EMA crossovers for testing trade timing. Not optimized for live trading.
Daily ATR SL/TP Labels on ChartATR-Based Stop Loss & Take Profit Calculator
This script calculates 20% of the Average True Range (ATR) to determine optimal Stop Loss and Take Profit levels. Designed to assist traders in setting precise risk parameters when placing Buy/Sell orders based on daily market volatility.
Key Features:
Computes 20% of ATR value for proportional risk management
Provides dynamic SL/TP levels aligned to current market conditions
Optimised for Daily timeframe analysis to capture full trading day range
Recommended Usage:
Apply on Daily (1D) timeframe for most accurate results, as this captures the complete intraday price movement and provides reliable volatility measurements for position sizing and risk management decisions.

Time Range HighlighterThis indicator highlights up to two custom time ranges on your chart with fully adjustable settings:
🔧 Features:
Define two separate time sessions
Set custom start and end times (in any time zone)
Choose unique highlight colors and opacity for each session
Toggle each range on or off independently
Timezone input allows syncing sessions to any global market hours (e.g., UTC, Asia/Tehran, New York)
🕒 Example Use Cases:
Highlight market opening hours (e.g. NYSE: 0930–1600)
Track your personal trading hours or peak volatility sessions
Visualize specific algorithm time filters
📌 Usage:
Enter your desired timezone string (e.g., "Asia/Tehran" or "Etc/UTC")
Customize session times like "0930-1200" and "1500-1700"
Adjust colors and visibility to fit your strategy
Ideal for traders who rely on time-based setups or session overlays.

Pro: Big Candle Pip Range (Upper Label)Highlights unusually large candles by calculating pip ranges dynamically based on recent volatility. Shows exact pip count above the candle, color-coded by direction (green bullish, red bearish). Features adaptive thresholds, optional histogram, and works on any instrument or timeframe. Ideal for scalpers and intraday traders spotting high-volatility candles quickly.

Quantura - Session High/LowIntroduction
“Quantura – Session High/Low” is a professional-grade session mapping indicator that automatically identifies and visualizes the highs, lows, and ranges of key global trading sessions — London, New York, and Asia. It helps traders understand when and where liquidity tends to accumulate, allowing for better market structure analysis and session-based strategy alignment.
Originality & Value
This indicator unifies the three most influential global sessions into a single, adaptive visualization tool. Unlike typical session indicators, it dynamically updates live session highs and lows in real time while marking session boundaries and transitions. Its multi-session management system allows for immediate recognition of overlapping liquidity zones — a crucial feature for institutional and intraday traders.
The value and originality come from:
Real-time tracking of session highs, lows, and developing ranges.
Simultaneous visualization of multiple global sessions.
Optional vertical range lines for clearer visual segmentation.
Customizable session times, colors, and time zone offset for global accuracy.
Automatically extending and updating lines as each session progresses.
Functionality & Core Logic
Detects the start and end of each trading session (London, New York, Asia) using built-in time logic and user-defined UTC offsets.
Initializes session-specific high and low variables at the start of each new session.
Continuously updates session high/low levels as new candles form.
Draws color-coded horizontal lines for each session’s high and low.
Optionally adds vertical dotted lines to visually connect session range extremes.
Locks each session’s range once it ends, preserving historical structure for review.
Parameters & Customization
New York Session: Enable/disable, customize time (default 15:30–21:30), and set color.
London Session: Enable/disable, customize time (default 09:00–16:30), and set color.
Asia Session: Enable/disable, customize time (default 02:30–08:00), and set color.
Vertical Line: Toggle dotted vertical lines connecting session high and low levels.
UTC Offset: Adjust session timing to align with your chart’s local time zone.
Visualization & Display
Each session is color-coded for quick identification (default: blue for London, red for New York, green for Asia).
Horizontal lines track evolving session highs and lows in real time.
Once a session closes, the lines remain fixed to mark historical range boundaries.
Vertical dotted lines (optional) visually connect the session’s high and low for clarity.
Supports full overlay display without interfering with other technical indicators.
Use Cases
Identify liquidity zones and range extremes formed during active trading sessions.
Observe session overlaps (London–New York) to anticipate volatility spikes.
Combine with volume or market structure tools for session-based confluence.
Track how price interacts with prior session highs/lows to detect potential reversals.
Analyze session-specific performance patterns for algorithmic or discretionary systems.
Limitations & Recommendations
The indicator is designed for intraday analysis and may not provide meaningful output on daily or higher timeframes.
Adjust session times and UTC offset based on your broker’s or exchange’s timezone.
Does not provide trading signals — it visualizes session structure only.
Combine with liquidity and volatility indicators for full contextual understanding.
Markets & Timeframes
Compatible with all asset classes — including crypto, forex, indices, and commodities — and optimized for intraday timeframes (1m–4h). Particularly useful for traders analyzing session overlaps and volatility transitions.
Author & Access
Developed 100% by Quantura. Published as a Open-source script indicator. Access is free.
Compliance Note
This description fully complies with TradingView’s Script Publishing Rules and House Rules . It provides a detailed explanation of functionality, parameters, and realistic use cases without making any performance or predictive claims.

Inside Day FinderWhat is an Inside Day?
An inside day happens when:
Today’s high is lower than yesterday’s high, and
Today’s low is higher than yesterday’s low.
So, today’s candle is inside the previous day’s range — showing consolidation or indecision in the market.

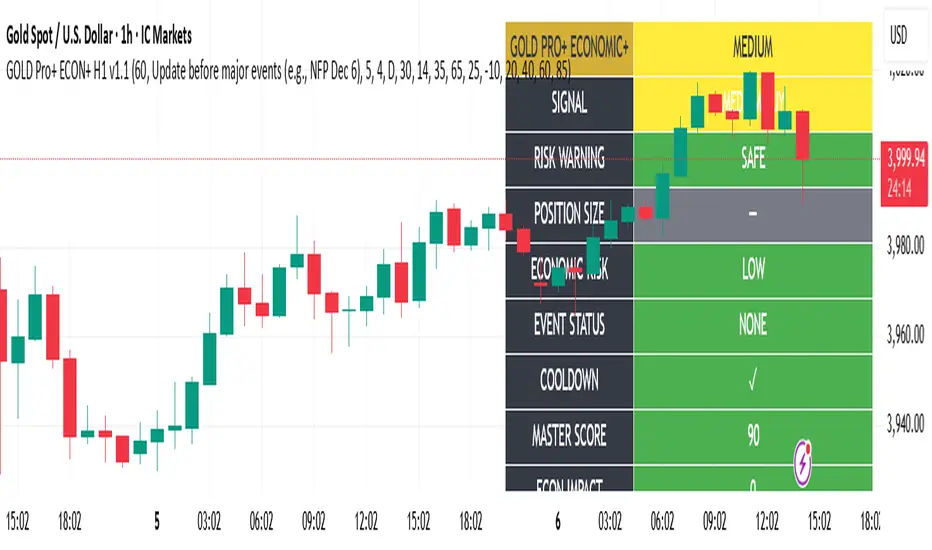
Gold Master Pro Plus ECONOMIC ENHANCED (H1 London v1.1)Overview
This indicator provides gold trading signals with integrated economic calendar awareness, specifically optimized for H1 timeframe and London session trading.
Methodology
The script analyzes multiple technical factors while monitoring economic event risks:
Technical Analysis Components:
RSI for momentum detection with configurable overbought/oversold levels
EMA crossovers (9, 21, 50 periods) for trend direction
MACD for momentum confirmation
ADX for trend strength measurement
Volume analysis for confirmation of price movements
Support/resistance detection using pivot points
Economic Calendar Integration:
Time-based detection of major economic releases (NFP, CPI, FOMC meetings)
Volatility assessment during event periods
USD stability monitoring through currency pair correlations
Automatic cooldown periods after high-impact events
Risk Management Features:
Multi-timeframe confirmation using daily trends
Session-aware scoring (London/NY overlap focus)
Quality-tiered signal classification
Position size recommendations based on signal strength and risk conditions
How to Use
Initial Setup:
Apply to XAUUSD on H1 timeframe
Configure economic settings in the inputs:
Enable economic event filter
Set ET offset (typically 5 hours for winter, 4 for summer)
Select relevant economic events to monitor
Signal Interpretation:
PLATINUM: All conditions aligned (active session, strong volume, low economic risk, trend confirmation)
HIGH: Most factors aligned with moderate risk
MEDIUM: Some factors aligned with acceptable risk
BLOCKED: High economic risk, cooldown period, or manual block active
Dashboard Metrics:
Economic risk level indicates current market safety
Event status shows timing of economic releases
Position size recommends appropriate trade sizing
Master score combines all technical and economic factors
Configuration Options
Economic Settings:
Economic impact threshold (30-80)
ET offset adjustment for timezone accuracy
Cooldown period configuration (2-24 bars)
Technical Settings:
RSI parameters (length, overbought/oversold levels)
Signal thresholds for different quality tiers
Session timing bonuses/penalties
Risk Management:
Multi-timeframe confirmation enable/disable
Higher timeframe selection (D, W, 4H, 12H)
MTF weight percentage (10-50%)
Important Notes
Economic event timing is approximate and should be verified with official economic calendars
Past performance does not guarantee future results
Trading involves substantial risk of loss
This tool is for educational purposes and should not be considered financial advice
The indicator is designed to assist in identifying potential trading opportunities while managing economic event risks through automated protection mechanisms.
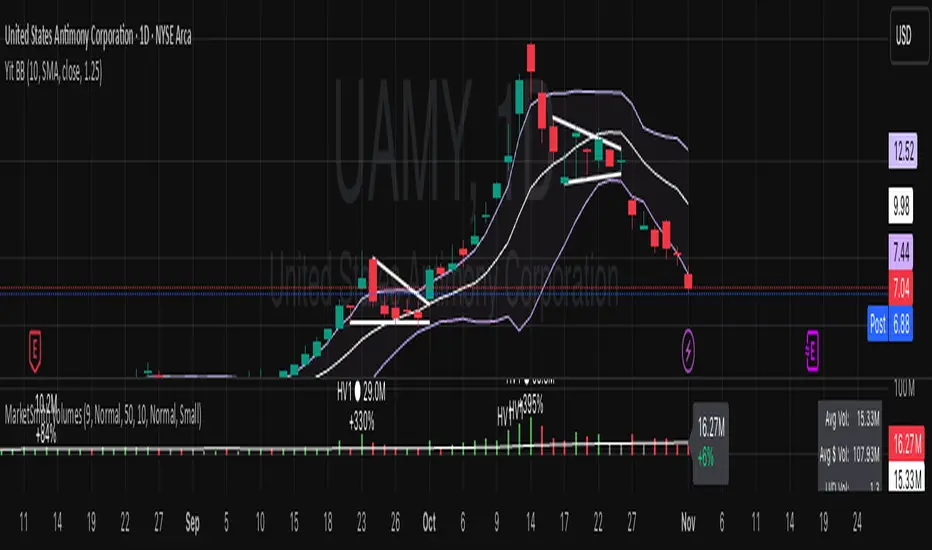
Yit BBIn this script the deviation is 1.25 the normal standard issue Bollinger band indicator uses 2. for my type of trading I don't have time price action to wait for a 2 STDRD DEV. this is a more aggressive type of indicator.
The MA is the 10 day.
Yit's SMA'sThis is the first update to my original SMA indicators I've added the following:
10 Week SMA
40 Week SMA
3 Month SMA
18 Month SMA
I wanted to add more based on these being common indicators various types of trading uses.
There will probably be more in the future.


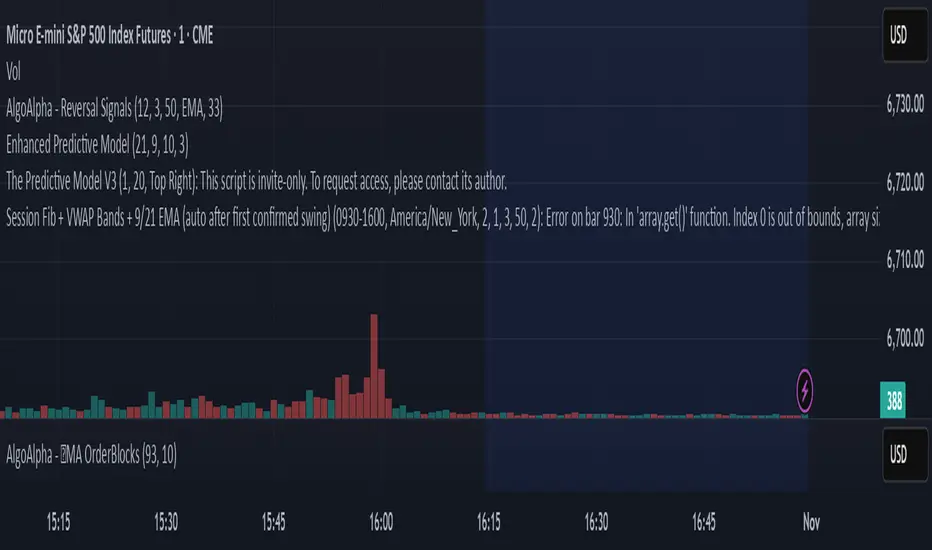
GutroThis TradingView indicator automatically plots Fibonacci retracement levels based on the day’s first confirmed swing between the session high and low (9:30 AM – 4 PM ET). It includes dynamic 0%, 38.2%, 50%, 61.8%, and 100% levels, a shaded golden zone, VWAP bands with standard-deviation envelopes, and a 9/21 EMA ribbon for trend confirmation.
Custom Checklist# Custom Checklist - Trading Preparation & Reminders
A fully customizable checklist overlay indicator for TradingView that helps traders maintain discipline and follow their trading routine systematically.
## 🎯 Purpose
This indicator serves as a visual reminder system on your charts to ensure you complete all necessary analysis steps before entering a trade. Perfect for traders who want to maintain consistency and avoid emotional or rushed trading decisions.
## ✨ Key Features
- **20 Customizable Lines**: Create your own checklist items with any text you need
- **Flexible Display Options**:
- Show/hide title header
- Toggle entire checklist on/off
- Position anywhere on chart (9 positions available)
- Adjustable text size (tiny to huge)
- **Symbol Filtering**: Option to show checklist only on specific symbols (BTC/USD, GOLD, SPX500, USOIL)
- **Customizable Appearance**:
- Background color
- Text color
- Border color
- Transparency controls
- **Clean Interface**: Empty by default - add only the items you need
## 📋 Use Cases
- **Morning Routine**: Daily market preparation checklist
- **Trade Entry Rules**: Verify all setup conditions are met
- **Risk Management**: Confirm stop-loss, position size, and exit strategy
- **Multi-Timeframe Analysis**: Ensure you checked all required timeframes
- **Technical Analysis**: Track which indicators and patterns you've reviewed
- **News & Events**: Remember to check economic calendar and news
- **Personal Rules**: Your custom trading rules and reminders
## 🎨 Customization
Every aspect is customizable:
- All 20 lines can be edited to your needs
- Only non-empty lines are displayed
- Table position adjustable to any corner or middle position
- Color scheme fully customizable to match your chart theme
- Text size scalable for different screen sizes
## 💡 How to Use
1. Add indicator to your chart
2. Open Settings > Checklist Items
3. Fill in your checklist items (Line 1, Line 2, etc.)
4. Customize colors and position in Display Settings
5. Optional: Enable "Show Only on Specific Symbols" to show on select instruments
## 🔧 Display Settings
- **Checklist Title**: Custom header for your checklist
- **Show Title Header**: Toggle title display
- **Show Checklist**: Master on/off switch
- **Symbol Filter**: Restrict display to specific trading instruments
- **Position**: 9 placement options (corners and middle positions)
- **Text Size**: 5 size options (tiny, small, normal, large, huge)
- **Colors**: Background, text, and border fully customizable
## 📝 Example Checklist Ideas
**Swing Trading:**
- Support/Resistance levels identified
- Trend direction confirmed
- Volume analysis completed
- RSI/MACD signals checked
- Risk/Reward ratio calculated
**Day Trading:**
- Pre-market review done
- Key levels marked
- Economic calendar checked
- Trading plan written
- Position size calculated
**Technical Analysis:**
- Multiple timeframe alignment
- Chart patterns identified
- Moving averages reviewed
- Fibonacci levels drawn
- Volume profile analyzed
## ⚙️ Technical Details
- Pine Script v6
- Overlay indicator (displays on main chart)
- Lightweight - no complex calculations
- No repainting
- Works on all timeframes and instruments
## 🎓 Perfect For
- Beginner traders learning systematic analysis
- Experienced traders maintaining discipline
- Anyone who wants visual trading reminders
- Traders following multi-step strategies
- Those prone to FOMO or emotional trading
---
**Note**: This is a visual tool only. It does not generate trading signals or perform analysis. It serves as a reminder checklist to help you follow your own trading process consistently.

NWOG/NDOG - HOKO (Public Version)This indicator shows you the intervals between the start of the week and the new day, and it is useful for everyone and everyone can use it.

Halt-Risk Guard (5-min / 10%) — TTP Safe🛑 Halt-Risk Guard (5-min / 10%) — TTP Safe
Stay clear of halts, invalidations, and over-extended moves.
🔍 Overview
The Halt-Risk Guard helps traders avoid sudden invalidations by monitoring price velocity over the past X minutes (default: 5 min) and flagging when moves exceed a configurable threshold (default: 10%).
Originally built to meet Trade The Pool (TTP) risk-management rules — where even non-halted 10% moves can void trades — this tool provides a clear, visual warning system and optional entry blocker.
⚙️ Key Features
✅ Halt-Risk Detection – Calculates both reference-based and swing-based (high↔low) percentage change over the chosen lookback period.
✅ TTP Safe Mode – “Swing mode” captures extreme volatility spikes that may invalidate trades even when the market stays open.
✅ Entry Blocker (optional) – Automatically greys candles and dims the background during risky conditions to prevent impulsive entries.
✅ Customisable Positioning – Move the on-chart info box to any corner of your chart (Top Left / Top Right / Bottom Left / Bottom Right).
✅ Clean Alerts –
⚠️ At/Above Threshold
✅ Back to Safe
⛔ Entry Blocker Active
✅ Visual Table Display – Compact dashboard shows current % move, lookback window, and threshold with intuitive green/red status.
✅ Strategy-Ready Output – A hidden 0/1 plot lets you block or filter trades in automated systems.
⚡ How It Works
Monitors the selected symbol using your chosen computation timeframe (recommended 1-minute).
Evaluates either:
REF mode: Close-to-close change over the lookback window.
SWING mode: High-to-low range within the same window.
If the move ≥ Threshold %, the script highlights a halt-risk condition and optionally activates the entry blocker.
🎨 Recommended Settings
Lookback: 5 minutes
Threshold: 10 %
Swing mode: ON (TTP-safe)
Computation timeframe: 1 minute
Entry blocker: ON
Dim background: ON
🧠 Use Cases
TTP and other prop-firm evaluations enforcing price-movement limits.
Volatility-based scalping systems to avoid chasing extended candles.
Strategy filters for algorithmic entries (e.g. pause trading during halt-risk windows).
⚠️ Disclaimer
This tool provides visual and alert-based guidance only. It does not guarantee compliance with any specific firm’s rules or eliminate trading risk. Always verify thresholds and rules with your broker or evaluation provider.
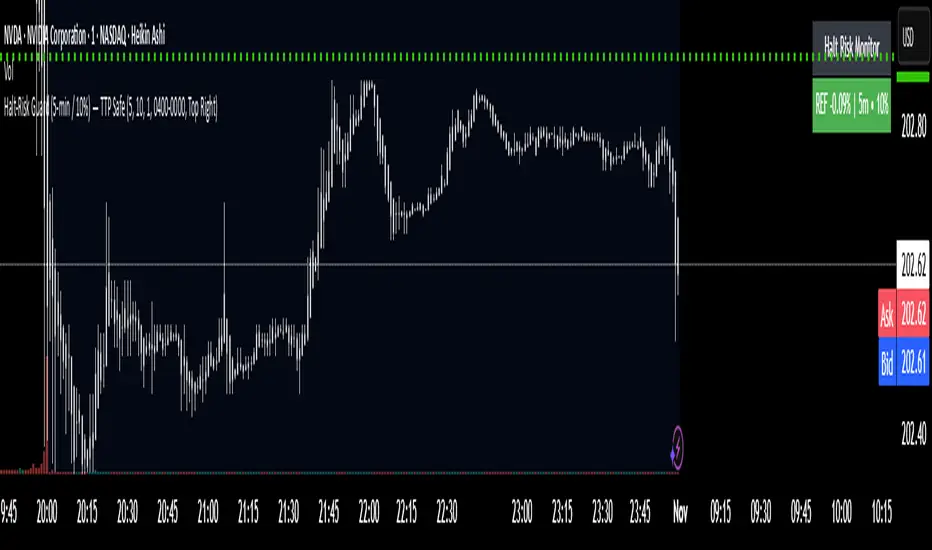
Chart Info Display (HOKO) 2It displays 3 things on the screen in order: symbol, date, time frame. You can use it to capture educational videos to make your chart more beautiful, more private, and more practical.

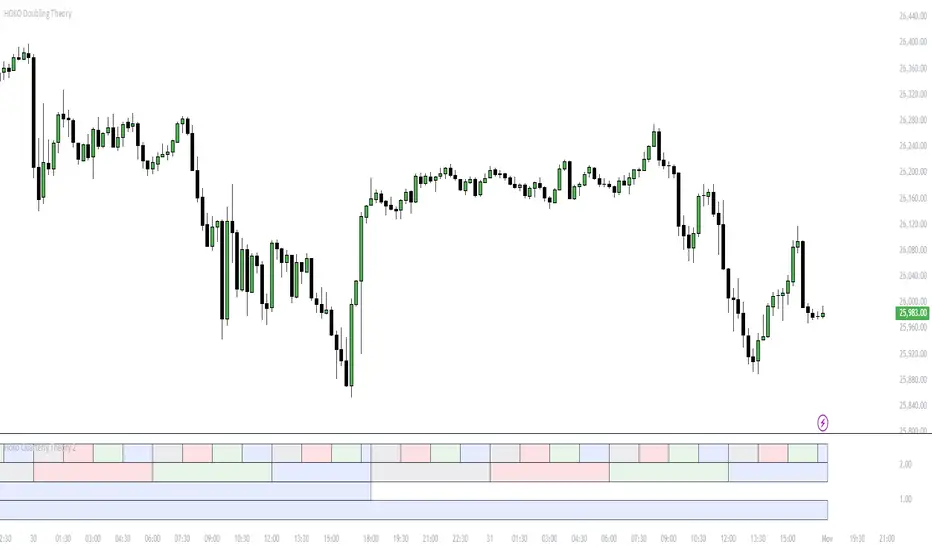
Hoko Quarterly Theory is it this Quarterly Theory but for faraz................................................................................................................................................................................................................