V-Max: Tactical Clock & Price (Master Fit)Overview
The V-Max Tactical Clock & Price is a high-visibility utility dashboard engineered for precision execution in global financial markets. It serves as a "Physical Timezone Navigator," providing real-time price tracking and synchronized local time display directly on the chart. This ensures traders can align their execution with specific market openings and closing volatility regardless of the exchange's default timezone.
Core Technical Logic & Features
This script focuses on the physics of time-alignment and visual stability:
Physical Time Calibration Engine: Unlike standard UI clocks, this script employs a millisecond-level compensation engine using the formula: $timenow + (tz\_offset \times 60 \times 60 \times 1000)$. This allows for precise synchronization with any global market (e.g., London, New York, or Asia sessions).
Momentum-Driven Price Rendering: The price display utilizes conditional coloring logic ($close \ge open ? up\_col : dn\_col$) to provide immediate visual feedback on the current bar's momentum.
High-Identifiability UI (Master Fit): Leverages the table.new titan rendering engine with size.huge font specifications for the price. This ensures critical data remains readable even on small mobile screens or high-density multi-chart layouts.
Anti-Flicker Monospaced Formatting: Employs font.family_monospace to ensure strict numerical alignment, preventing visual flickering or "jumping" during periods of extreme market volatility.
How to Use
Timezone Setup: Enter your local GMT offset (e.g., +8 for Taiwan/Singapore, -5 for New York) in the settings.
Visual Customization: Adjust the dashboard position (default: Bottom Left) and background aesthetics to fit your professional trading workspace.
產品概述
V-Max 戰術時鐘與價格顯示器是一款為全球市場設計的高辨識度工具。它作為一個實時的「全球時區導航儀」,在圖表上直接提供實時價格追蹤與同步化的本地時間顯示,確保交易者能精確對齊各國市場開盤瞬間的波動。
核心技術邏輯與功能物理時間校準引擎:採用毫秒級時間補償運算,公式為:$timenow + (tz\_offset \times 60 \times 60 \times 1000)$。這讓交易者能精確校準全球任一交易所的本地時間。
動能價格渲染:價格顯示具備即時漲跌變色邏輯,提供直觀的即時盤感反饋。
特大字體 UI (Master Fit):採用 size.huge 字體規格顯示價格,確保在移動端或複雜多圖表布局下依然清晰易讀。
防閃爍等寬格式:使用等寬字體確保數字在劇烈波動時不會產生視覺跳動,維持高度的讀數穩定性。
Access & Support
This script is published as a Free Public Utility in the TradingView Library. Disclaimer: For educational purposes only. Past performance does not guarantee future results.
Disclaimer: This script is for technical analysis and educational purposes only. It does not provide financial advice.
Pine實用程式

Multi-Mode Adaptive Strategy [MMAS]This Pine Script strategy dynamically adapts to different market conditions. Users can switch between trend‑following, mean‑reversion, and breakout modes, making it versatile across assets and timeframes.
Key Metrics:
- BTCUSDT / 1D → Return: +42.5%, Sharpe: 1.8, Max Drawdown: -12.3%, Win Rate: 61%
- XAGUSD / 1H → Return: +18.7%, Sharpe: 1.4, Max Drawdown: -8.5%, Win Rate: 58%
- EURUSD / 4H → Return: +25.2%, Sharpe: 1.6, Max Drawdown: -10.1%, Win Rate: 60%
Key Features:
- Modular design: switch between trend, mean‑reversion, breakout
- Works across crypto, forex, commodities
- Clear visualization with signals and metrics
• Global Note
"Universal strategy design for cross‑asset adaptability."
• Tags
trend, mean‑reversion, breakout, multi‑asset, adaptive strategy, pine script

UT Bot Strategy - EMA200 + RSI Filter (v6)UT Bot Indicator – EMA200 + RSI Filter + ATR Trailing Stop (v6)
A precision trend–momentum trading framework for FX, Gold & Indices
Overview
The UT Bot Indicator (v6) combines the proven ATR-based trailing stop engine of the UT methodology with multi-layer trend confirmation and momentum filtering.
This version introduces:
Higher-timeframe trend alignment using EMA 200
Momentum qualification using RSI
Optional Heikin Ashi smoothing
Automatic virtual SL/TP projection for each trade signal
The goal is to reduce false signals during ranging phases while preserving trend capture efficiency in volatile markets such as XAUUSD, GBPUSD, NASDAQ, DXY, BTC.
Core Logic
The indicator tracks dynamic price structure using ATR-based stop recalculation, switching bias only when the candle decisively crosses the trailing boundary.
Signals are validated only when:
Price direction matches the trailing stop reversal
Price is aligned with long-term trend (EMA200)
RSI confirms market momentum direction
This layered confirmation improves trade quality while maintaining responsiveness.
Signal Conditions
Condition Long (Buy) Short (Sell)
Price & ATR Structure Price crosses above trailing stop Price crosses below trailing stop
Trend Direction Close > EMA200 Close < EMA200
Momentum Filter RSI > Buy Threshold RSI < Sell Threshold
Once triggered, the indicator displays virtual SL & TP levels based on the configured percentage targets, allowing traders to visually manage trade lifecycle without repainting.
Best Use Cases
Trend continuation entries after pullbacks
Swing & intraday trading on liquid instruments
High-volatility assets (e.g. Gold / US100 / Crypto)
Filtering low-probability signals in ranging markets
Recommended Settings
Market Key Value ATR Period Notes
Forex 1.0 – 1.5 10–14 Balanced responsiveness
Gold & Indices 1.0 – 2.0 10–20 Reduces noise in volatility spikes
Crypto 1.5 – 3.0 14–21 Smooths erratic candle structure
Alerts Included
UT Long / UT Short
Long / Short Take-Profit Hit
Long / Short Stop-Loss Hit
Enables FTMO-style rule automation, trade management bots, and custom alert workflows.
Disclaimer
This indicator does not repaint, but like any analytical tool it should be used within a structured risk-management framework.
Backtest thoroughly before deploying in live markets.

TalhaFinans ValuationFor Learn more about this and more stuff look at : Talhafinans - Youtube Channel


ICT FVG MNQ (Fixed Stop + Multi-TP Toggles)use- 18 min timeframe.
ICT FVG - use on MNQ 18 min time frame.
it has muti TP levels.-
Prop firm compatible.
Enjoy trading

Long Position Region with Target & StopLong position region manually specified on QMCO. This is a test of a potential new indicator I am building

ICT FVG MNQ (Fixed Stop + Multi-TP Toggles)ICT FVG
use-18 Min timeframe
0) Stabilizer
Evaluation Mode: PriceCh... (PriceChange mode selected)
Bypass Session Filter: OFF (unchecked)
Bypass Open Delay: OFF
Bypass Cooldown: OFF
1) Entry Logic
Swing Strength (past-only): 4
FVG Min Size (ticks): 8
FVG Expire Bars: 12
2) Risk Management
Contracts (integer): 10
Hard Stop (ticks): 65
Use Trailing Stop: OFF
Trail Activation (ticks): 30
Trail Offset (ticks): 15
Use BreakEven (only with Trailing): OFF
BE Trigger (ticks): 20
BE Plus (ticks): 2
Cooldown Bars: 3
Market Open Delay (minutes): 2
2B) Multi Take Profit (No Trailing)
Use TP1/TP2/TP3 when Trailing OFF: ON (checked)
Enable TP1: ON
Enable TP2: ON
Enable TP3: OFF
TP1 Ticks: 29
TP2 Ticks: 54
TP3 Ticks: 54
TP1 %: 30
TP2 %: 60
TP3 %: 30
Move SL to Entry when TP2 fills: OFF (unchecked)
2C) Safety Exits
Force Exit at Session End: ON (checked)
(A “Max Bars In Trade” box is partially visible but not fully shown.)
3) Sessions
Timezone (IANA): America/New... (looks like America/New_York)
Enable Session 1: ON
S1 Start: 0 : 00
S1 End: 16 : 55
Enable Session 2: OFF
(Values shown: S2 Start 18:02, S2 End 23:55, but session 2 is disabled)
4) Visual
Show FVG Zones: ON
Show Dashboard: ON
Dashboard Position: TopRight

Ultimate MACD [captainua]Ultimate MACD - Comprehensive MACD Trading System
Overview
This indicator combines traditional MACD calculations with advanced features including divergence detection, volume analysis, histogram analysis tools, regression forecasting, strong top/bottom detection, and multi-timeframe confirmation to provide a comprehensive MACD-based trading system. The script calculates MACD using configurable moving average types (EMA, SMA, RMA, WMA) and applies various smoothing methods to reduce noise while maintaining responsiveness. The combination of these features creates a multi-layered confirmation system that reduces false signals by requiring alignment across multiple indicators and timeframes.
Core Calculations
MACD Calculation:
The script calculates MACD using the standard formula: MACD Line = Fast MA - Slow MA, Signal Line = Moving Average of MACD Line, Histogram = MACD Line - Signal Line. The default parameters are Fast=12, Slow=26, Signal=9, matching the traditional MACD settings. The script supports four moving average types:
- EMA (Exponential Moving Average): Standard and most responsive, default choice
- SMA (Simple Moving Average): Equal weight to all periods
- RMA (Wilder's Moving Average): Smoother, less responsive
- WMA (Weighted Moving Average): Recent prices weighted more heavily
The price source can be configured as Close (standard), Open, High, Low, HL2, HLC3, or OHLC4. Alternative sources provide different sensitivity characteristics for various trading strategies.
Configuration Presets:
The script includes trading style presets that automatically configure MACD parameters:
- Scalping: Fast/Responsive settings (8,18,6 with minimal smoothing)
- Day Trading: Balanced settings (10,22,7 with minimal smoothing)
- Swing Trading: Standard settings (12,26,9 with moderate smoothing)
- Position Trading: Smooth/Conservative settings (15,35,12 with higher smoothing)
- Custom: Full manual control over all parameters
Histogram Smoothing:
The histogram can be smoothed using EMA to reduce noise and filter minor fluctuations. Smoothing length of 1 = raw histogram (no smoothing), higher values (3-5) = smoother histogram. Increased smoothing reduces noise but may delay signals slightly.
Percentage Mode:
MACD values can be converted to percentage of price (MACD/Close*100) for cross-instrument comparison. This is useful when comparing MACD signals across instruments with different price levels (e.g., BTC vs ETH). The percentage mode normalizes MACD values, making them comparable regardless of instrument price.
MACD Scale Factor:
A scale factor multiplier (default 1.0) allows adjusting MACD display size for better visibility. Use 0.3-0.5 if MACD appears too compressed, or 2.0-3.0 if too small.
Dynamic Overbought/Oversold Levels:
Overbought and oversold levels are calculated dynamically based on MACD's mean and standard deviation over a lookback period. The formula: OB = MACD Mean + (StdDev × OB Multiplier), OS = MACD Mean - (StdDev × OS Multiplier). This adapts to current market conditions, widening in volatile markets and narrowing in calm markets. The lookback period (default 20) controls how quickly the levels adapt: longer periods (30-50) = more stable levels, shorter (10-15) = more responsive.
OB/OS Background Coloring:
Optional background coloring can highlight the entire panel when MACD enters overbought or oversold territory, providing prominent visual indication of extreme conditions. The background colors are drawn on top of the main background to ensure visibility.
Divergence Detection
Regular Divergence:
The script uses the MACD line (not histogram) for divergence detection, which provides more reliable signals. Bullish divergence: Price makes a lower low while MACD line makes a higher low. Bearish divergence: Price makes a higher high while MACD line makes a lower high. Divergences often precede reversals and are powerful reversal signals.
Pivot-Based Divergence:
The divergence detection uses actual pivot points (pivotlow/pivothigh) instead of simple lowest/highest comparisons. This provides more accurate divergence detection by identifying significant pivot lows/highs in both price and MACD line. The pivot-based method compares two recent pivot points: for bullish divergence, price makes a lower low while MACD makes a higher low at the pivot points. This method reduces false divergences by requiring actual pivot points rather than just any low/high within a period.
The pivot lookback parameters (left and right) control how many bars on each side of a pivot are required for confirmation. Higher values = more conservative pivot detection.
Hidden Divergence:
Continuation patterns that signal trend continuation rather than reversal. Bullish hidden divergence: Price makes a higher low but MACD makes a lower low. Bearish hidden divergence: Price makes a lower high but MACD makes a higher high. These patterns indicate the trend is likely to continue in the current direction.
Zero-Line Filter:
The "Don't Touch Zero Line" option ensures divergences occur in proper context: for bullish divergence, MACD must stay below zero; for bearish divergence, MACD must stay above zero. This filters out divergences that occur in neutral zones.
Range Filtering:
Minimum and maximum lookback ranges control the time window between pivots to consider for divergence. This helps filter out divergences that are too close together (noise) or too far apart (less relevant).
Volume Confirmation System
Volume threshold filtering requires current volume to exceed the volume SMA multiplied by the threshold factor. The formula: Volume Confirmed = Volume > (Volume SMA × Threshold). If the threshold is set to 1.0 or lower, volume confirmation is effectively disabled (always returns true). This allows you to use the indicator without volume filtering if desired. Volume confirmation significantly increases divergence and signal reliability.
Volume Climax and Dry-Up Detection:
The script can mark bars with extremely high volume (volume climax) or extremely low volume (volume dry-up). Volume climax indicates potential reversal points or strong momentum continuation. Volume dry-up indicates low participation and may produce unreliable signals. These markers use standard deviation multipliers to identify extreme volume conditions.
Zero-Line Cross Detection
MACD zero-line crosses indicate momentum shifts: above zero = bullish momentum, below zero = bearish momentum. The script includes alert conditions for zero-line crosses with cooldown protection to prevent alert spam. Zero-line crosses can provide early warning signals before MACD crosses the signal line.
Histogram Analysis Tools
Histogram Moving Average:
A moving average applied to the histogram itself helps identify histogram trend direction and acts as a signal line for histogram movements. Supports EMA, SMA, RMA, and WMA types. Useful for identifying when histogram momentum is strengthening or weakening.
Histogram Bollinger Bands:
Bollinger Bands are applied to the MACD histogram instead of price. The calculation: Basis = SMA(Histogram, Period), StdDev = stdev(Histogram, Period), Upper = Basis + (StdDev × Deviation Multiplier), Lower = Basis - (StdDev × Deviation Multiplier). This creates dynamic zones around the histogram that adapt to histogram volatility. When the histogram touches or exceeds the bands, it indicates extreme conditions relative to recent histogram behavior.
Stochastic MACD (StochMACD):
Stochastic MACD applies the Stochastic oscillator formula to the MACD histogram instead of price. This normalizes the histogram to a 0-100 scale, making it easier to identify overbought/oversold conditions on the histogram itself. The calculation: %K = ((Histogram - Lowest Histogram) / (Highest Histogram - Lowest Histogram)) × 100. %K is smoothed, and %D is calculated as the moving average of smoothed %K. Standard thresholds are 80 (overbought) and 20 (oversold).
Regression Forecasting
The script includes advanced regression forecasting that predicts future MACD values using mathematical models. This helps anticipate potential MACD movements and provides forward-looking context for trading decisions.
Regression Types:
- Linear: Simple trend line (y = mx + b) - fastest, works well for steady trends
- Polynomial: Quadratic curve (y = ax² + bx + c) - captures curvature in MACD movement
- Exponential Smoothing: Weighted average with more weight on recent values - responsive to recent changes
- Moving Average: Uses difference between short and long MA to estimate trend - stable and smooth
Forecast Horizon:
Number of bars to forecast ahead (default 5, max 50 for linear/MA, max 20 for polynomial due to performance). Longer horizons predict further ahead but may be less accurate.
Confidence Bands:
Optional upper/lower bands around forecast show prediction uncertainty based on forecast error (standard deviation of prediction vs actual). Wider bands = higher uncertainty. The confidence level multiplier (default 1.5) controls band width.
Forecast Display:
Forecast appears as dotted lines extending forward from current bar, with optional confidence bands. All forecast values respect percentage mode and scale factor settings.
Strong Top/Bottom Signals
The script detects strong recovery from extreme MACD levels, generating "sBottom" and "sTop" signals. These identify significant reversal potential when MACD recovers substantially from overbought/oversold extremes.
Strong Bottom (sBottom):
Triggered when:
1. MACD was at or near its lowest point in the bottom period (default 10 bars)
2. MACD was in or near the oversold zone
3. MACD has recovered by at least the threshold amount (default 0.5) from the lowest point
4. Recovery persists for confirmation bars (default 2 consecutive bars)
5. MACD has moved out of the oversold zone
6. Volume is above average
7. All enabled filters pass
8. Minimum bars have passed since last signal (reset period, default 5 bars)
Strong Top (sTop):
Triggered when:
1. MACD was at or near its highest point in the top period (default 7 bars)
2. MACD was in or near the overbought zone
3. MACD has declined by at least the threshold amount (default 0.5) from the highest point
4. Decline persists for confirmation bars (default 2 consecutive bars)
5. MACD has moved out of the overbought zone
6. Volume is above average
7. All enabled filters pass
8. Minimum bars have passed since last signal (reset period, default 5 bars)
Label Placement:
sTop/sBottom labels appear on the historical bar where the actual extreme occurred (not on current bar), showing the exact MACD value at that extreme. Labels respect the unified distance checking system to prevent overlaps with Buy/Sell Strength labels.
Signal Strength Calculation
The script calculates a composite signal strength score (0-100) based on multiple factors:
- MACD distance from signal line (0-50 points): Larger separation indicates stronger signal
- Volume confirmation (0-15 points): Volume above average adds points
- Secondary timeframe alignment (0-15 points): Higher timeframe agreement adds points
- Distance from zero line (0-20 points): Closer to zero can indicate stronger reversal potential
Higher scores (70+) indicate stronger, more reliable signals. The signal strength is displayed in the statistics table and can be used as a filter to only accept signals above a threshold.
Smart Label Placement System
The script includes an advanced label placement system that tracks MACD extremes and places Buy/Sell Strength labels at optimal locations:
Label Placement Algorithm:
- Labels appear on the current bar at confirmation (not on historical extreme bars), ensuring they're visible when the signal is confirmed
- The system tracks pending signals when MACD enters OB/OS zones or crosses the signal line
- During tracking, the system continuously searches for the true extreme (lowest MACD for buys, highest MACD for sells) within a configurable historical lookback period
- Labels are only finalized when: (1) MACD exits the OB/OS zone, (2) sufficient bars have passed (2x minimum distance), (3) MACD has recovered/declined by a configurable percentage from the extreme (default 15%), and (4) tracking has stopped (no better extreme found)
Label Spacing and Overlap Prevention:
- Minimum Bars Between Labels: Base distance requirement (default 5 bars)
- Label Spacing Multiplier: Scales the base distance (default 1.5x) for better distribution. Higher values = more spacing between labels
- Effective distance = Base Distance × Spacing Multiplier (e.g., 5 × 1.5 = 7.5 bars minimum)
- Unified distance checking prevents overlaps between all label types (Buy Strength, Sell Strength, sTop, sBottom)
Strength-Based Filtering:
- Label Strength Minimum (%): Only labels with strength at or above this threshold are displayed (default 75%)
- When multiple potential labels are close together, the system automatically compares strengths and keeps only the strongest one
- This ensures only the most significant signals are displayed, reducing chart clutter
Zero Line Polarity Enforcement:
- Enforce Zero Line Polarity (default enabled): Ensures labels follow traditional MACD interpretation
- Buy Strength labels only appear when the tracked extreme MACD value was below zero (negative territory)
- Sell Strength labels only appear when the tracked extreme MACD value was above zero (positive territory)
- This prevents counter-intuitive labels (e.g., Buy labels above zero line) and aligns with standard MACD trading principles
Recovery/Decline Confirmation:
- Recovery/Decline Confirm (%): Percent move away from the extreme required before finalizing (default 15%)
- For Buy labels: MACD must recover by at least this percentage from the tracked bottom
- For Sell labels: MACD must decline by at least this percentage from the tracked top
- Higher values = more confirmation required, fewer but more reliable labels
Historical Lookback:
- Historical Lookback for Label Placement: Number of bars to search for true extremes (default 20)
- The system searches within this period to find the actual lowest/highest MACD value
- Higher values analyze more history but may be slower; lower values are faster but may miss some extremes
Cross Quality Score
The script calculates a MACD cross quality score (0-100) that rates crossover quality based on:
- Cross angle (0-50 points): Steeper crosses = stronger signals
- Volume confirmation (0-25 points): Volume above average adds points
- Distance from zero line (0-25 points): Crosses near zero line are stronger
This score helps identify high-quality crossovers and can be used as a filter to only accept signals meeting minimum quality threshold.
Filtering System
Histogram Filter:
Requires histogram to be above zero for buy signals, below zero for sell signals. Ensures momentum alignment before generating signals.
Signal Strength Filter:
Requires minimum signal strength score for signals. Higher threshold = only strongest signals pass. This combines multiple confirmation factors into a single filter.
Cross Quality Filter:
Requires minimum cross quality score for signals. Rates crossover quality based on angle, volume, momentum, and distance from zero. Only signals meeting minimum quality threshold will be generated.
All filters use the pattern: filterResult = not filterEnabled OR conditionMet. This means if a filter is disabled, it always passes (returns true). Filters can be combined, and all must pass for a signal to fire.
Multi-Timeframe Analysis
The script can display MACD from a secondary (higher) timeframe and use it for confirmation. When secondary timeframe confirmation is enabled, signals require the higher timeframe MACD to align (bullish/bearish) with the signal direction. This ensures signals align with the larger trend context, reducing counter-trend trades.
Secondary Timeframe MACD:
The secondary timeframe MACD uses the same calculation parameters (fast, slow, signal, MA type) as the main MACD but from a higher timeframe. This provides context for the current timeframe's MACD position relative to the larger trend. The secondary MACD lines are displayed on the chart when enabled.
Noise Filtering
Noise filtering hides small histogram movements below a threshold. This helps focus on significant moves and reduces chart clutter. When enabled, only histogram movements above the threshold are displayed. Typical threshold values are 0.1-0.5 for most instruments, depending on the instrument's price range and volatility.
Signal Debounce
Signal debounce prevents duplicate MACD cross signals within a short time period. Useful when MACD crosses back and forth quickly, creating multiple signals. Debounce ensures only one signal per period, reducing signal spam during choppy markets. This is separate from alert cooldown, which applies to all alert types.
Background Color Modes
The script offers three background color modes:
- Dynamic: Full MACD heatmap based on OB/OS conditions, confidence, and momentum. Provides rich visual feedback.
- Monotone: Soft neutral background but still allows overlays (OB/OS zones). Keeps the chart clean without overpowering candles.
- Off: No MACD background (only overlays and plots). Maximum chart cleanliness.
When OB/OS background colors are enabled, they are drawn on top of the main background to ensure visibility.
Statistics Table
A real-time statistics table displays current MACD values, signal strength, distance from zero line, secondary timeframe alignment, volume confirmation status, and all active filter statuses. The table dynamically adjusts to show only enabled features, keeping it clean and relevant. The table position can be configured (Top Left, Top Right, Bottom Left, Bottom Right).
Performance Statistics Table
An optional performance statistics table shows comprehensive filter diagnostics:
- Total buy/sell signals (raw crossover count before filters)
- Filtered buy/sell signals (signals that passed all filters)
- Overall pass rates (percentage of signals that passed filters)
- Rejected signals count
- Filter-by-filter rejection diagnostics showing which filters rejected how many signals
This table helps optimize filter settings by showing which filters are most restrictive and how they impact signal frequency. The diagnostics format shows rejections as "X B / Y S" (X buy signals rejected, Y sell signals rejected) or "Disabled" if the filter is not active.
Alert System
The script includes separate alert conditions for each signal type:
- MACD Cross: MACD line crosses above/below Signal line (with or without secondary confirmation)
- Zero-Line Cross: MACD crosses above/below zero
- Divergence: Regular and hidden divergence detections
- Secondary Timeframe: Higher timeframe MACD crosses
- Histogram MA Cross: Histogram crosses above/below its moving average
- Histogram Zero Cross: Histogram crosses above/below zero
- StochMACD: StochMACD overbought/oversold entries and %K/%D crosses
- Histogram BB: Histogram touches/breaks Bollinger Bands
- Volume Events: Volume climax and dry-up detections
- OB/OS: MACD entry/exit from overbought/oversold zones
- Strong Top/Bottom: sTop and sBottom signal detections
Each alert type has its own cooldown system to prevent alert spam. The cooldown requires a minimum number of bars between alerts of the same type, reducing duplicate alerts during volatile periods. Alert types can be filtered to only evaluate specific alert types (All, MACD Cross, Zero Line, Divergence, Secondary Timeframe, Histogram MA, Histogram Zero, StochMACD, Histogram BB, Volume Events, OB/OS, Strong Top/Bottom).
How Components Work Together
MACD crossovers provide the primary signal when the MACD line crosses the Signal line. Zero-line crosses indicate momentum shifts and can provide early warning signals. Divergences identify potential reversals before they occur.
Volume confirmation ensures signals occur with sufficient market participation, filtering out low-volume false breakouts. Histogram analysis tools (MA, Bollinger Bands, StochMACD) provide additional context for signal reliability and identify significant histogram zones.
Signal strength combines multiple confirmation factors into a single score, making it easy to filter for only the strongest signals. Cross quality score rates crossover quality to identify high-quality setups. Multi-timeframe confirmation ensures signals align with higher timeframe trends, reducing counter-trend trades.
Usage Instructions
Getting Started:
The default configuration shows MACD(12,26,9) with standard EMA calculations. Start with default settings and observe behavior, then customize settings to match your trading style. You can use configuration presets for quick setup based on your trading style.
Customizing MACD Parameters:
Adjust Fast Length (default 12), Slow Length (default 26), and Signal Length (default 9) based on your trading timeframe. Shorter periods (8,17,7) for faster signals, longer (15,30,12) for smoother signals. You can change the moving average type: EMA for responsiveness, RMA for smoothness, WMA for recent price emphasis.
Price Source Selection:
Choose Close (standard), or alternative sources (HL2, HLC3, OHLC4) for different sensitivity. HL2 uses the midpoint of the high-low range, HLC3 and OHLC4 incorporate more price information.
Histogram Smoothing:
Set smoothing to 1 for raw histogram (no smoothing), or increase (3-5) for smoother histogram that reduces noise. Higher smoothing reduces false signals but may delay signals slightly.
Percentage Mode:
Enable percentage mode when comparing MACD across instruments with different price levels. This normalizes MACD values, making them directly comparable.
Dynamic OB/OS Levels:
The dynamic thresholds automatically adapt to volatility. Adjust the multipliers (default 1.5) to fine-tune sensitivity: higher values (2.0-3.0) = more extreme thresholds (fewer signals), lower (1.0-1.5) = more frequent signals. Adjust the lookback period to control how quickly levels adapt. Enable OB/OS background colors for visual indication of extreme conditions.
Volume Confirmation:
Set volume threshold to 1.0 (default, effectively disabled) or higher (1.2-1.5) for standard confirmation. Higher values require more volume for confirmation. Set to 0.1 to completely disable volume filtering.
Filters:
Enable filters gradually to find your preferred balance. Start with histogram filter for basic momentum alignment, then add signal strength filter (threshold 50+) for moderate signals, then cross quality filter (threshold 50+) for high-quality crossovers. Combine filters for highest-quality signals but expect fewer signals.
Divergence:
Enable divergence detection and adjust pivot lookback parameters. Pivot-based divergence provides more accurate detection using actual pivot points. Hidden divergence is useful for trend-following strategies. Adjust range parameters to filter divergences by time window.
Zero-Line Crosses:
Zero-line cross alerts are automatically available when alerts are enabled. These provide early warning signals for momentum shifts.
Histogram Analysis Tools:
Enable Histogram Moving Average to see histogram trend direction. Enable Histogram Bollinger Bands to identify extreme histogram zones. Enable Stochastic MACD to normalize histogram to 0-100 scale for overbought/oversold identification.
Multi-Timeframe:
Enable secondary timeframe MACD to see higher timeframe context. Enable secondary confirmation to require higher timeframe alignment for signals.
Signal Strength:
Signal strength is automatically calculated and displayed in the statistics table. Use signal strength filter to only accept signals above a threshold (e.g., 50 for moderate, 70+ for strong signals only).
Smart Label Placement:
Configure label placement settings to control label appearance and quality:
- Label Strength Minimum (%): Set threshold (default 75%) to show only strong signals. Higher = fewer, stronger labels
- Label Spacing Multiplier: Adjust spacing (default 1.5x) for better distribution. Higher = more spacing between labels
- Recovery/Decline Confirm (%): Set confirmation requirement (default 15%). Higher = more confirmation, fewer labels
- Enforce Zero Line Polarity: Enable (default) to ensure Buy labels only appear when tracked extreme was below zero, Sell labels only when above zero
- Historical Lookback: Adjust search period (default 20 bars) for finding true extremes. Higher = more history analyzed
Cross Quality:
Cross quality score is automatically calculated for crossovers. Use cross quality filter to only accept high-quality crossovers (threshold 50+ for moderate, 70+ for high quality).
Alerts:
Set up alerts for your preferred signal types. Enable alert cooldown (default enabled, 5 bars) to prevent alert spam. Use alert type filter to only evaluate specific alert types (All, MACD Cross, Zero Line, Divergence, Secondary Timeframe, Histogram MA, Histogram Zero, StochMACD, Histogram BB, Volume Events, OB/OS, Strong Top/Bottom). Each signal type has its own alert condition, so you can be selective about which signals trigger alerts.
Visual Elements and Signal Markers
The script uses various visual markers to indicate signals and conditions:
- MACD Line: Green when above signal (bullish), red when below (bearish) if dynamic colors enabled. Optional black outline for enhanced visibility
- Signal Line: Orange line with optional black outline for enhanced visibility
- Histogram: Color-coded based on direction and momentum (green for bullish rising, lime for bullish falling, red for bearish falling, orange for bearish rising)
- Zero Line: Horizontal reference line at MACD = 0
- Fill to Zero: Green/red semi-transparent fill between MACD line and zero line showing bullish/bearish territory
- Fill Between OB/OS: Blue semi-transparent fill between overbought/oversold thresholds highlighting neutral zone
- OB/OS Background Colors: Background coloring when MACD enters overbought/oversold zones
- Background Colors: Dynamic or monotone backgrounds indicating MACD state, or custom chart background
- Divergence Labels: "🐂" for bullish, "🐻" for bearish, "H Bull" for hidden bullish, "H Bear" for hidden bearish
- Divergence Lines: Colored lines connecting pivot points when divergences are detected
- Volume Climax Markers: ⚡ symbol for extremely high volume
- Volume Dry-Up Markers: 💧 symbol for extremely low volume
- Buy/Sell Strength Labels: Show signal strength percentage (e.g., "Buy Strength: 75%")
- Strong Top/Bottom Labels: "sTop" and "sBottom" for extreme level recoveries
- Secondary MACD Lines: Purple lines showing higher timeframe MACD
- Histogram MA: Orange line showing histogram moving average
- Histogram BB: Blue bands around histogram showing extreme zones
- StochMACD Lines: %K and %D lines with overbought/oversold thresholds
- Regression Forecast: Dotted blue lines extending forward with optional confidence bands
Signal Priority and Interpretation
Signals are generated independently and can occur simultaneously. Higher-priority signals generally indicate stronger setups:
1. MACD Cross with Multiple Filters - Highest priority: Requires MACD crossover plus all enabled filters (histogram, signal strength, cross quality) and secondary timeframe confirmation if enabled. These are the most reliable signals.
2. Zero-Line Cross - High priority: Indicates momentum shift. Can provide early warning signals before MACD crosses the signal line.
3. Divergence Signals - Medium-High priority: Pivot-based divergence is more reliable than simple divergence. Hidden divergence indicates continuation rather than reversal.
4. MACD Cross with Basic Filters - Medium priority: MACD crosses signal line with basic histogram filter. Less reliable alone but useful when combined with other confirmations.
Best practice: Wait for multiple confirmations. For example, a MACD crossover combined with divergence, volume confirmation, and secondary timeframe alignment provides the strongest setup.
Chart Requirements
For proper script functionality and compliance with TradingView requirements, ensure your chart displays:
- Symbol name: The trading pair or instrument name should be visible
- Timeframe: The chart timeframe should be clearly displayed
- Script name: "Ultimate MACD " should be visible in the indicator title
These elements help traders understand what they're viewing and ensure proper script identification. The script automatically includes this information in the indicator title and chart labels.
Performance Considerations
The script is optimized for performance:
- Calculations use efficient Pine Script functions (ta.ema, ta.sma, etc.) which are optimized by TradingView
- Conditional execution: Features only calculate when enabled
- Label management: Old labels are automatically deleted to prevent accumulation
- Array management: Divergence label arrays are limited to prevent memory accumulation
The script should perform well on all timeframes. On very long historical data with many enabled features, performance may be slightly slower, but it remains usable.
Known Limitations and Considerations
- Dynamic OB/OS levels can vary significantly based on recent MACD volatility. In very volatile markets, levels may be wider; in calm markets, they may be narrower.
- Volume confirmation requires sufficient historical volume data. On new instruments or very short timeframes, volume calculations may be less reliable.
- Higher timeframe MACD uses request.security() which may have slight delays on some data feeds.
- Stochastic MACD requires the histogram to have sufficient history. Very short periods on new charts may produce less reliable StochMACD values initially.
- Divergence detection requires sufficient historical data to identify pivot points. Very short lookback periods may produce false positives.
Practical Use Cases
The indicator can be configured for different trading styles and timeframes:
Swing Trading:
Use MACD(12,26,9) with secondary timeframe confirmation. Enable divergence detection. Use signal strength filter (threshold 50+) and cross quality filter (threshold 50+) for higher-quality signals. Enable histogram analysis tools for additional context.
Day Trading:
Use MACD(8,17,7) or use "Day Trading" preset with minimal histogram smoothing for faster signals. Enable zero-line cross alerts for early signals. Use volume confirmation with threshold 1.2-1.5. Enable histogram MA for momentum tracking.
Trend Following:
Use MACD(12,26,9) or longer periods (15,30,12) for smoother signals. Enable secondary timeframe confirmation for trend alignment. Hidden divergence signals are useful for trend continuation entries. Use cross quality filter to identify high-quality crossovers.
Reversal Trading:
Focus on divergence detection (pivot-based for accuracy) combined with zero-line crosses. Enable volume confirmation. Use histogram Bollinger Bands to identify extreme histogram zones. Enable StochMACD for overbought/oversold identification.
Multi-Timeframe Analysis:
Enable secondary timeframe MACD to see context from larger timeframes. For example, use daily MACD on hourly charts to understand the larger trend context. Enable secondary confirmation to require higher timeframe alignment for signals.
Practical Tips and Best Practices
Getting Started:
Start with default settings and observe MACD behavior. The default configuration (MACD 12,26,9 with EMA) is balanced and works well across different markets. After observing behavior, customize settings to match your trading style. Consider using configuration presets for quick setup.
Reducing Repainting:
All signals are based on confirmed bars, minimizing repainting. The script uses confirmed bar data for all calculations to ensure backtesting accuracy.
Signal Quality:
MACD crosses with multiple filters provide the highest-quality signals because they require alignment across multiple indicators. These signals have lower frequency but higher reliability. Use signal strength scores to identify the strongest signals (70+). Use cross quality scores to identify high-quality crossovers (70+).
Filter Combinations:
Start with histogram filter for basic momentum alignment, then add signal strength filter for moderate signals, then cross quality filter for high-quality crossovers. Combining all filters significantly reduces false signals but also reduces signal frequency. Find your balance based on your risk tolerance.
Volume Filtering:
Set volume threshold to 1.0 (default, effectively disabled) or lower to effectively disable volume filtering if you trade instruments with unreliable volume data or want to test without volume confirmation. Standard confirmation uses 1.2-1.5 threshold.
MACD Period Selection:
Standard MACD(12,26,9) provides balanced signals suitable for most trading. Shorter periods (8,17,7) for faster signals, longer (15,30,12) for smoother signals. Adjust based on your timeframe and trading style. Consider using configuration presets for optimized settings.
Moving Average Type:
EMA provides balanced responsiveness with smoothness. RMA is smoother and less responsive. WMA gives more weight to recent prices. SMA gives equal weight to all periods. Choose based on your preference for responsiveness vs. smoothness.
Divergence:
Pivot-based divergence is more reliable than simple divergence because it uses actual pivot points. Hidden divergence indicates continuation rather than reversal, useful for trend-following strategies. Adjust pivot lookback parameters to control sensitivity.
Dynamic Thresholds:
Dynamic OB/OS thresholds automatically adapt to volatility. In volatile markets, thresholds widen; in calm markets, they narrow. Adjust the multipliers to fine-tune sensitivity. Enable OB/OS background colors for visual indication.
Zero-Line Crosses:
Zero-line crosses indicate momentum shifts and can provide early warning signals before MACD crosses the signal line. Enable alerts for zero-line crosses to catch these early signals.
Alert Management:
Enable alert cooldown (default enabled, 5 bars) to prevent alert spam. Use alert type filter to only evaluate specific alert types. Signal debounce (default enabled, 3 bars) prevents duplicate MACD cross signals during choppy markets.
Technical Specifications
- Pine Script Version: v6
- Indicator Type: Non-overlay (displays in separate panel below price chart)
- Repainting Behavior: Minimal - all signals are based on confirmed bars, ensuring accurate backtesting results
- Performance: Optimized with conditional execution. Features only calculate when enabled.
- Compatibility: Works on all timeframes (1 minute to 1 month) and all instruments (stocks, forex, crypto, futures, etc.)
- Edge Case Handling: All calculations include safety checks for division by zero, NA values, and boundary conditions. Alert cooldowns and signal debounce handle edge cases where conditions never occurred or values are NA.
Technical Notes
- All MACD values respect percentage mode conversion when enabled
- Volume confirmation uses cached volume SMA for performance
- Label arrays (divergence) are automatically limited to prevent memory accumulation
- Background coloring: OB/OS backgrounds are drawn on top of main background to ensure visibility
- All calculations are optimized with conditional execution - features only calculate when enabled (performance optimization)
- Signal strength calculation combines multiple factors into a single score for easy filtering
- Cross quality calculation rates crossover quality based on angle, volume, and distance from zero
- Secondary timeframe MACD uses request.security() for higher timeframe data access
- Histogram analysis features (Bollinger Bands, MA, StochMACD) provide additional context beyond basic MACD signals
- Statistics table dynamically adjusts to show only enabled features, keeping it clean and relevant
- Divergence detection uses MACD line (not histogram) for more reliable signals
- Configuration presets automatically optimize MACD parameters for different trading styles
- Smart label placement: Labels appear on current bar at confirmation, using strength from tracked extreme point
- Label spacing uses effective distance (base distance × spacing multiplier) for better distribution
- Zero line polarity enforcement ensures Buy labels only appear when tracked extreme MACD < 0, Sell labels only when tracked extreme MACD > 0
- Label finalization requires MACD exit from OB/OS zone, sufficient bars passed, and recovery/decline percentage confirmation
- Strength-based filtering automatically compares and keeps only the strongest label when multiple signals are close together
- Enhanced visualization: Line outlines drawn behind main lines for superior visibility (black default, configurable)
- Enhanced visualization: Fill between MACD and zero line provides instant visual feedback (green above, red below)
- Enhanced visualization: Fill between OB/OS thresholds highlights neutral zone when dynamic levels are active
- Custom chart background overrides background mode when enabled, allowing theme-consistent indicator panels

Custom Psych Levels V1.0 Theo SignalDesigned for Index Traders (US30, NAS100, SPX, etc.)
This script is especially effective on indices such as US30, where price reacts strongly to round numbers and psychological zones. By default, levels adapt to index volatility and scale, making them ideal for:
intraday bias
pullback reactions
breakout continuation
mean reversion back to balance
Key Features
Rolling 5-Level Structure: Always centered on current price, no chart clutter.
Market- Aware Magnitude: Automatically adjusts spacing for indices, forex, and crypto.
Higher- Timeframe Anchoring: Optionally anchor levels to 1H, 4H, or Daily closes while trading lower timeframes like 5m.
Session & Daily Resets: Re-anchor levels at New York session open or new trading day.
Center Line Emphasis: Highlight the equilibrium level with custom color, thickness, and style for balance or decision-making.
Clean Professional Display: Only relevant levels near price are shown.
Trading Use Cases
This indicator is best used as a framework, not a signal generator. It excels when combined with:
momentum confirmation
liquidity sweeps
volume expansion
break-and-retest structures
session highs/lows
Traders can use the center line as balance, outer levels as reaction or target zones, and band shifts as confirmation of expanding price acceptance.

Su Shen Comprehensive Trading System V2.0Su Shen Comprehensive Trading System V2.0
Su Shen Comprehensive Trading System is an intelligent trading assistant indicator that integrates multiple technical analysis tools. This system provides a comprehensive market perspective by combining multi-timeframe trend analysis, key level identification, and intelligent trading signals.
Core Features
Multi-dimensional Trend Analysis: Analyzes market trends across multiple timeframes simultaneously
Intelligent Trading Signals: Automatically identifies potential entry, take-profit, and exit opportunities
Key Level Identification: Marks important support and resistance zones
Risk Alerts: Indicates current risk level based on market conditions
Applicable Scenarios
Day trading
Swing trading
Trend following
How to Use
After adding the indicator to your chart, the system will automatically display analysis results and trading signals. Users can refer to these signals in conjunction with their own trading strategies.

XAU Seasonality + Setup Quality + Month Strength | WarRoomXYZXAU Seasonality Engine is a technical analysis indicator developed for the study of recurring, calendar-based behavior on XAUUSD (Gold).
The tool blends month-of-year seasonality statistics with higher-timeframe context and a setup-quality gate to help users observe when market conditions historically lean strong, weak, or neutral — and how strict trade selection should be during each regime.
Indicator Concept
An indicator for XAUUSD that combines:
1. Seasonality Regime (Month-of-Year Bias)
► Classifies the current month as Strong / Weak / Neutral based on either:
• Preset months (user-defined)
or
• Auto mode (computed from historical monthly performance)
► Strong months suggest a bullish tailwind (not a signal).
► Weak months suggest headwind / caution and require stricter setup quality.
2. Monthly Performance Engine (Under the Hood)
► Uses the symbol’s monthly timeframe data to compute, per calendar month:
• Average monthly return (%)
• Win rate (%) — how often that month closes positive
• Month Strength Score (0–100) — a blended score derived from performance data
► The score is designed to provide a relative strength snapshot of seasonality by month.
3. Month Strength Histogram
► Plots a histogram (0–100) of the current month’s strength score.
• Higher bars = historically stronger month tendency
• Lower bars = historically weaker month tendency
► Optional horizontal reference lines mark “strong” and “weak” zones to make regimes obvious at a glance.
4. Setup Quality Meter (Confluence Filter)
► The indicator calculates a Setup Quality Score (0–100) using market structure and momentum components, such as:
• EMA trend alignment
• Momentum confirmation (EMA fast vs slow)
• Structure break confirmation (BOS)
• Liquidity sweep behavior
• Candle confirmation logic
► This score is intended as a trade-selectivity filter , not a trade executor.
5. Adaptive Rules for Weak Months (Strict Mode)
► When the indicator detects a weak seasonal regime, conditions automatically tighten:
• The A+ threshold increases (adaptive thresholding)
• Optional rule: Weak months require BOS + Sweep + FVG simultaneously before any A+ condition is considered valid
This forces the user into “higher-quality-only” behavior during historically weaker seasonal periods.
🔹1 Visual Components Included
• Seasonality regime label (Strong / Weak / Neutral)
• Optional background shading based on regime
• Month Strength Score histogram (0–100)
• Current month stats: Avg return + win rate
• Setup Quality Meter value (0–100)
• Adaptive A+ threshold display
• Weak-month confluence gate status (BOS / Sweep / FVG pass/fail)
• Optional alerts when strict criteria are met
➣What Means in the XAU Indicator
🔹 Definition (in THIS indicator)
Win Rate = the percentage of historical months that closed positive for the same calendar month.
It is NOT:
trade win rate ❌
signal accuracy ❌
It is a s tatistical seasonality metric .
How It’s Calculated
For each calendar month (January, February, etc.), the indicator:
1.Looks at historical monthly candles (Monthly timeframe).
2. Counts how many times that month:
•Closed higher than it opened (or higher than previous month close).
3. Divides:
Number of positive months
÷
Total number of observed months
× 100
Example: September
If over the last 20 years:
September closed green 14 times
September closed red 6 times
Then:
Win Rate = (14 / 20) × 100 = 70%
That’s what you see as in the dashboard.
What the Win Rate Is Used For
1️⃣ Part of the Month Strength Score
The indicator blends:
•Average Monthly Return (%) → measures magnitude
•Win Rate (%) → measures consistency
Combined into:
Month Strength Score (0–100)
This avoids a common trap:
•A month with 1 huge rally but many losses ≠ reliable
•A month with steady positive closes = higher quality environment
What Win Rate Tells You
High Win Rate (e.g. 65–75%)
•Gold more often closes higher in this month
•Continuation is statistically more likely
•Pullbacks are more likely to resolve in trend direction
Low Win Rate (e.g. 35–45%)
•Gold more often fails to close higher
•More chop, deeper retracements, false breakouts
•Continuation trades statistically struggle
What It Does NOT Tell You
🚫 It does NOT mean:
•“You will win 70% of your trades”
•“Every setup in this month works”
•“Direction is guaranteed”
Seasonality is context, not prediction.
Why This Is Powerful When Combined With Your System
On its own, win rate is just data.
But in your indicator, it’s used to:
•🔒 Raise the A+ threshold in weak months
•🧠 Force BOS + Sweep + FVG confluence
•❌ Block marginal setups automatically
So instead of guessing:
-“Why is gold so choppy this month?”
You know:
-“This month historically underperforms SO I must be stricter.”
➣What Means in the XAU Seasonality Indicator
🔹 Definition (in THIS indicator)
Avg Monthly Return = the average percentage gain or loss of XAUUSD for a specific calendar month, calculated across many years.
It measures magnitude , not frequency.
It is NOT:
•trade profit ❌
•expected return for the next month ❌
•guaranteed performance ❌
It is a historical seasonality tendency.
How It’s Calculated
For each calendar month (January, February, etc.), the indicator:
1.Takes every historical occurrence of that month.
2.Calculates the percentage change of the monthly candle:
(Monthly Close − Previous Monthly Close)
÷ Previous Monthly Close × 100
3. Adds all those percentage changes together.
4. Divides by the total number of observations.
Example: September
Assume over 20 years:
+2.4%, +1.1%, −0.6%, +3.0%, +1.8%, ...
If the sum of all September returns = +28% across 20 years:
Avg Monthly Return = +1.40%
That’s the number displayed in the indicator.
What Avg Monthly Return Is Used For
1️⃣ Measuring Strength of Movement
•Win Rate → “How often does it close green?”
•Avg Monthly Return → “How big are the moves when it works?”
Both are needed.
A month can:
•Win often but move very little
•Move a lot but only occasionally
The indicator combines both to avoid misleading conclusions.
How to Interpret Avg Monthly Return
Positive Avg Return (e.g. +0.8% to +2.0%)
•Gold tends to expand during this month
•Continuation phases are more likely
•Pullbacks are often absorbed
Near-Zero Avg Return (e.g. −0.2% to +0.2%)
•Market is statistically balanced
•Expect chop, rotations, false breaks
•Continuation is less reliable
Negative Avg Return (e.g. −0.5% or worse)
•Downward pressure or heavy mean reversion
•Rallies often fade
•Risk of aggressive stop hunts
What Avg Monthly Return Does NOT Mean
🚫 It does NOT mean:
•“Price will move +1.4% this month”
•“You should buy because the number is positive”
•“This is a guaranteed edge”
It describes historical behavior, not future certainty.
Why Avg Monthly Return Matters More Than People Think
Two months can have the same win rate but behave very differently:
Example:
Month Win Rate Avg Return Reality
Month A 65% +0.2% Small, choppy wins
Month B 55% +1.6% Fewer wins, but strong expansions
Your indicator would rank Month B as stronger, which is correct for continuation-based strategies.
How It Feeds the Month Strength Score
The indicator blends:
•60% Avg Monthly Return (normalized)
•40% Win Rate
This means:
•Big moves matter more than small consistency
•But consistency still matters enough to prevent distortion
Result:
Month Strength Score (0–100)
Which is then used to:
•tighten or relax A+ thresholds
•activate weak-month strict rules
•control trade frequency
🔹2. Intended Use
The indicator is designed as a discretionary analysis tool to support study of:
• seasonal bias and calendar tendencies
• relative strength/weakness across months
• how strict trade selection should be across different regimes
• confluence behavior when seasonal conditions are unfavorable
The tool does not generate forecasts, does not guarantee outcomes, and should not be relied upon as a stand-alone decision mechanism.
🔹3.How to Use XAU Seasonality Engine
Recommended charts: XAUUSD, intraday (5m–15m) with a HTF context (1H–4H).
1. Identify the Seasonal Regime
• Strong month → you can allow more continuation bias (still require structure).
• Neutral month → trade normally, standard criteria.
• Weak month → tighten selection, demand clean A+ conditions only.
2. Read the Month Strength Histogram
• If the score is high (e.g., 70+), the month has historically shown stronger tendency.
• If the score is low (e.g., 40 and below), expect slower conditions, deeper pullbacks, or more chop — and reduce marginal trades.
3. Use the Setup Quality Meter as the Gate
► In normal/strong months:
• A+ threshold is moderate (e.g., 70)
► In weak months:
• A+ threshold is higher (e.g., 80+)
• Optional strict mode: must also pass BOS + Sweep + FVG alignment
4. Example Trade Logic (Framework, Not Signals)
► Bullish framework in a Strong Month:
• Seasonal regime = Strong (tailwind)
• Structure supports bullish continuation (trend alignment)
• Sweep occurs into demand / liquidity grab
• Setup Quality reaches A+ threshold
• Entry: confirmation candle or retrace to key level
• SL: beyond sweep low / invalidation
• TP: nearest liquidity / prior highs / HTF level
► Weak Month rule-set (Strict Mode):
• Seasonal regime = Weak (headwind)
• Only consider trades if:
✅ BOS confirms direction
✅ Sweep occurs and rejects cleanly
✅ FVG exists recently (or is mitigated if you choose that model)
✅ Setup Quality exceeds the elevated adaptive threshold
If any one is missing → no trade
This is not meant to “predict” gold — it’s meant to enforce discipline when seasonality historically underperforms.
🔹4.Limitations and User Responsibility
► The indicator does not represent financial advice or imply performance expectations.
► Seasonality is statistical tendency, not certainty — macro conditions can override it.
► Results vary by broker feed, timeframe, and settings.
► Users should test thoroughly in simulation before applying to live markets.
► All trading decisions, risk management, and execution remain solely the responsibility of the user.
🔹5. Alerts
Optional alerts can notify when:
• a new month begins and the seasonal regime changes
• A+ criteria are met
• weak-month strict conditions pass (BOS + Sweep + FVG)
Alerts are informational only and do not constitute actionable recommendations.
Disclaimer
This script is provided for informational and educational purposes only . It does not provide financial, investment, or trading advice, and it does not guarantee profits or future performance. All decisions made based on this script are solely the responsibility of the user.
This script does not execute trades, manage risk, or replace the need for trader discretion. Market behavior can change quickly, and past behavior detected by the script does not ensure similar future outcomes.
Users should test the script on demo or simulation environments before applying it to live markets and must maintain full responsibility for their own risk management, position sizing, and trade execution.
Trading involves risk, and losses can exceed deposits. By using this script, you acknowledge that you understand and accept all associated risks.

ELDorado_Algo_Commodity_Indicator_V3.3Please read carefully before using this indicator:
This indicator is invite-only and intended strictly for authorized users.
Do NOT share, resell, or redistribute access to this indicator in any form.
Indicator logic and parameters are proprietary and intentionally hidden.
Any screenshots, recordings, or public sharing of this indicator without permission is strictly prohibited.
Usage Guidelines
Use this indicator only on the recommended timeframe and instrument.
This tool is designed to assist decision-making, not to replace discipline or risk management.
Always trade with proper position sizing and defined risk.
The author is not responsible for any financial losses incurred while using this indicator.
Access & Support
Access is provided manually by the author and may be revoked at any time without prior notice.
For access issues or support, please contact the author directly.
By using this indicator, you agree to all the above terms.
— ELDorado

GuidedByGod-Vertical Timestamp-GOD MODEmaximum 15 custom vertical lines for time based study-timing might be off by Hour or so , will fix in future iteration , for now does the job


Cantillon Risk Calculator [Free]Overview Stop guessing your position size. The Cantillon Risk Calculator is a lightweight utility that instantly tells you exactly how many units (Contracts/Coins) to buy based on your account size and risk percentage.
How to Use
Open Settings.
Enter your Account Size (e.g., $10,000) and Risk % (e.g., 1%).
Type in your Stop Loss price.
The table instantly shows your Position Size.
Looking for High Probability Setups? Risk management is only half the battle. To find where to enter using Institutional Order Blocks and Sigma Bands, you need the Cantillon Terminal .

My Price Curtain by @magasineMy Price Curtain by @magasine
Functional Description
My Price Curtain is a high-performance visual analysis tool designed to provide traders with immediate context regarding price positioning relative to institutional benchmarks. Unlike standard moving averages, this indicator creates a "curtain" of data that dynamically colors the chart background and provides real-time performance metrics to identify trend dominance at a glance.
Key Features & Differential Value
Multi-Method Dynamic Benchmarking: Choose between five different calculation methods: SMA, EMA, WMA, RMA, or a manual Fixed Price. This allows you to switch from a standard technical trend (MA) to a "break-even" or "entry point" analysis (Fixed Price) instantly.
Intelligent Visual Feedback: The "Curtain" logic automatically colors the chart background—Green for Bullish dominance and Red for Bearish dominance—reducing cognitive load during fast-paced sessions.
Advanced Statistical Tracking: The indicator includes a built-in Performance Table that tracks the percentage of bars closing above or below the selected benchmark. This helps traders quantify the strength of a trend over the entire visible dataset.
Precision Labeling & Distance Analysis: A dynamic, color-coded label tracks the price on the Y-axis. It calculates and displays the exact percentage distance from the price to the benchmark in real-time, helping to identify overextended moves.
Optional Deviation Zones: Enable visual "Safety Zones" (boxes) that project a user-defined percentage deviation from the average, assisting in identifying potential volatility expansion or exhaustion areas.
Trading Utilities
Trend Confirmation: Use the background color and "Bars Above" percentage to confirm if you are trading with the path of least resistance.
Scalping & Intraday Support: The "Distance" metric is essential for scalpers to avoid entering trades too far from the average (mean reversion risk).
Custom Strategy Benchmark: Use the "Fixed Price" mode to set your specific entry price and see your real-time performance and "curtain" status relative to your position.


NIFTY_2MIN_CVD_Absorption_long_StrategySummary
This strategy is an intraday system designed for the Nifty index on a 2-minute timeframe, focusing on high-probability reversal entries. It utilizes price action patterns and Cumulative Volume Delta (CVD) to identify market turning points.
Long Strategy: Concept & Core Logic
The long strategy is engineered to identify "V-shaped" recoveries where selling pressure is exhausted and absorbed by aggressive buyers.
Price Action Trigger: The strategy looks for a specific two-part sequence:
Sudden Bearish Movement: A rapid downward move representing a final flush of sellers.
Sudden Reversal: Immediately followed by a strong, high-momentum bullish (green) candle, indicating a swift change in market sentiment.
CVD Absorption Filter: To confirm the validity of the reversal, the strategy analyzes the Cumulative Volume Delta (CVD). It specifically looks for instances where the relative movement of CVD is significantly higher than the corresponding price movement. This divergence suggests "selling absorption"—where large buy orders are soaking up sell-side liquidity, creating a floor for the reversal.
Risk Management (Long)
The strategy utilizes fixed exit parameters based on the underlying Nifty price points:
Take Profit: 25 points.
Stop Loss: 30 points.
Intended Use
This tool is intended for traders who study mechanical, rule-based systems. It demonstrates how price action, volume delta divergence (CVD), and trend filters can be combined to time entries in both trending and reversal market conditions.
Disclaimer: This script is for educational and informational purposes only. It is not financial advice. All trading involves risk, and past performance is not indicative of future results. Please conduct your own research and backtesting before making any trading decisions.

ATR Distance from 50 SMA By DanBobDanA simple indicator that measures the distance between current price and the 50 SMA
The average momentum swing trade might run 7 times the ATR before pulling back
Therefore, its recommended to not buy a stock that is beyond 4 times its ATR to the 50 SMA
This script will quickly and easily calculate the 50 SMA to ATR distance for you

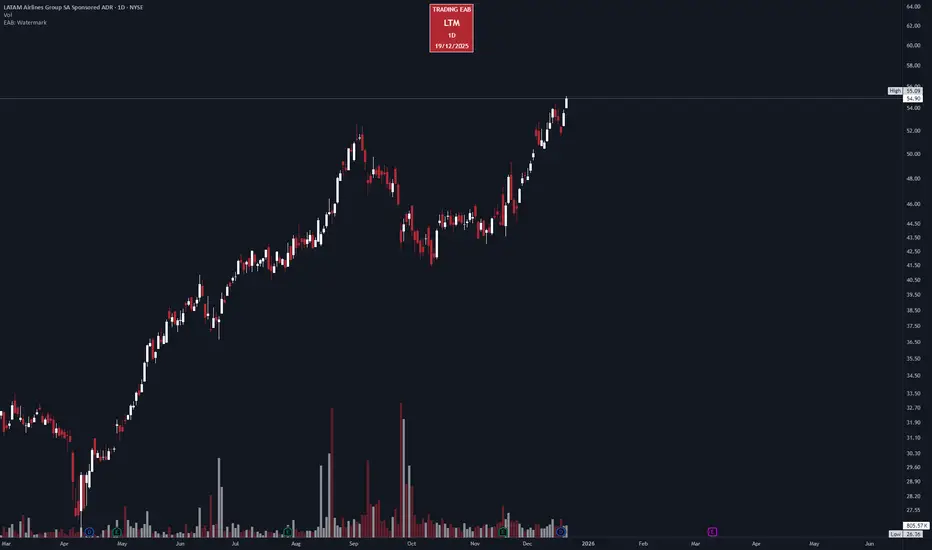
EAB: WatermarkEAB: Watermark displays a fully customizable watermark and symbol information panel directly on the chart using table objects.
The indicator allows you to add custom text (watermark), symbol details, timeframe and date, with flexible control over position, size, colors and borders. Each element can be enabled or disabled independently, ensuring a clean and distraction-free chart layout.
Features
• Custom watermark text displayed anywhere on the chart.
• Optional symbol information panel with text, ticker, timeframe and date.
• Independent controls for visibility, position, text size, colors and borders.
• Dynamic table sizing to avoid empty space when elements are disabled.
• Designed for a clean, professional chart appearance.
Notes
• This is a visual and informational tool only.
• No trading signals or alerts are generated.
mucip sat stratejisiThis strategy performs scaled short entries across multiple timeframes.
Position additions are executed using small capital allocations (1–2% per entry) to manage risk efficiently.
It is primarily optimized for major cryptocurrencies.
The strategy is designed for futures markets and operates with leverage in the 10–15x range.
